

Statistics Extraction
1. Description
This tool automatically extracts statistics metrics of any type of raster at the microplot or plot level.
This article will cover the 3 analytics:
- Raster Statistics Extraction for Microplot: computes statistics for any raster
- Raster Statistics Extraction for Field: computes statistics for any raster
- Reflectance Statistics Extraction for Microplot: compute index statistics from a reflectance map and a custom spectral index formula
2. Prerequisites
Raster Statistics Extraction for Microplot:
- Any raster file (RGB orthomosaic, reflectance map, spectral index)*
- Microplot vector file*
Raster Statistics Extraction for Field:
- Any raster file (RGB orthomosaic, reflectance map, spectral index)*
- Field boundaries *
- Grid size*
Reflectance Statistics Extraction for Microplot:
- Reflectance map*
- Custom index formula*
- Microplot vector file*
*Mandatory
3. Workflow
3.1 Raster statistics extraction for microplot
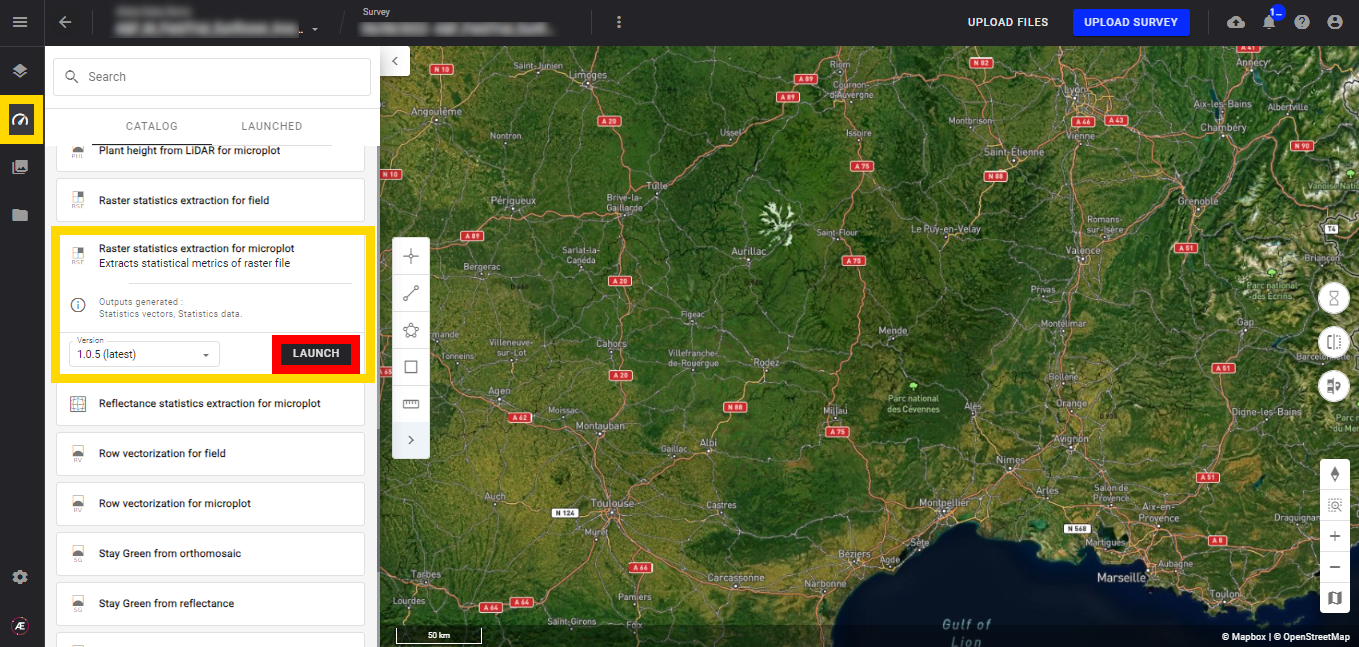
Step 1 - In the "Analytics" tab, search and select "Raster statistics extraction for microplot" and click on "LAUNCH".
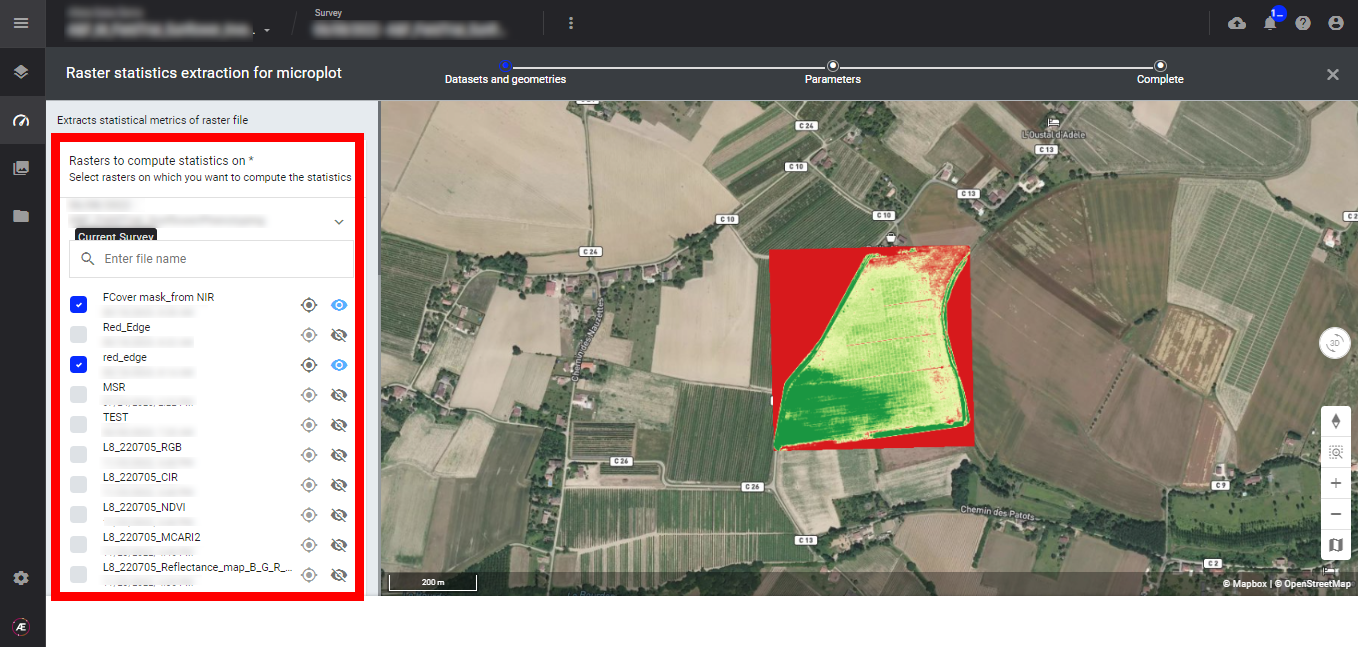
Step 2 - Select the "Rasters to compute statistics on".
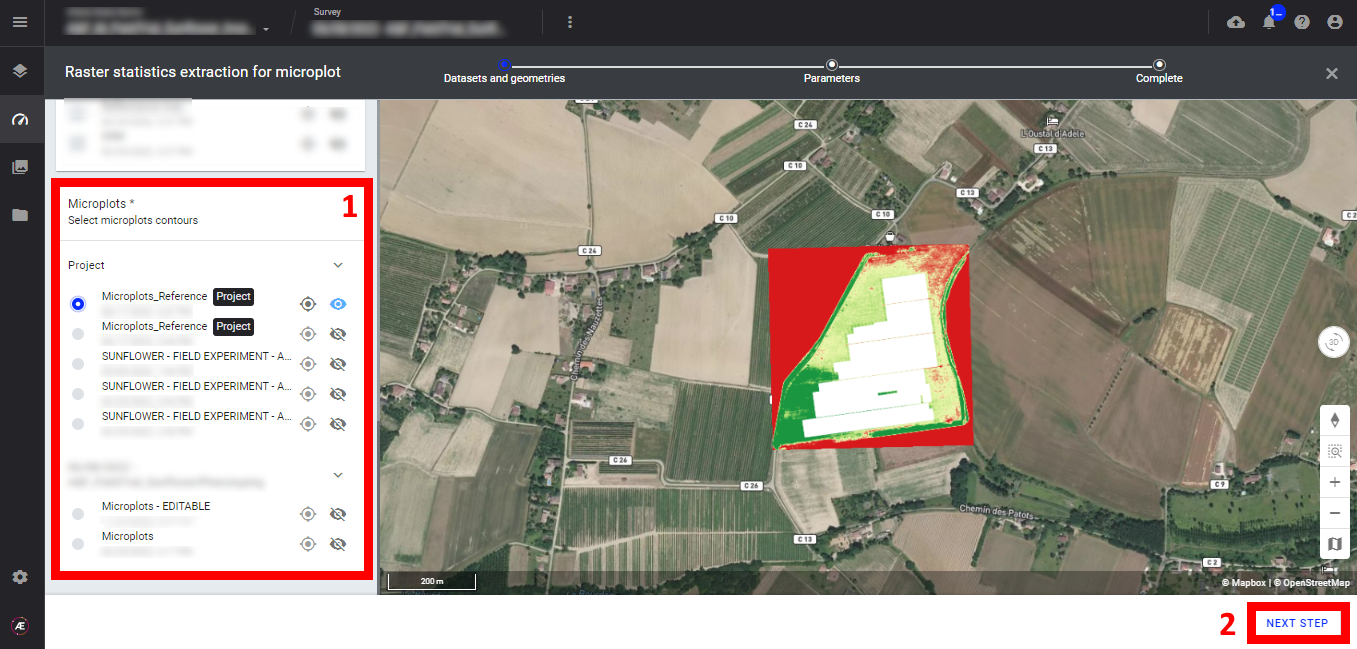
Step 3 - Select the "Microplots" (1) and click on "NEXT STEP" (2).
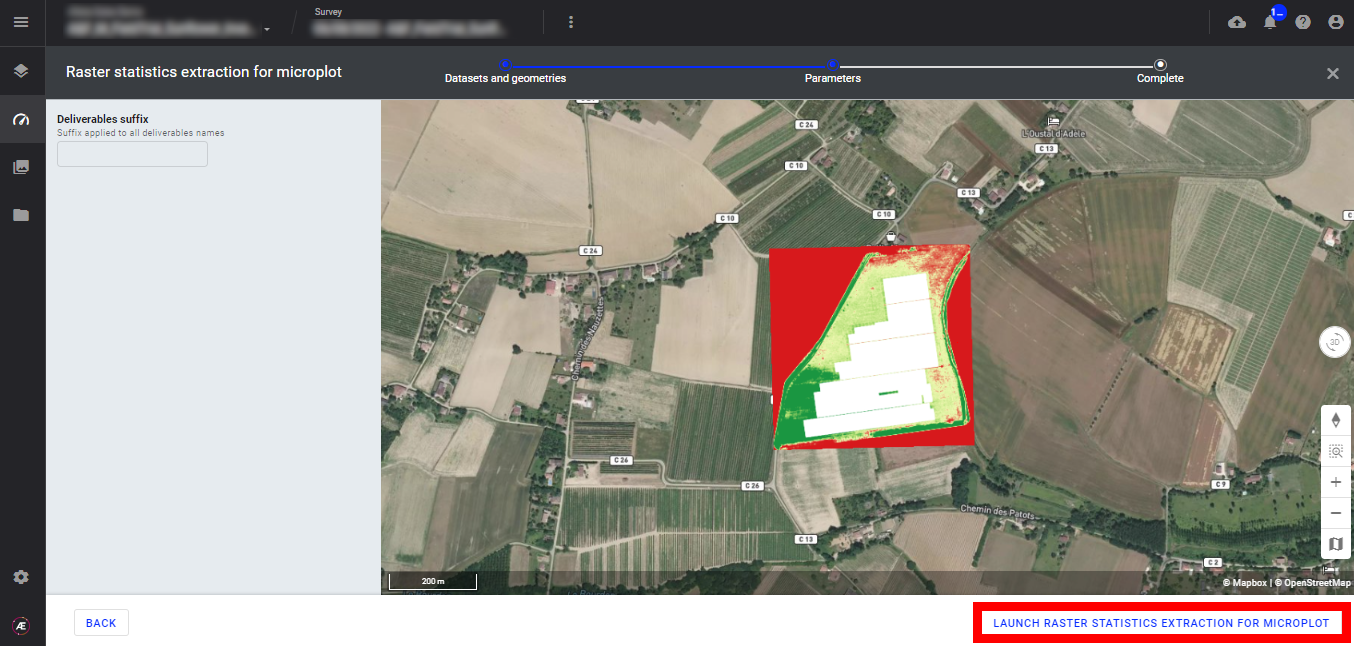
Step 4 - Fill in the field 'Deliverable suffix".
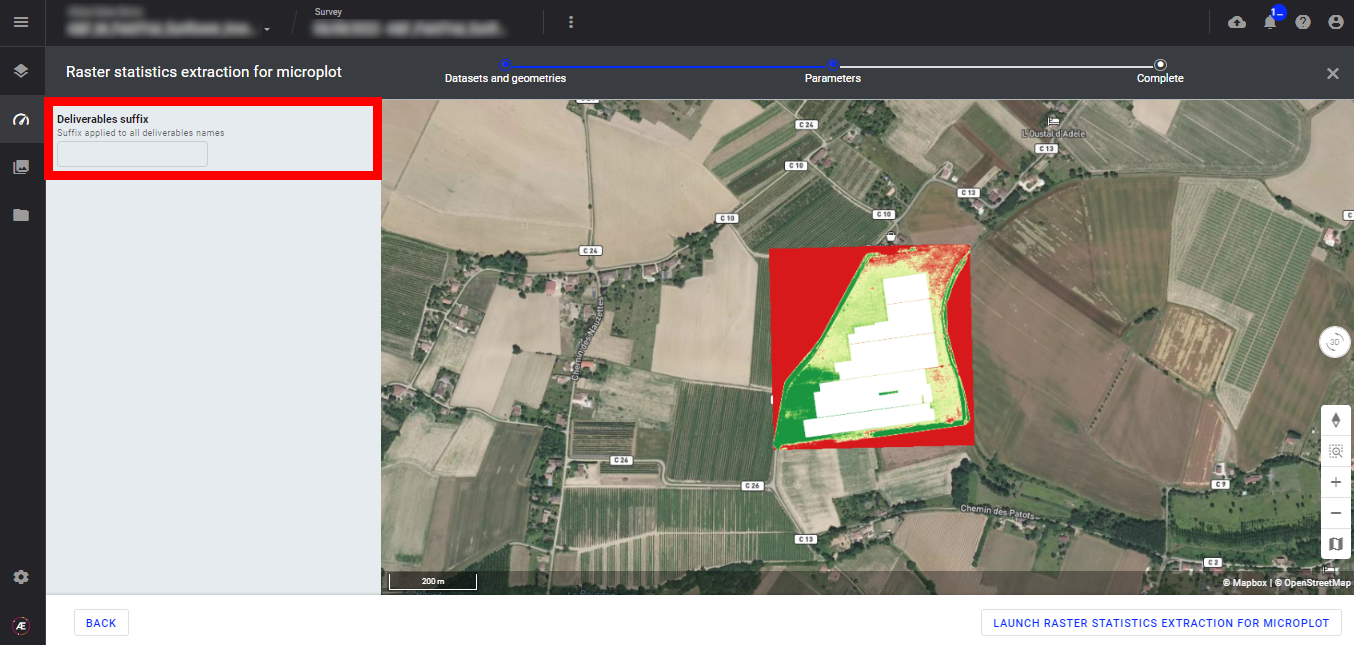
Step 5 - Click on "LAUNCH RASTER STATISTICS EXTRACTION FOR MICROPLOT".
Step 6 - Click on "FINISH".

3.2 Raster statistics extraction for field
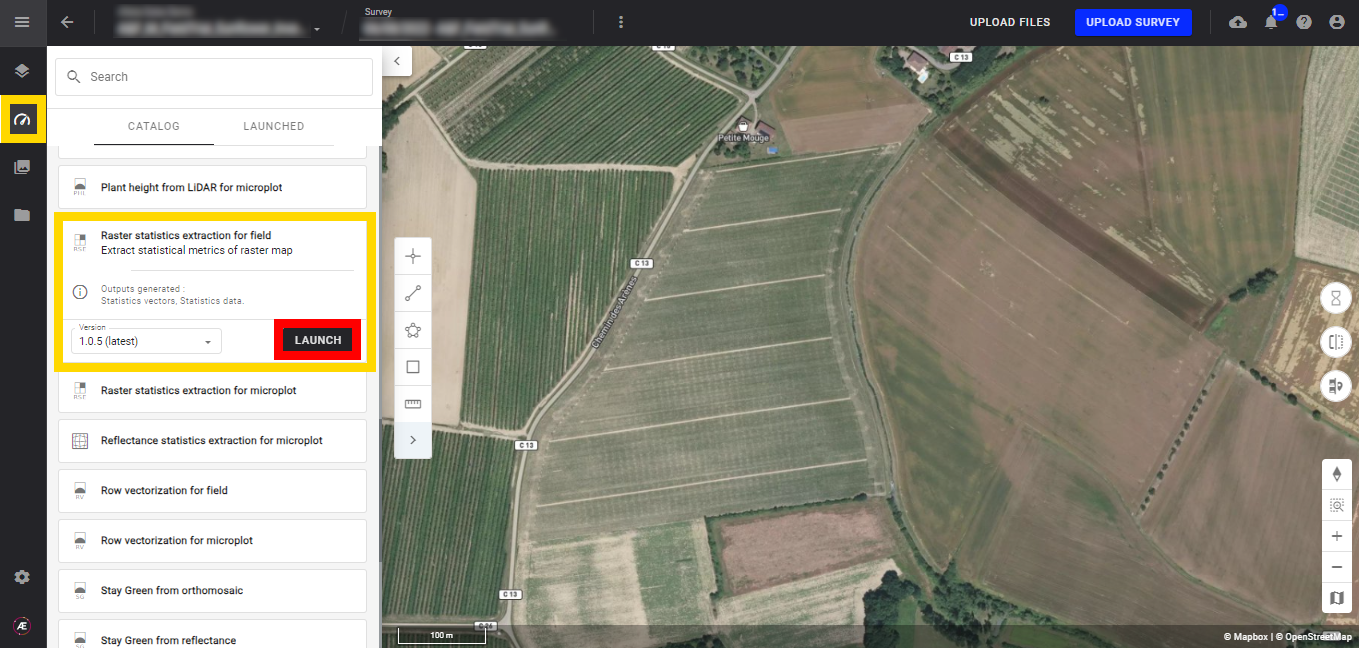
Step 1 - In the "Analytics" tab, search and select "Raster statistics extraction for field" and click on "LAUNCH".
Step 2 - Select the "Rasters to compute statistics on".

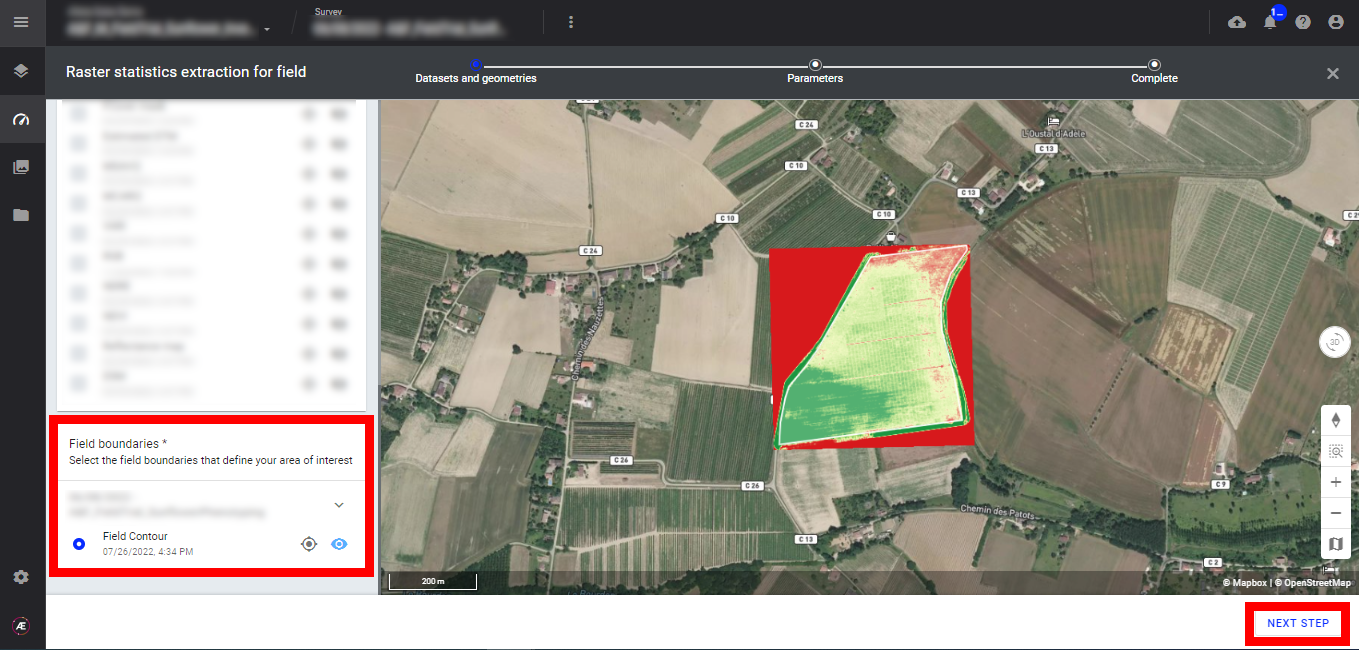
Step 3 - Select the "Field boundaries" (1) and click on "NEXT STEP" (2).
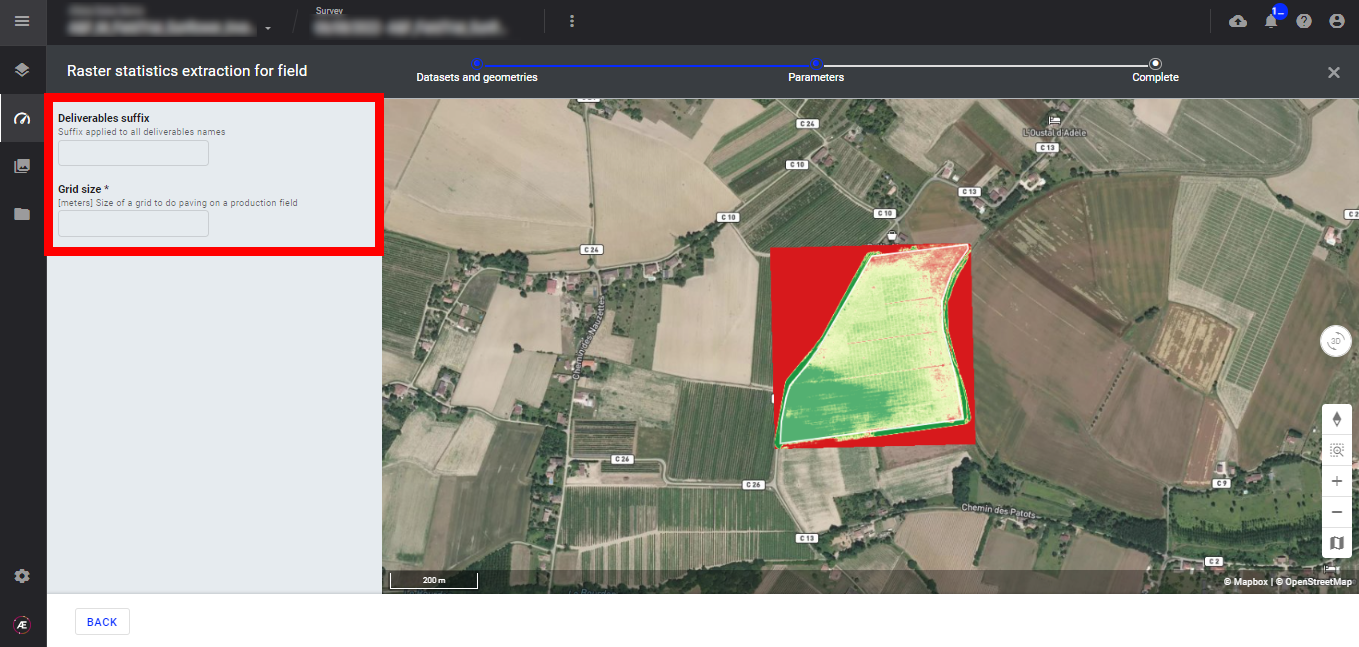
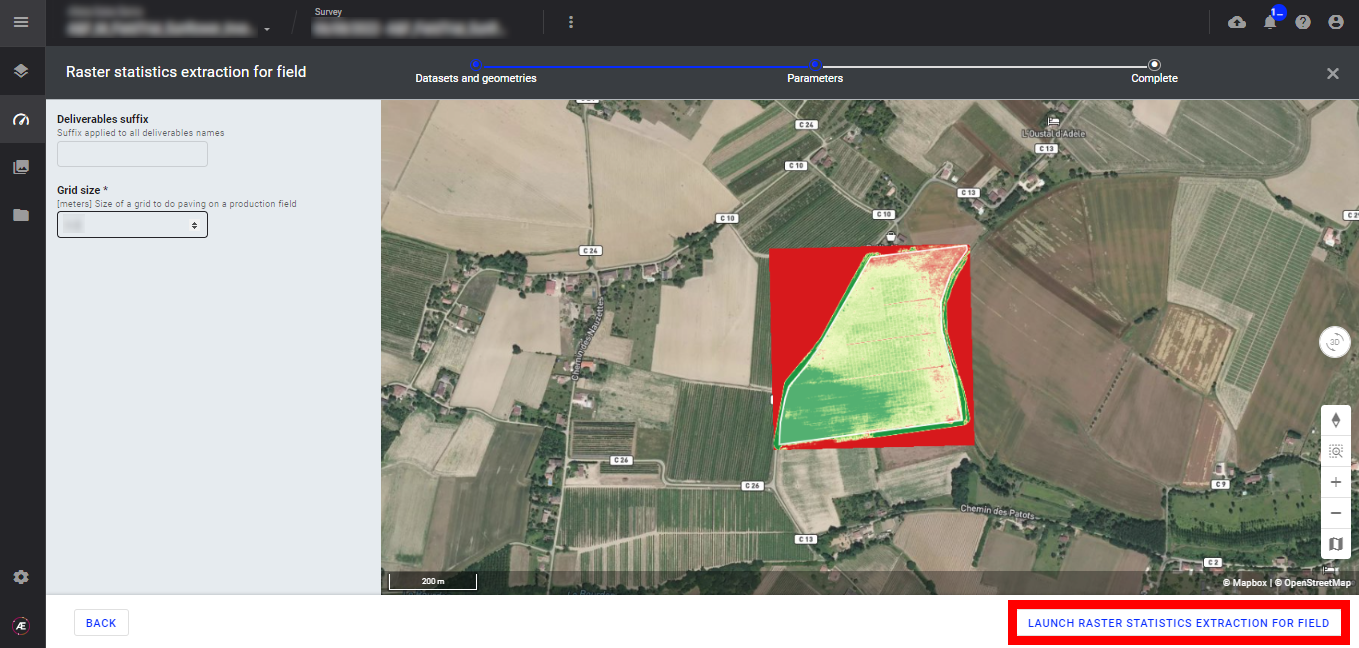
Step 4 - Fill in the field 'Deliverable suffix" and define the "Grid size".
Step 5 - Click on "LAUNCH RASTER STATISTICS EXTRACTION FOR FIELD".
Step 6 - Click on "FINISH".

3.3 Reflectance statistics extraction for microplot
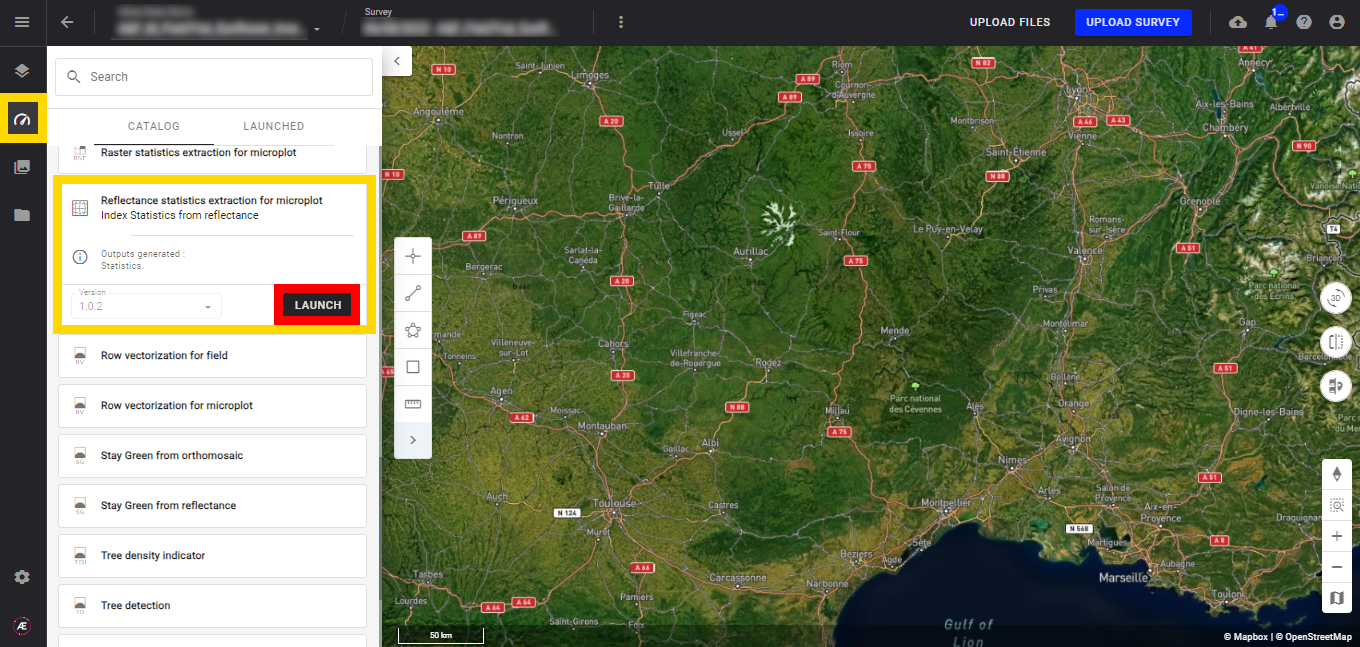
Step 1 - In the "Analytics" tab, search and select "Reflectance statistics extraction for microplot" and click on "LAUNCH".
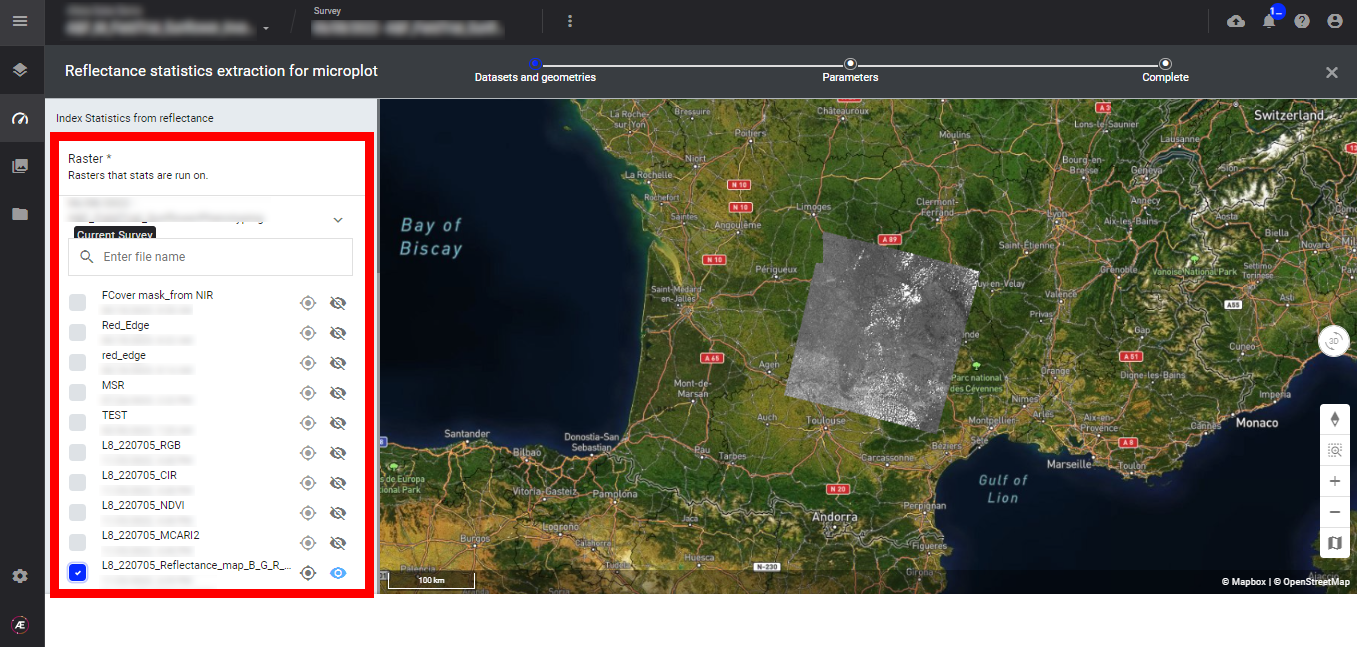
Step 2 - Select the reflectance map.
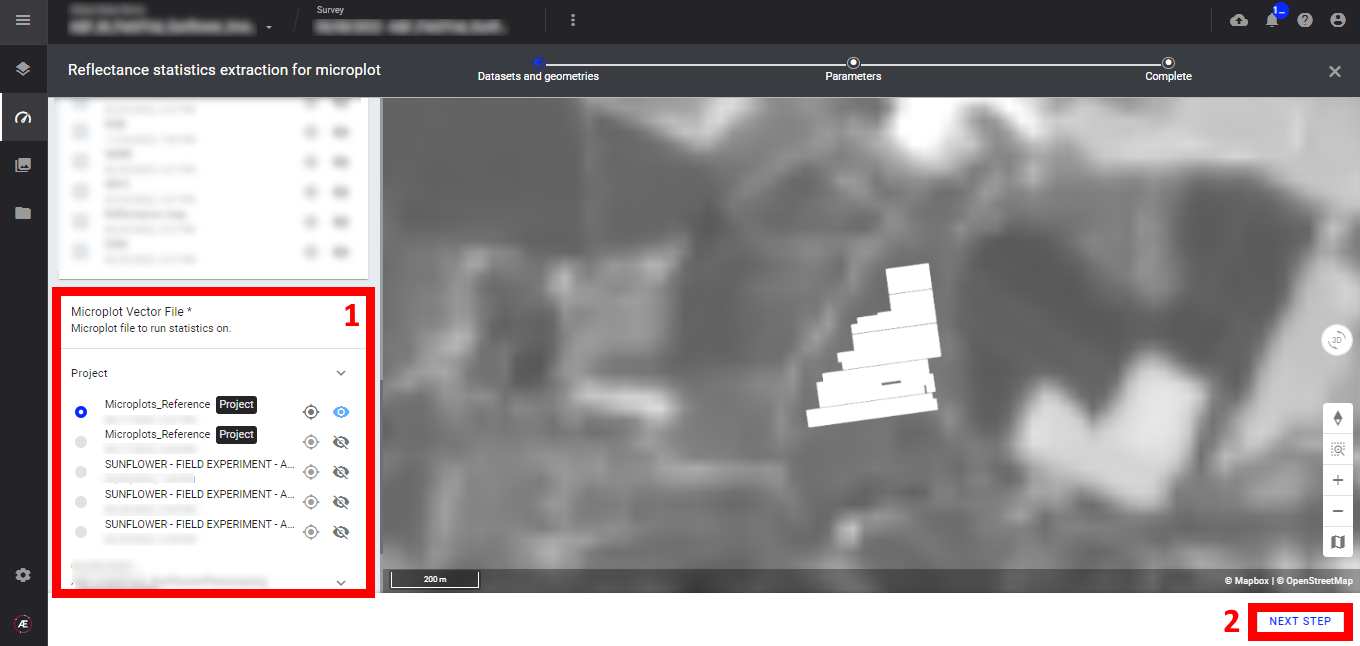
Step 3 - Select the "Field boundaries" (1) and click on "NEXT STEP" (2).
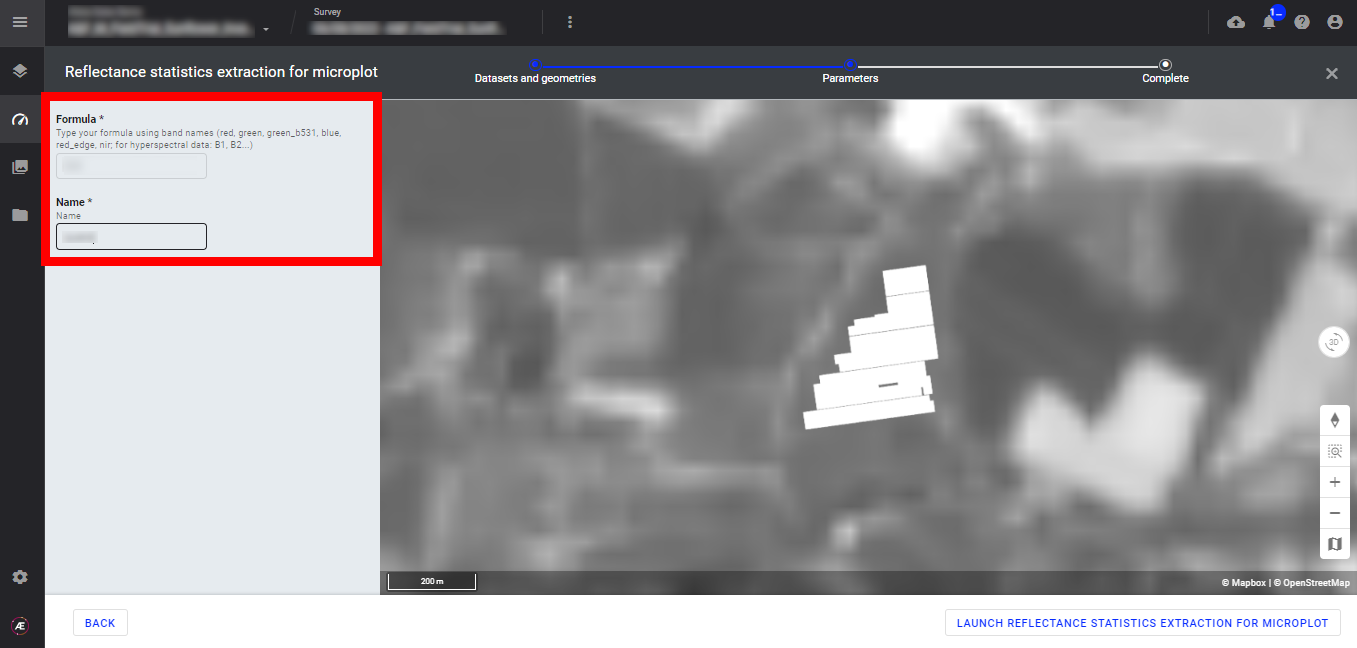
Step 4 - Fill in the spectral index formula and spectral index name.
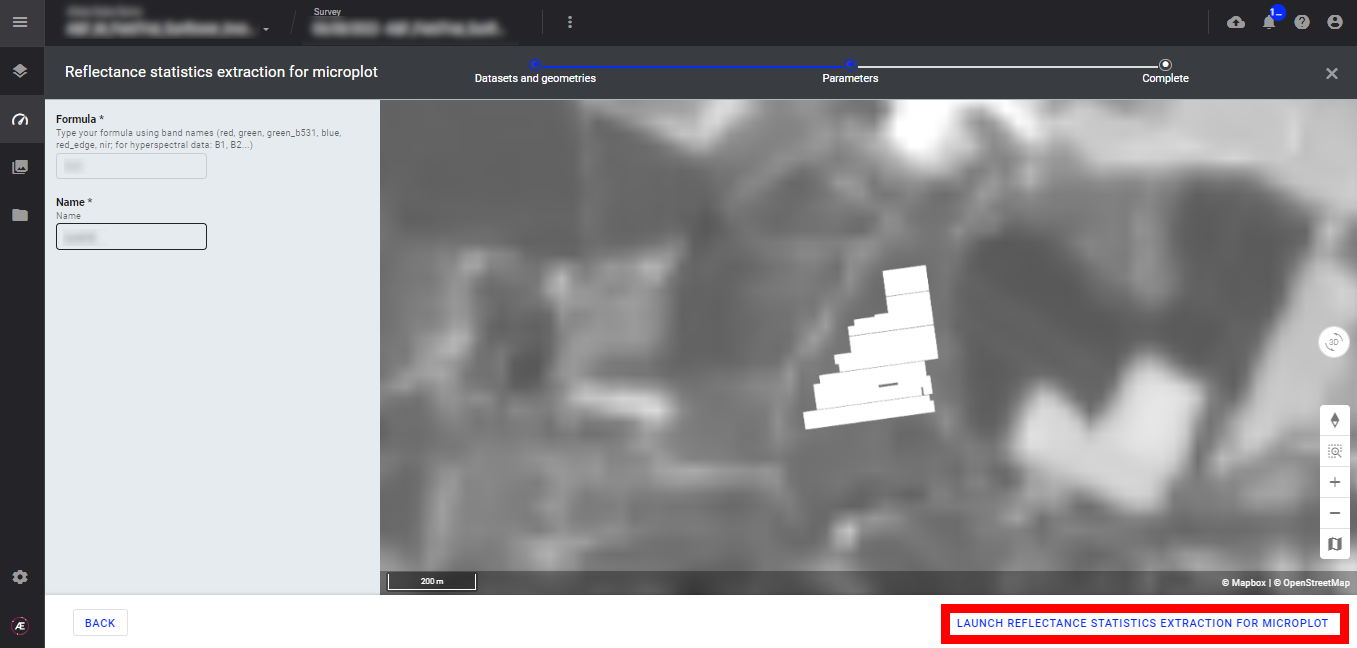
Step 5 - Click on "LAUNCH REFLECTANCE STATISTICS EXTRACTION FOR MICROPLOT".
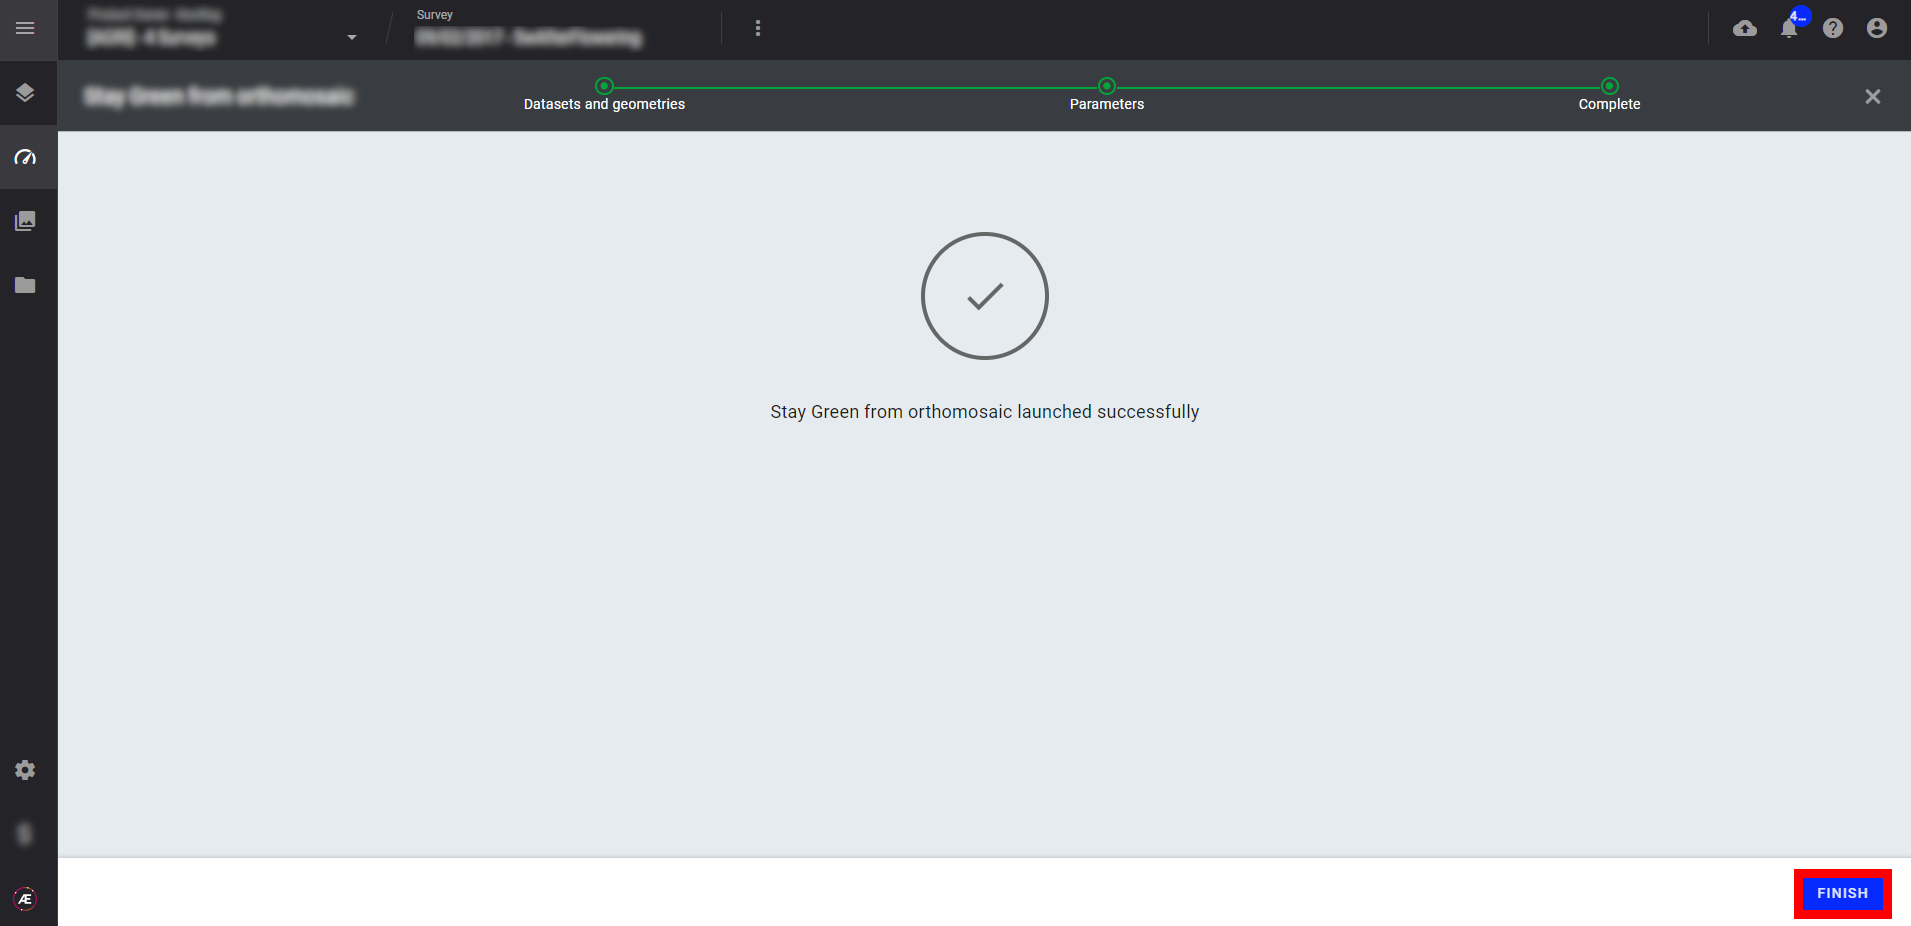
Step 6 - Click on "FINISH".
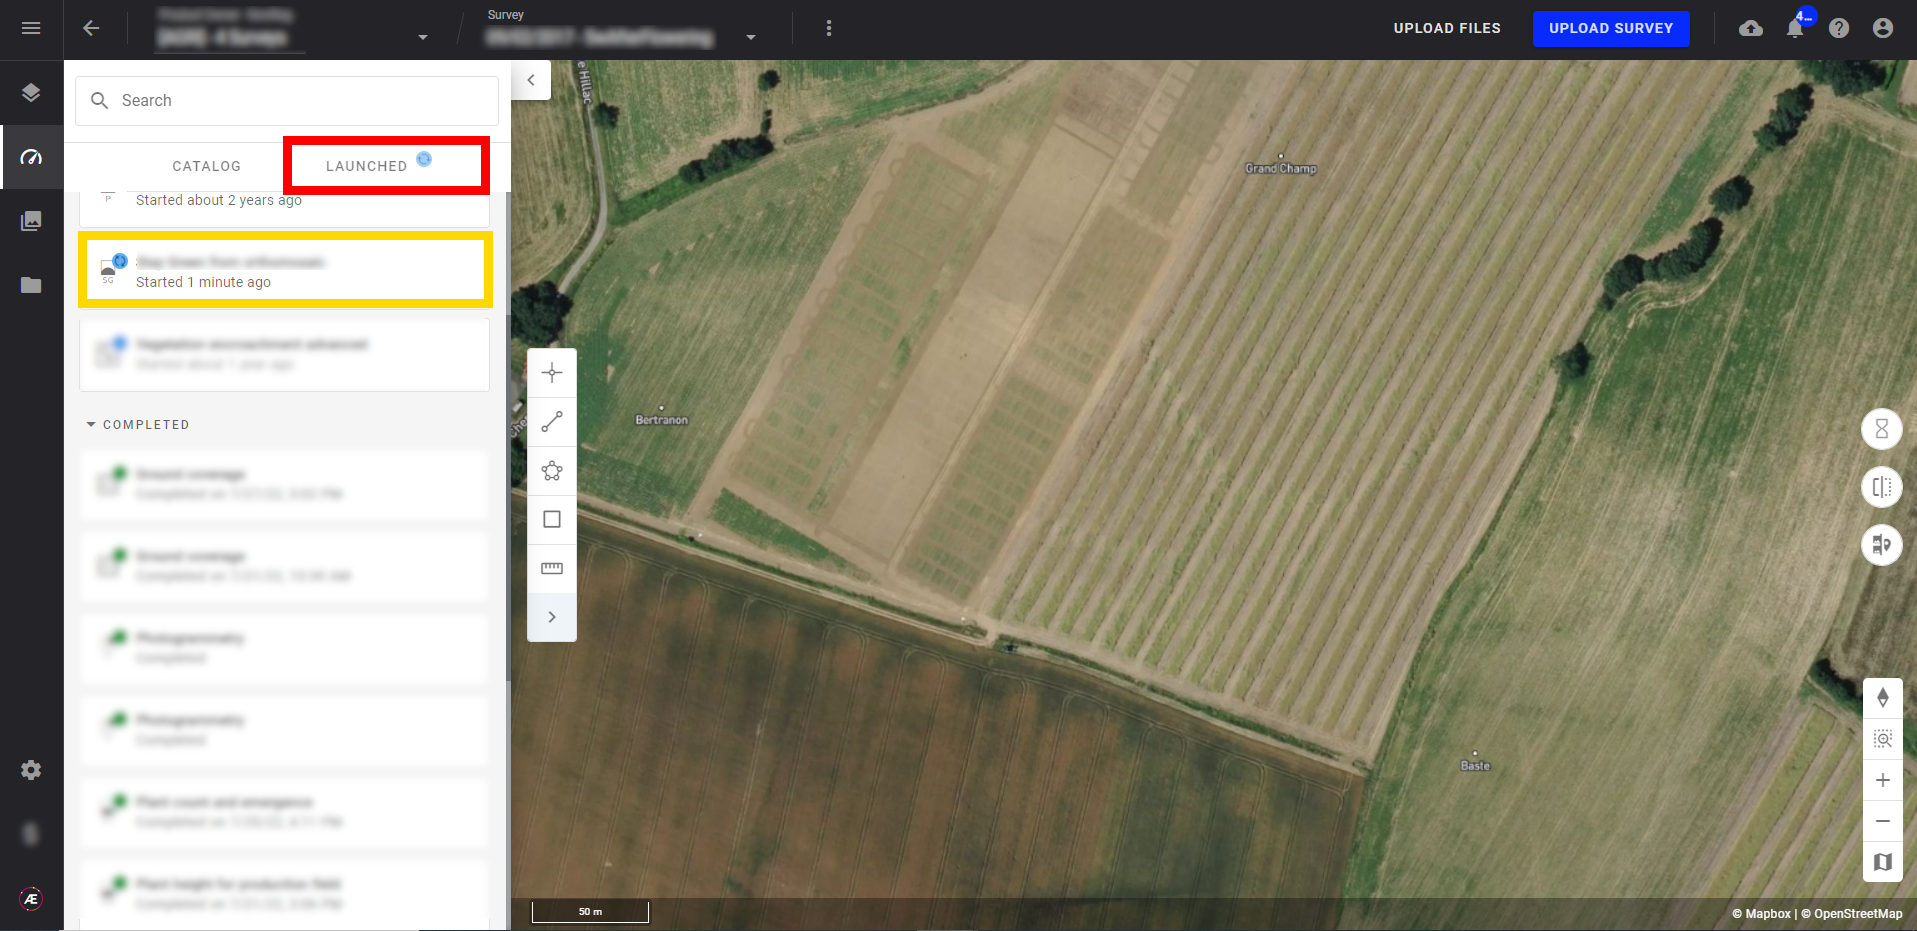
4. Status and Progression
Check in the "LAUNCHED" tab that the analytics is in progress.
Aether will notify the user that the analytics results are available.
5. Results
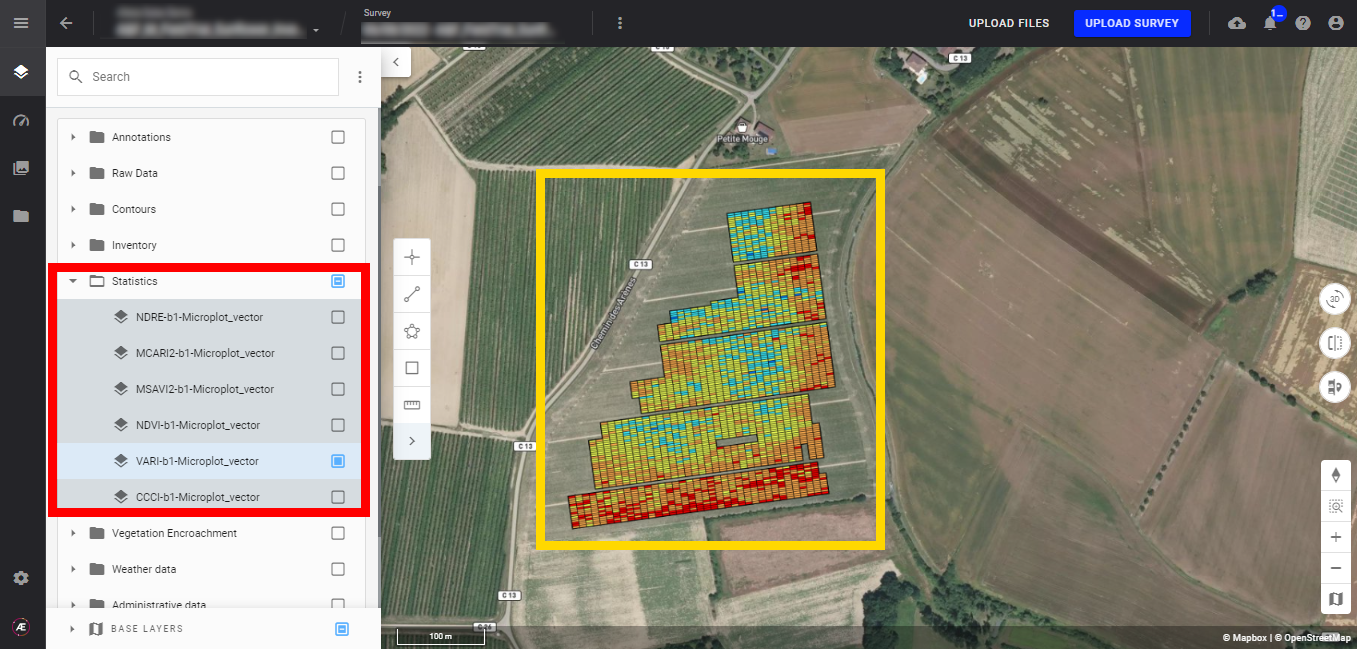
In the "Statistics" subgroup of "SURVEY DATA" find the layers.
6. Deliverables
6.1 Files
In the "Download" section find files issue from the analytics.
Statistics for microplot:
- indicesname-bandnumber-vectorfileinputsname + suffix.geojson (Ex : NDVI-b1-Microplots Trial.geojson)
- Statistics CSV + suffix.csv
Statistics for field:
- indicesname-bandnumber-vectorfileinputsname + suffix.geojson (Ex: NDVI-b1-Field Boundaries Production.geojson)
- Statistics CSV + suffix.csv
6.2 Attributes
Statistics for microplot and field:
Here are the attributes of the geojson file deliverable:
- Attributes from the input vector file
- mean: Average value of the pixels inside the geometry
- median: Median of the pixels inside the geometry
- min: Minimum value of the pixels inside the geometry
- max: Maximum value of the pixels inside the geometry
- std-dev: Standard deviation of the pixels inside the geometry
- var: Variance of the pixels values inside the geometry
- count: Number of valid pixels used inside the geometry
- decile_1: decile 1
- decile_2: decile 2
- decile_3: decile 3
- decile_7: decile 7
- decile_8: decile 8
- decile_9: decile 9
- percentile_1: percentile 1
- percentile_5: percentile 5
- percentile_95: percentile 95
- percentile_99: percentile 99
7. How to use the outputs
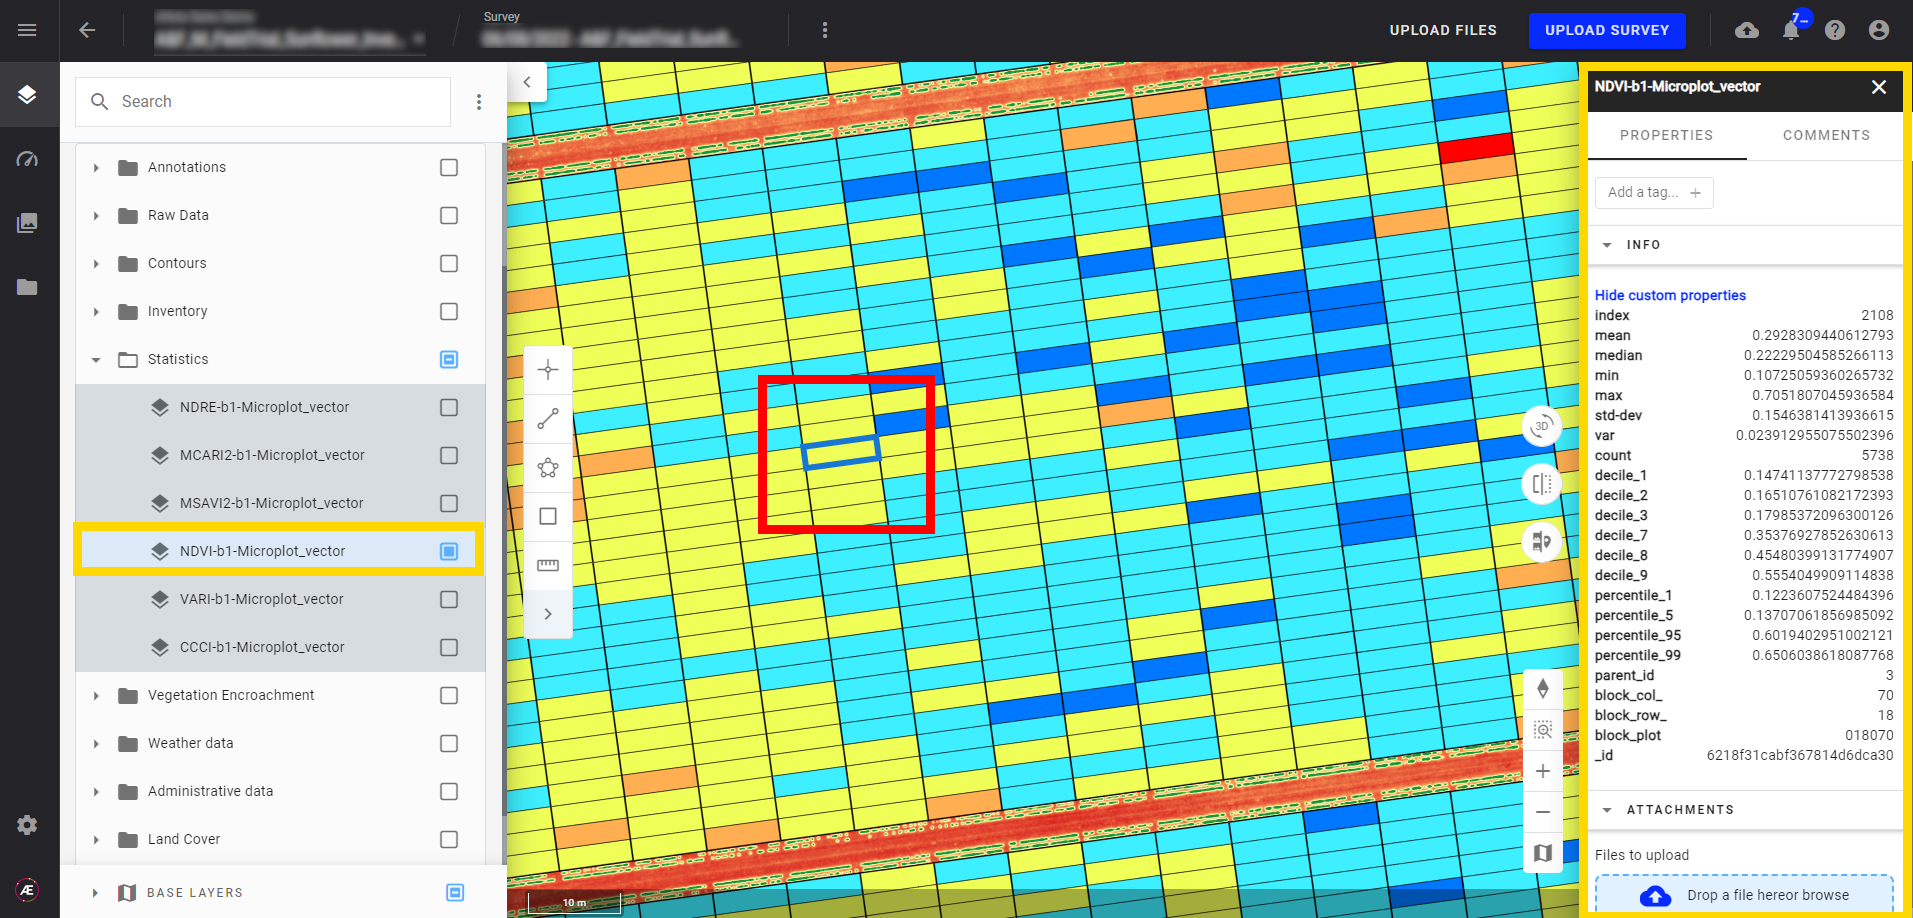
If the vector is displayed it is recommended to display the spectral index map for interpretation.
To display the statistics, go to the layer panel in the Statistics. Click on the desired vector to open the info panel on the right. Click on the geometry you wish to know the statistics and open custom properties to display all the attributes of this deliverable.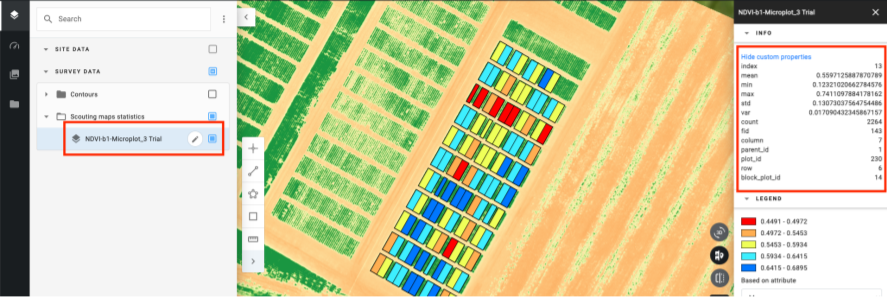
Statistics can be downloaded and exported in multiple formats from the "Download" menu, see Download and Export Data.
