

Flowering Characterization
1. Description
Estimates the percentage of flowering for canola or sunflower
This article will cover the 2 analytics:
- Flowering characterization from orthomosaic
- Flowering characterization from reflectance
2. Prerequisites
Flowering Characterization from orthomosaic:
- RGB Orthomosaic*
- Microplots* or Field Boundaries*
- Grid Size*
Flowering Characterization from reflectance:
- Raster reflectance map*
- Microplots or Field boundaries*
- Grid Size*
*Mandatory
3. Workflow
3.1 Flowering characterization from orthomosaic
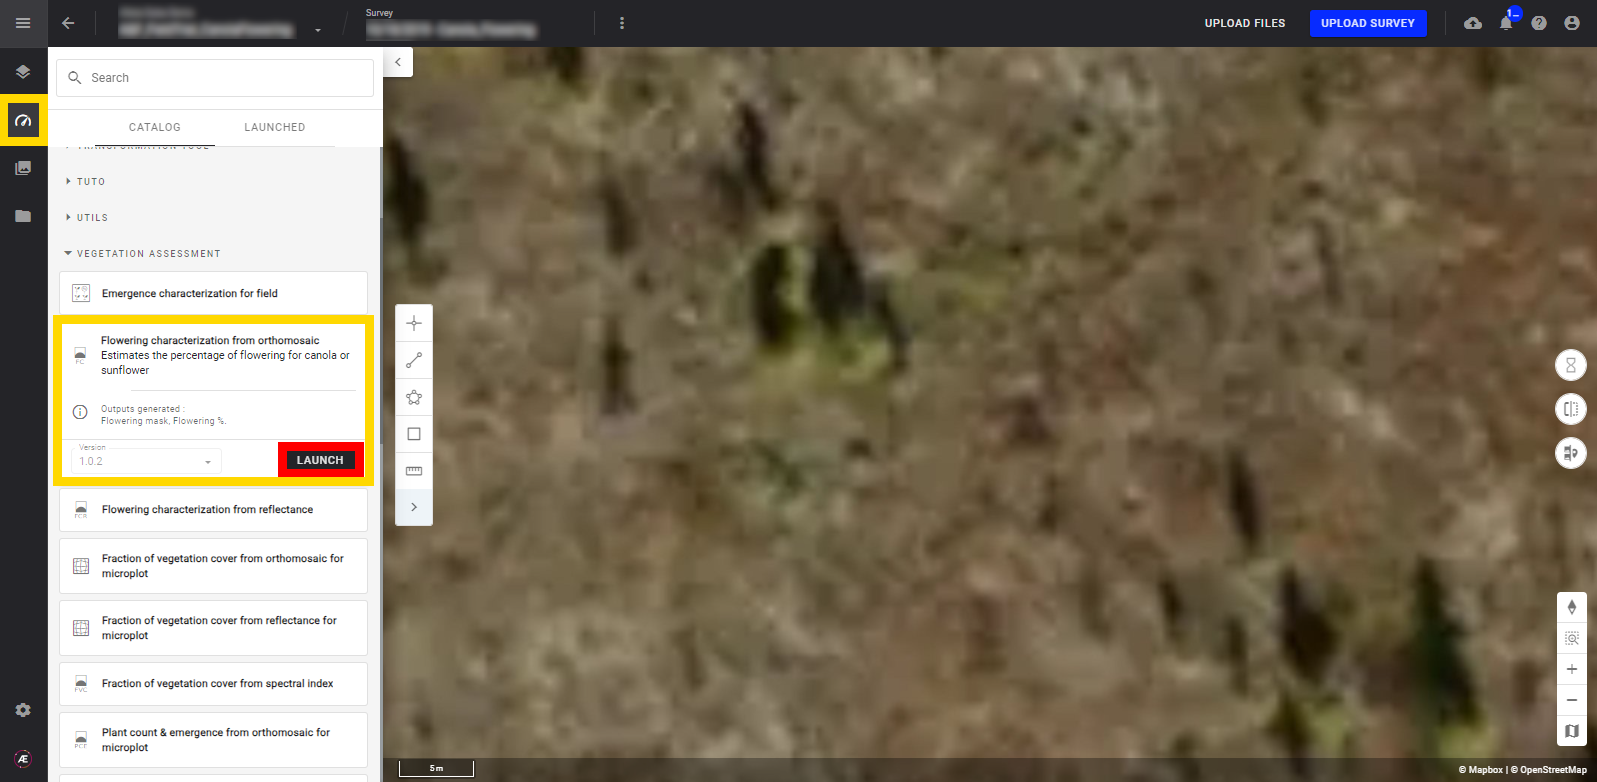
Step 1 - In the "Analytics" tab, search and select "Flowering characterization from orthomosaic" and click on "LAUNCH".
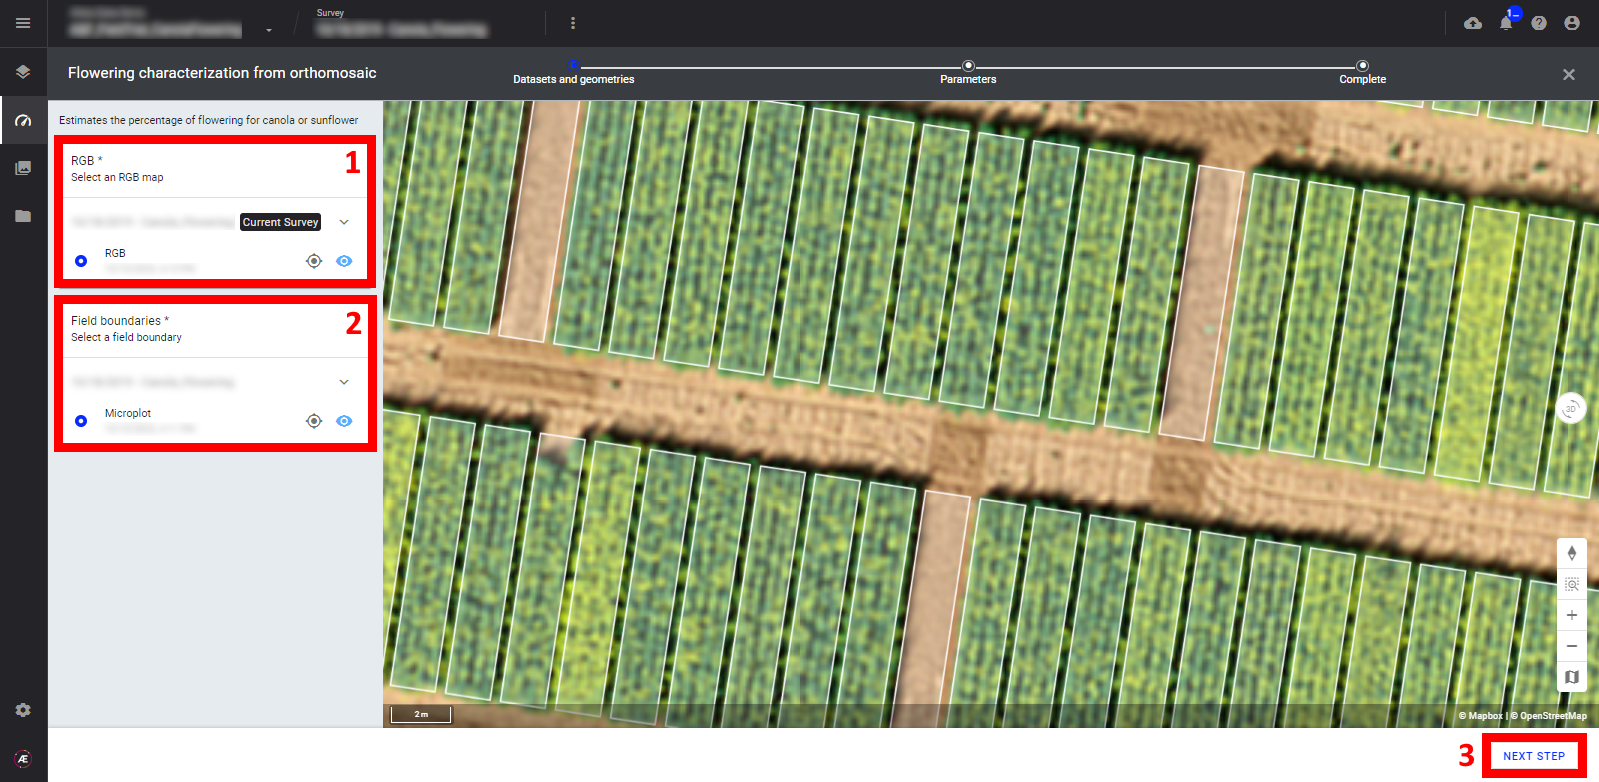
Step 2 - Select the "RGB map" (orthomosaic) (1) and the "Field Boundaries" (2) (field boundaries vector or microplot vector) and click on "NEXT STEP" (3).
Step 3 - Define the grid size, for microplot skip this step.
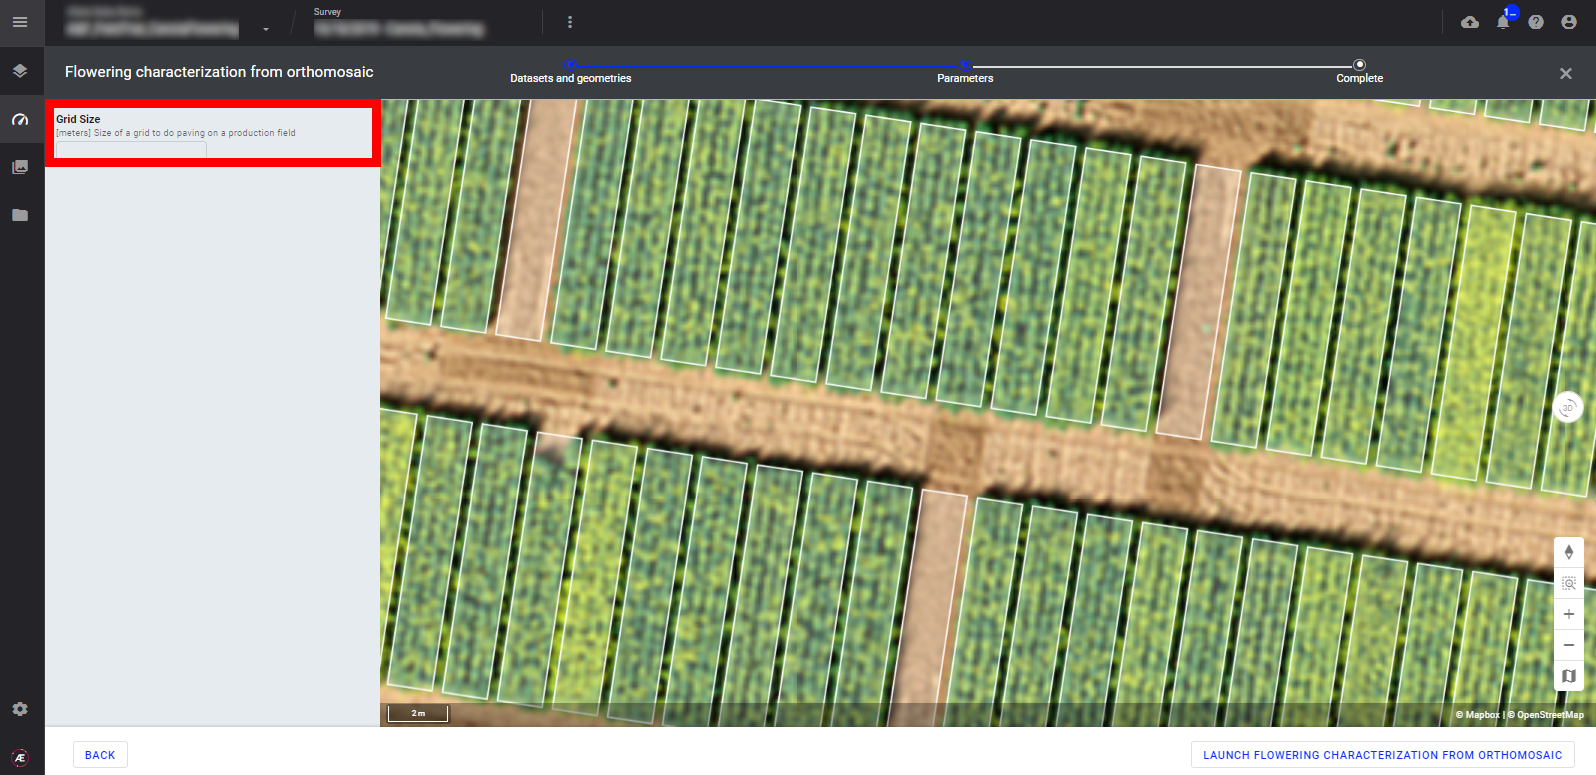
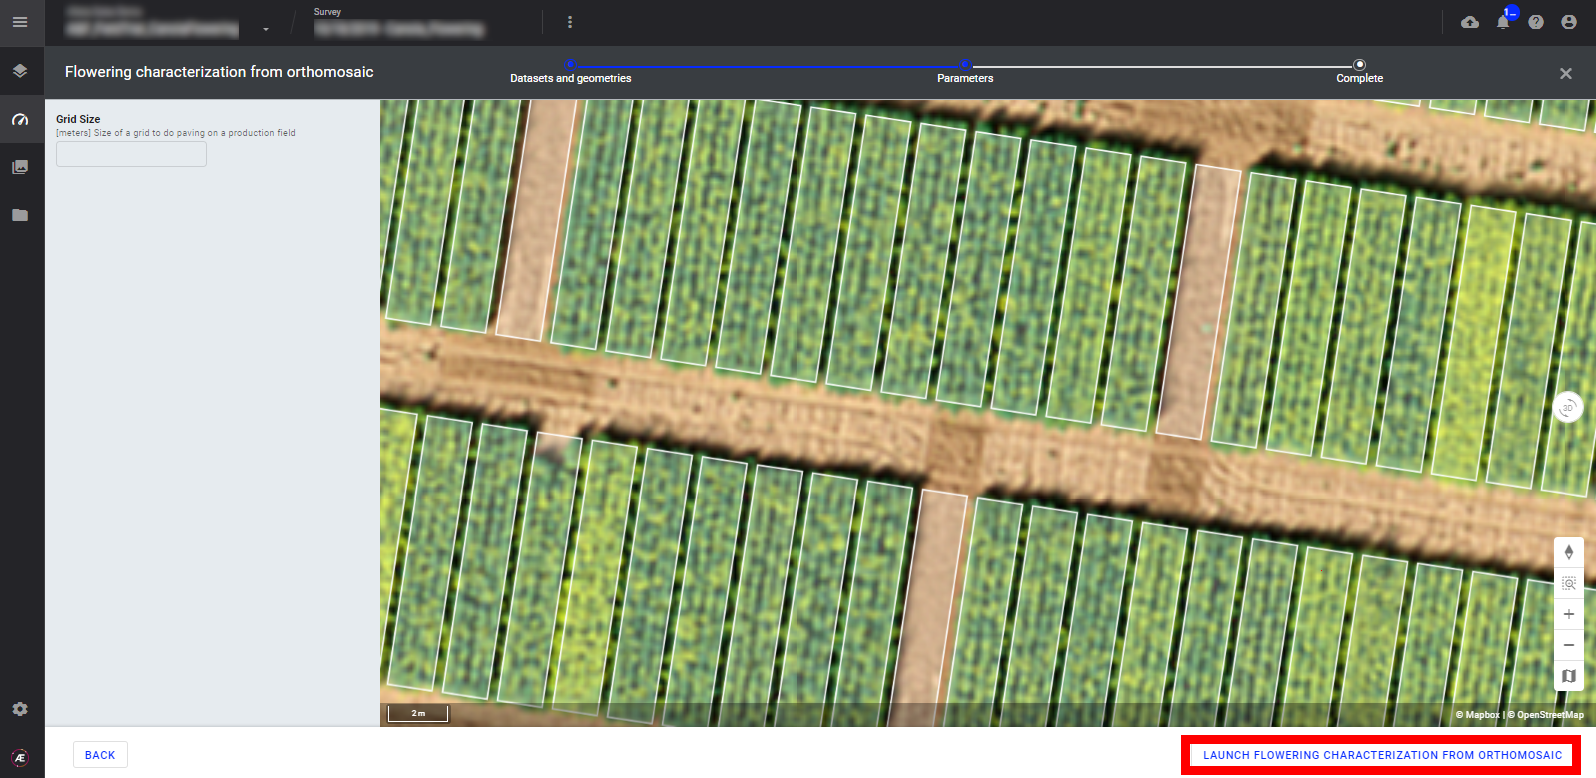
Step 4 - Click on "LAUNCH FLOWERING CHARACTERIZATION FROM ORTHOMOSAIC".
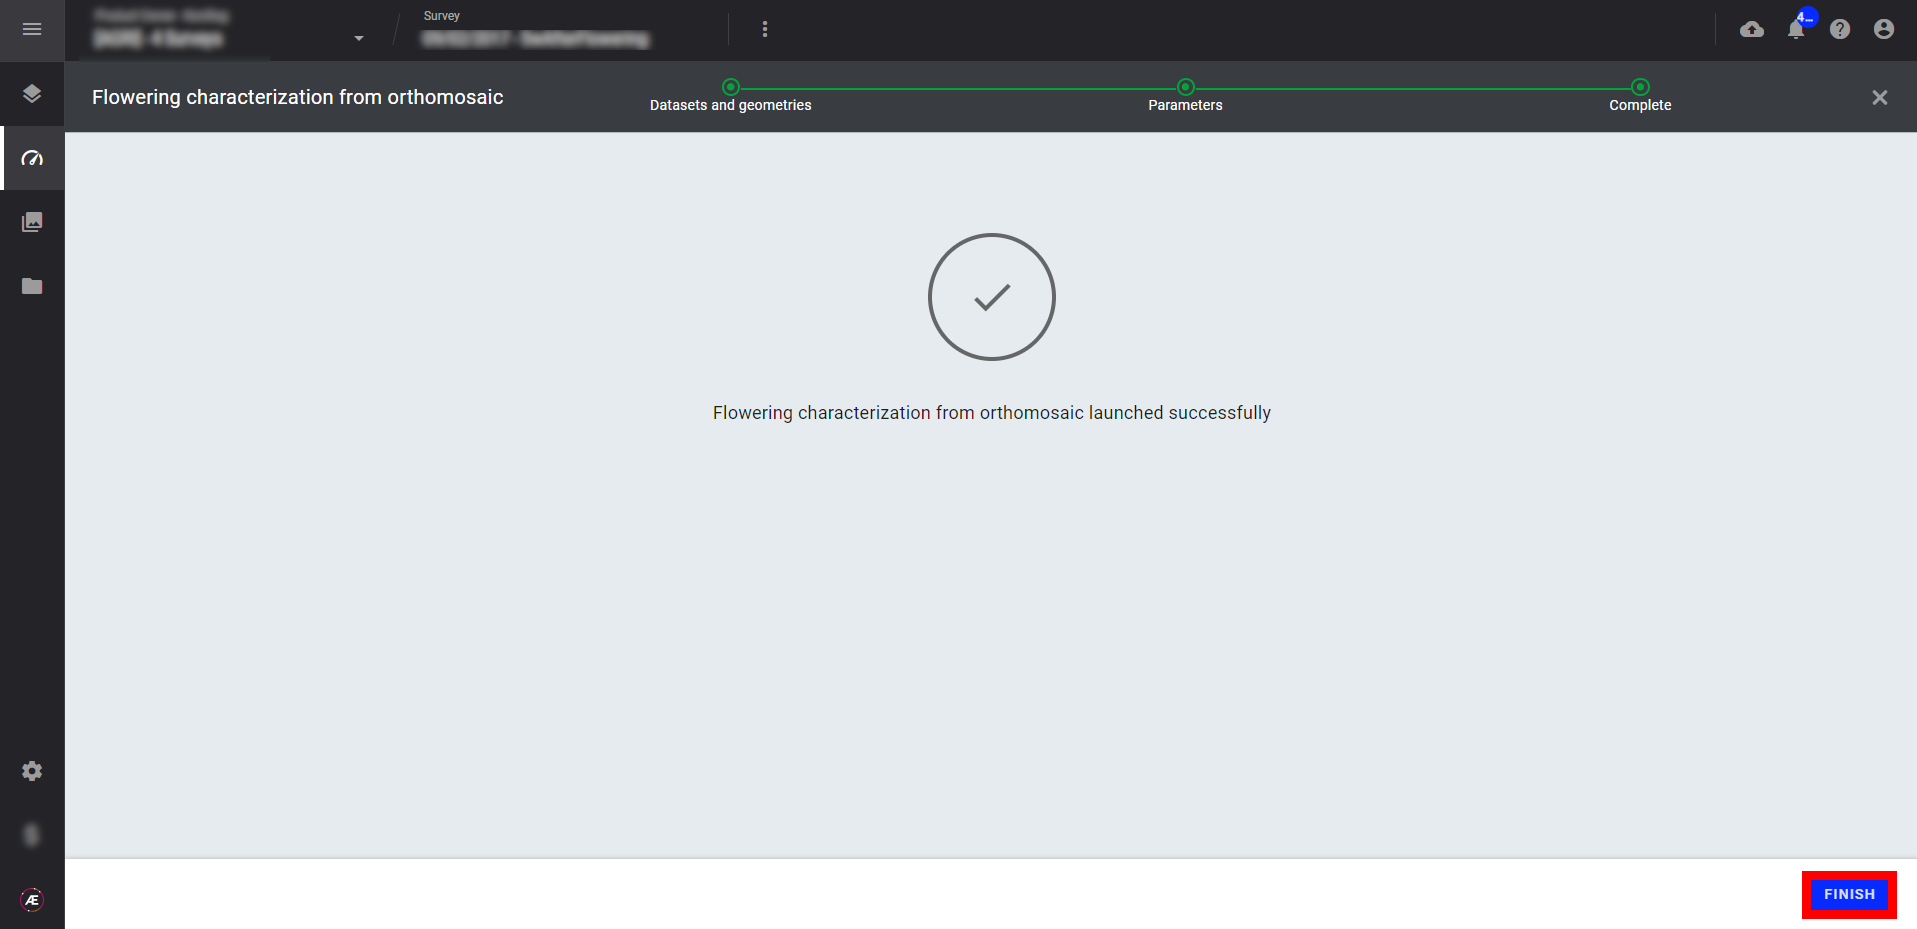
Step 5 - Click on "FINISH" to leave the analytics.
3.2 Flowering characterization from reflectance
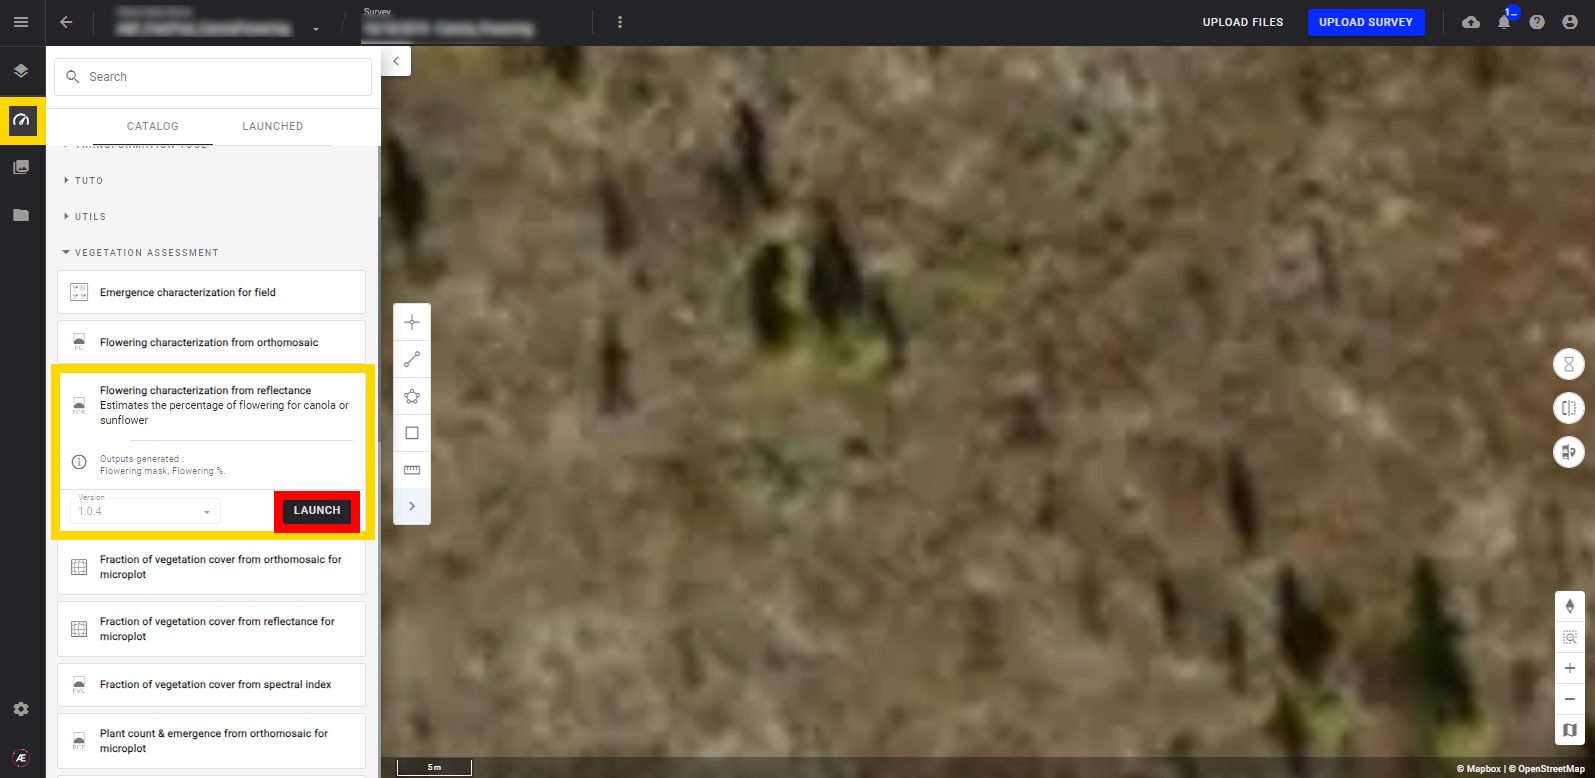
Step 1 - In the "Analytics" tab, search and select "Flowering characterization from reflectance" and click on "LAUNCH".
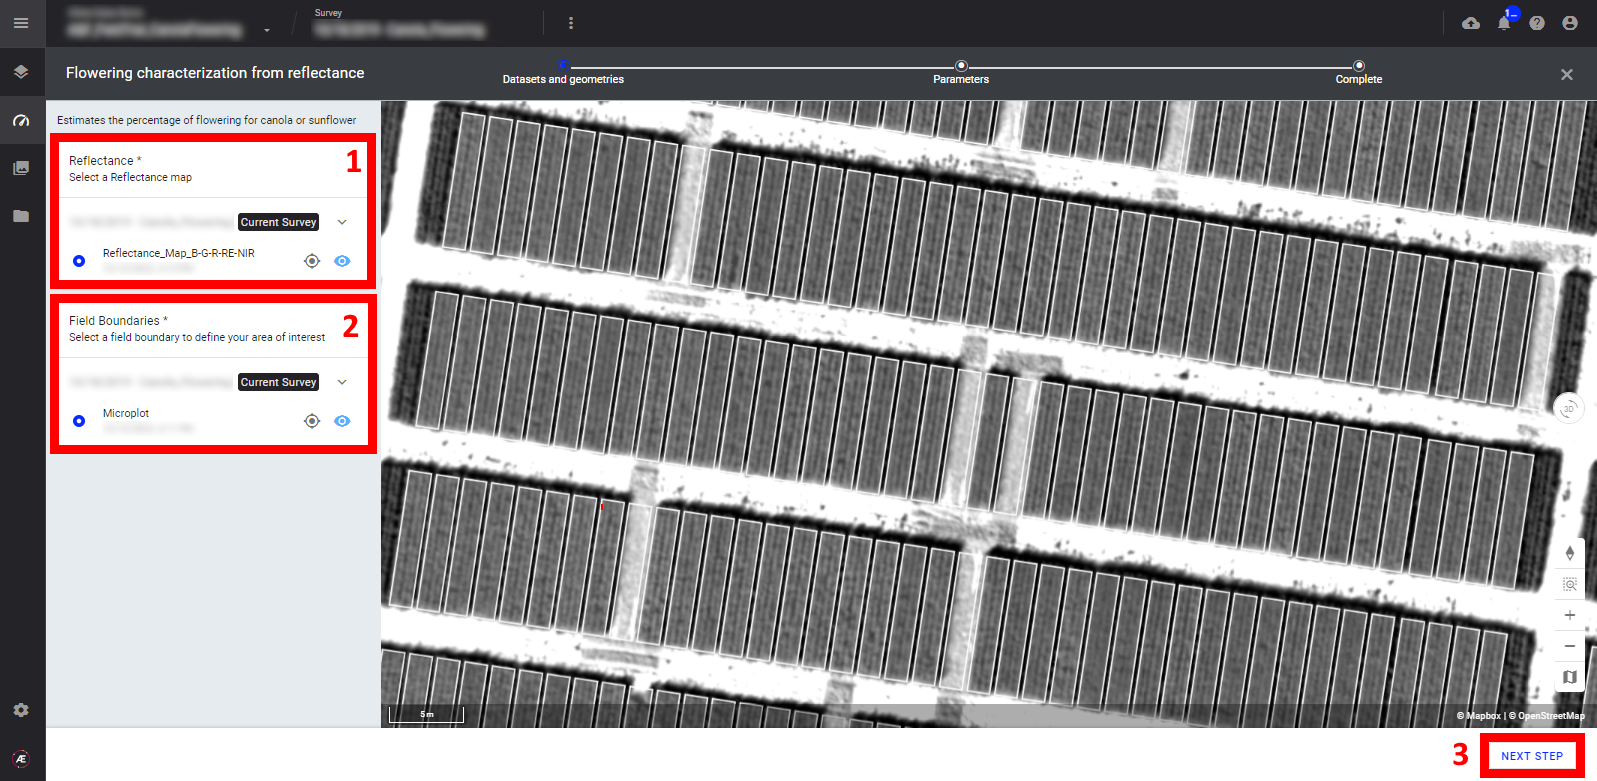
Step 2 - Select the "Reflectance" map (1) and the "Field Boundaries" (2) (field boundaries vector or microplot vector) and click on "NEXT STEP" (3).
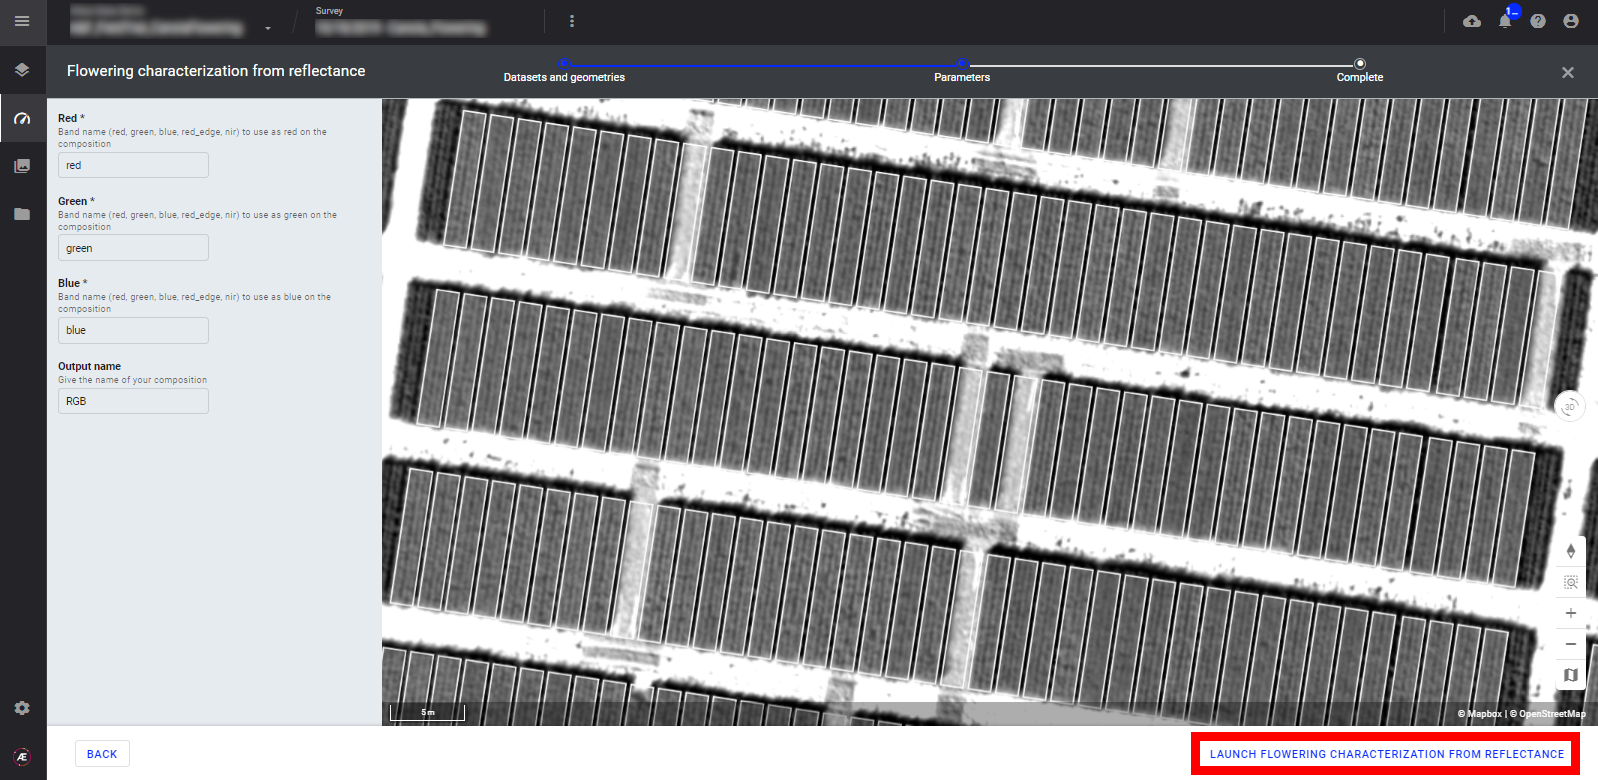
Step 3 - Define/check the band name of the reflectance map and define the name of the output.
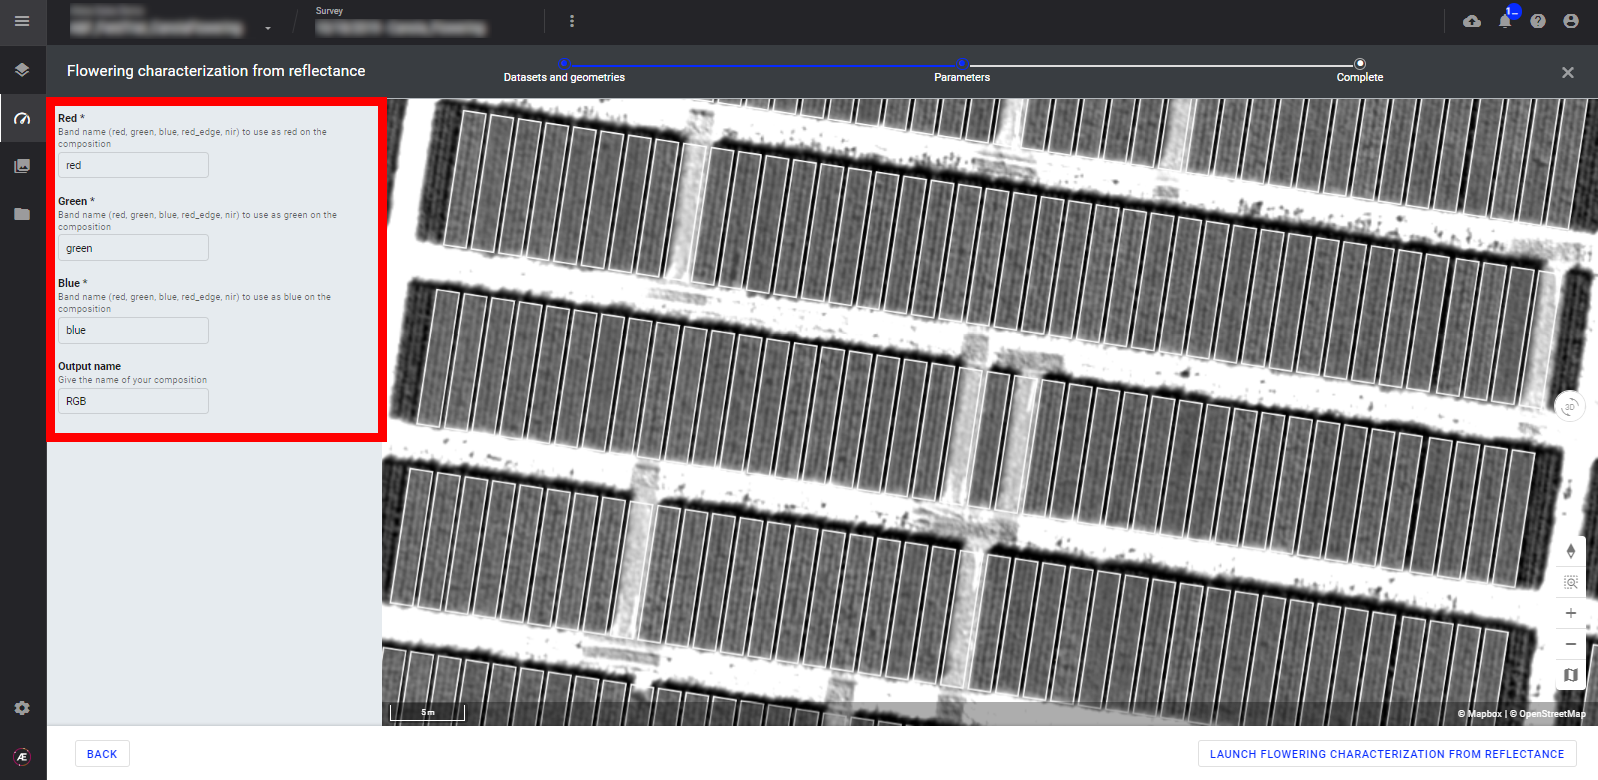
Step 4 - Click on "LAUNCH FLOWERING CHARACTERIZATION FROM REFLECTANCE".
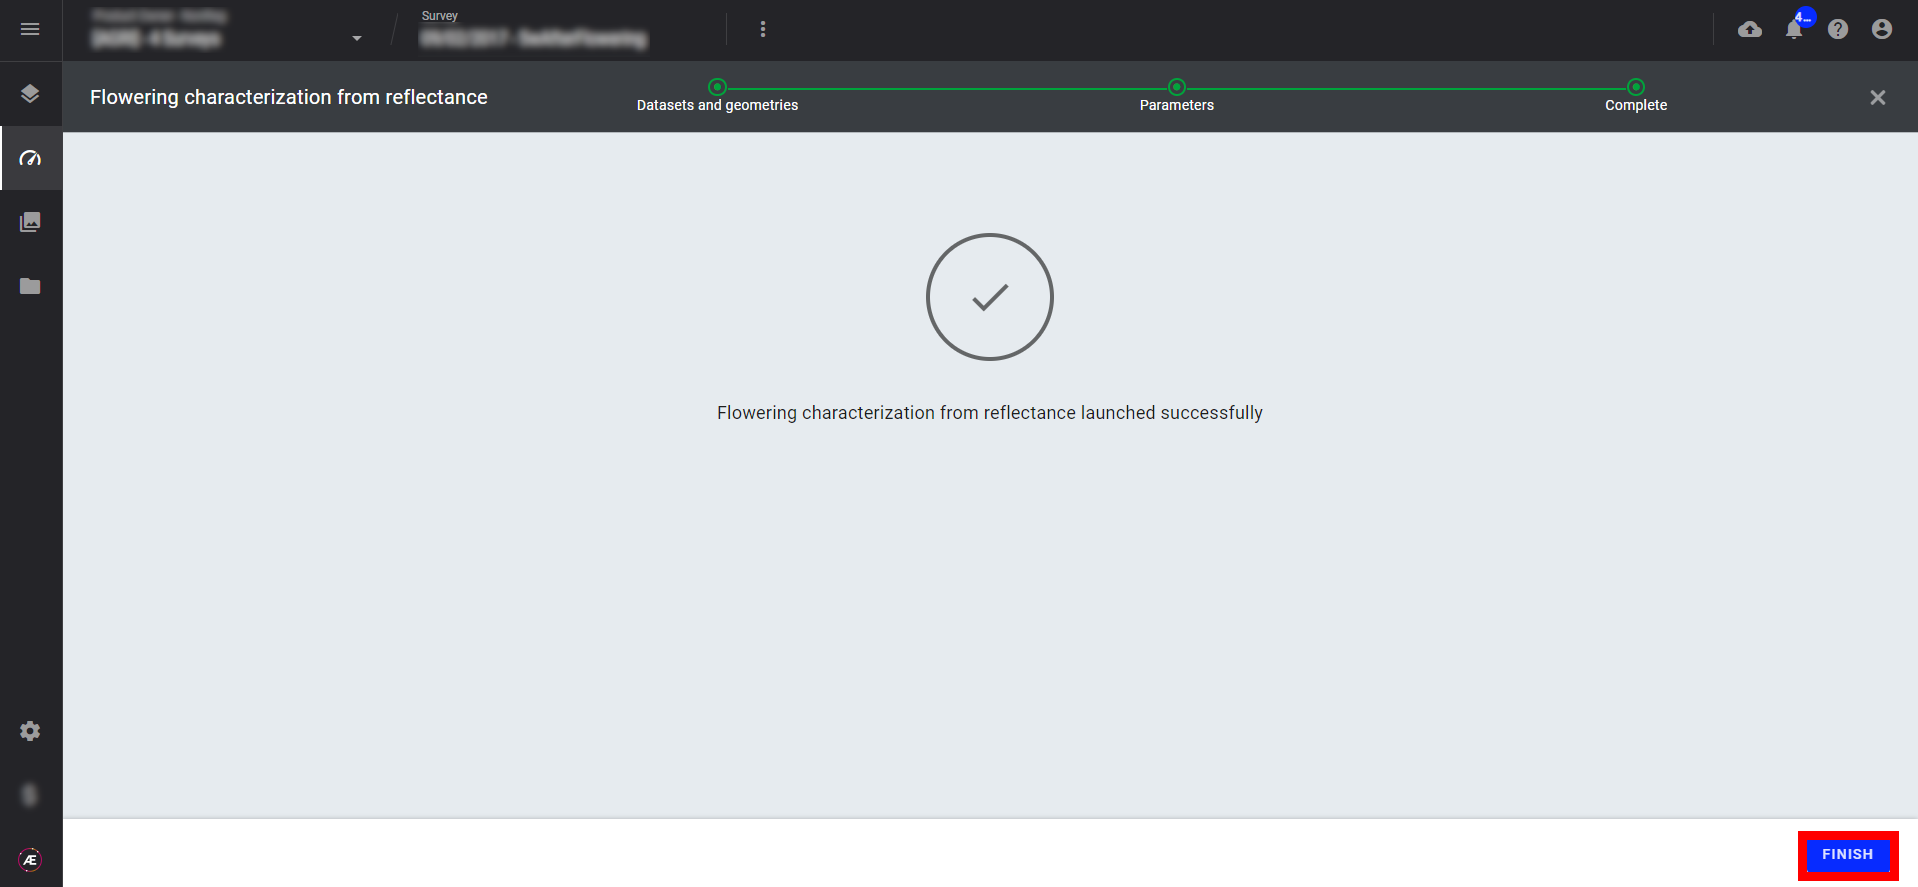
Step 5 - Click on "FINISH" to leave the analytics.
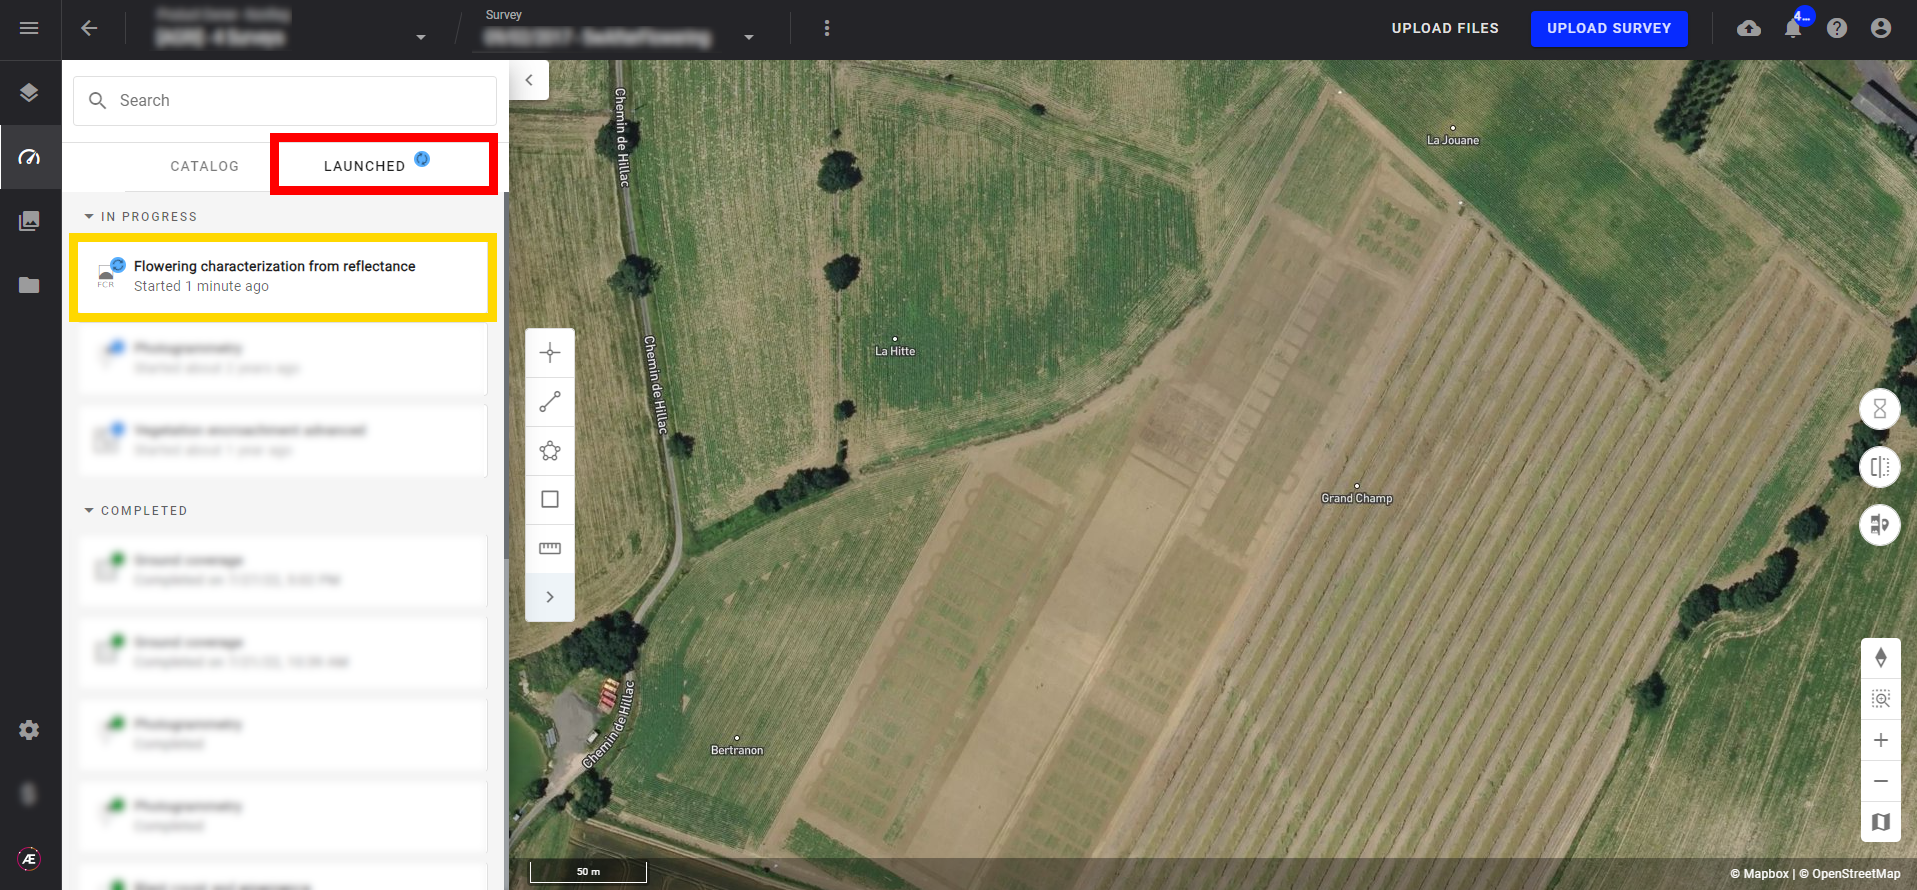
4. Status and Progression
Check in the "LAUNCHED" tab that the analytics is in progress
Aether will notify the user that the analytics results are available.
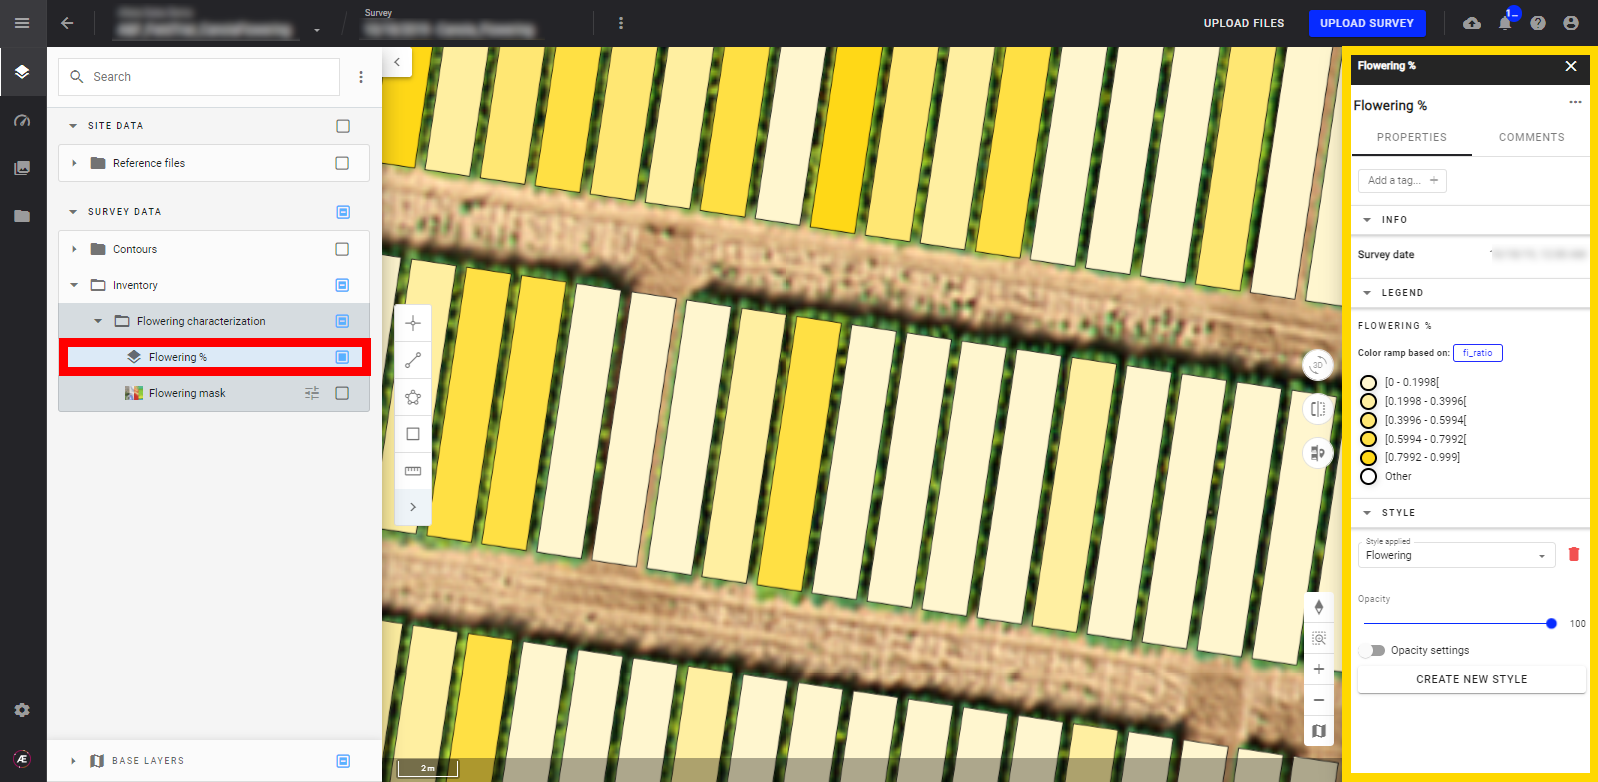
5. Results
In the "Inventory" subgroup of "SURVEY DATA" a new subgroup "Flowering Characterization" is created with 2 layers:
- Flowering mask

- Flowering %
6. Deliverables
6.1 Files
The analytics result files are located in the "Download" section.
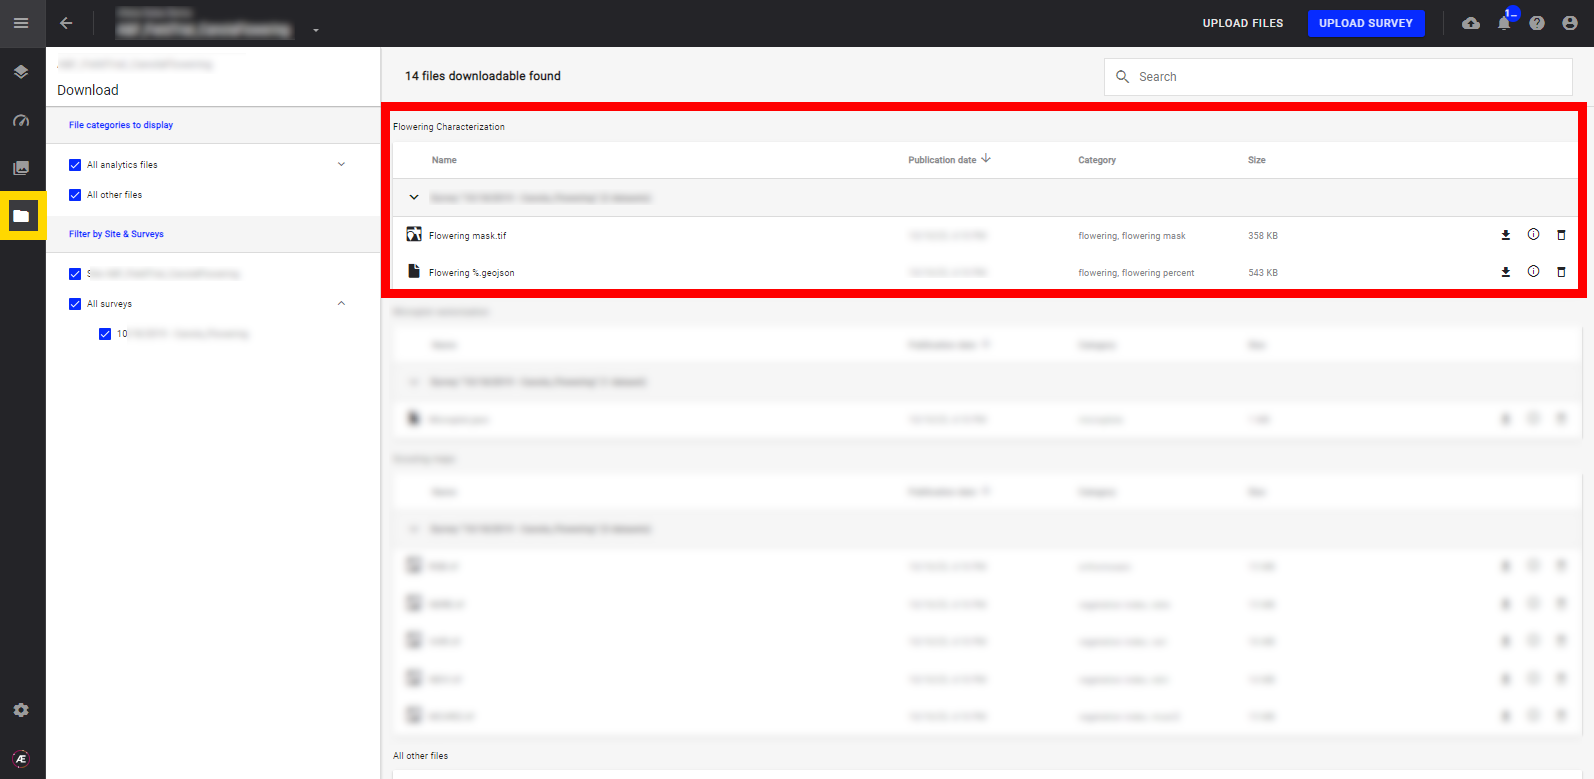
Flowering Characterization from orthomosaic:
- Flowering %.gejson
- Flowering mask.tif
Flowering Characterization from reflectance:
- Flowering %.gejson
- Flowering mask.tif
6.2 Attributes
Flowering % Geojson output for microplot:
- Attributes from the input vector file
- fi_ratio: Flowering ratio per microplot in %
Flowering % Geojson output for field:
- id: Id of the grid cell
- id_x: column number
- id_y: row number
- fi_ratio: Flowering ratio per tile in %
