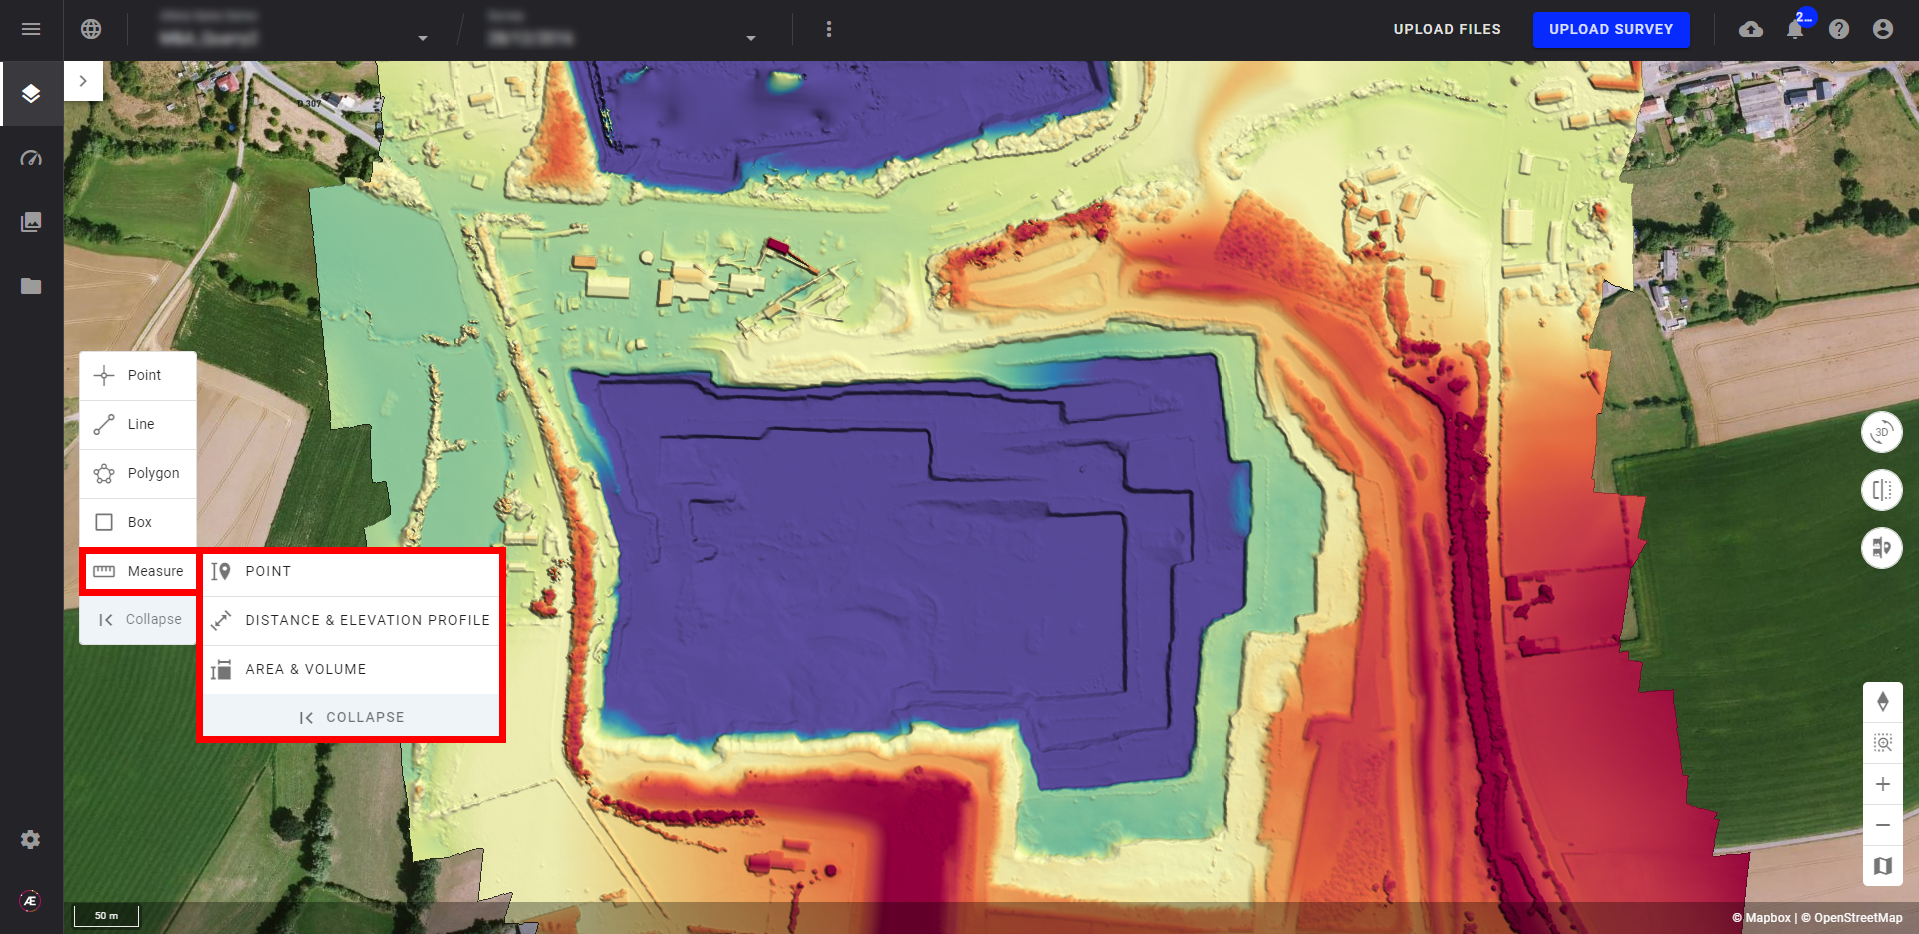
Measurement Tool
1. Description
The Measurement Tool is integrated into the Annotation Menu.
It's important to note that the Measurement Tools allow measuring directly on the raster or on the point cloud (3D) displayed without creating annotations saved as a layer (point, line, polygon, etc...)
To access the tool, click on the ruler logo at the bottom of the annotation tools menu.
2. Prerequisites
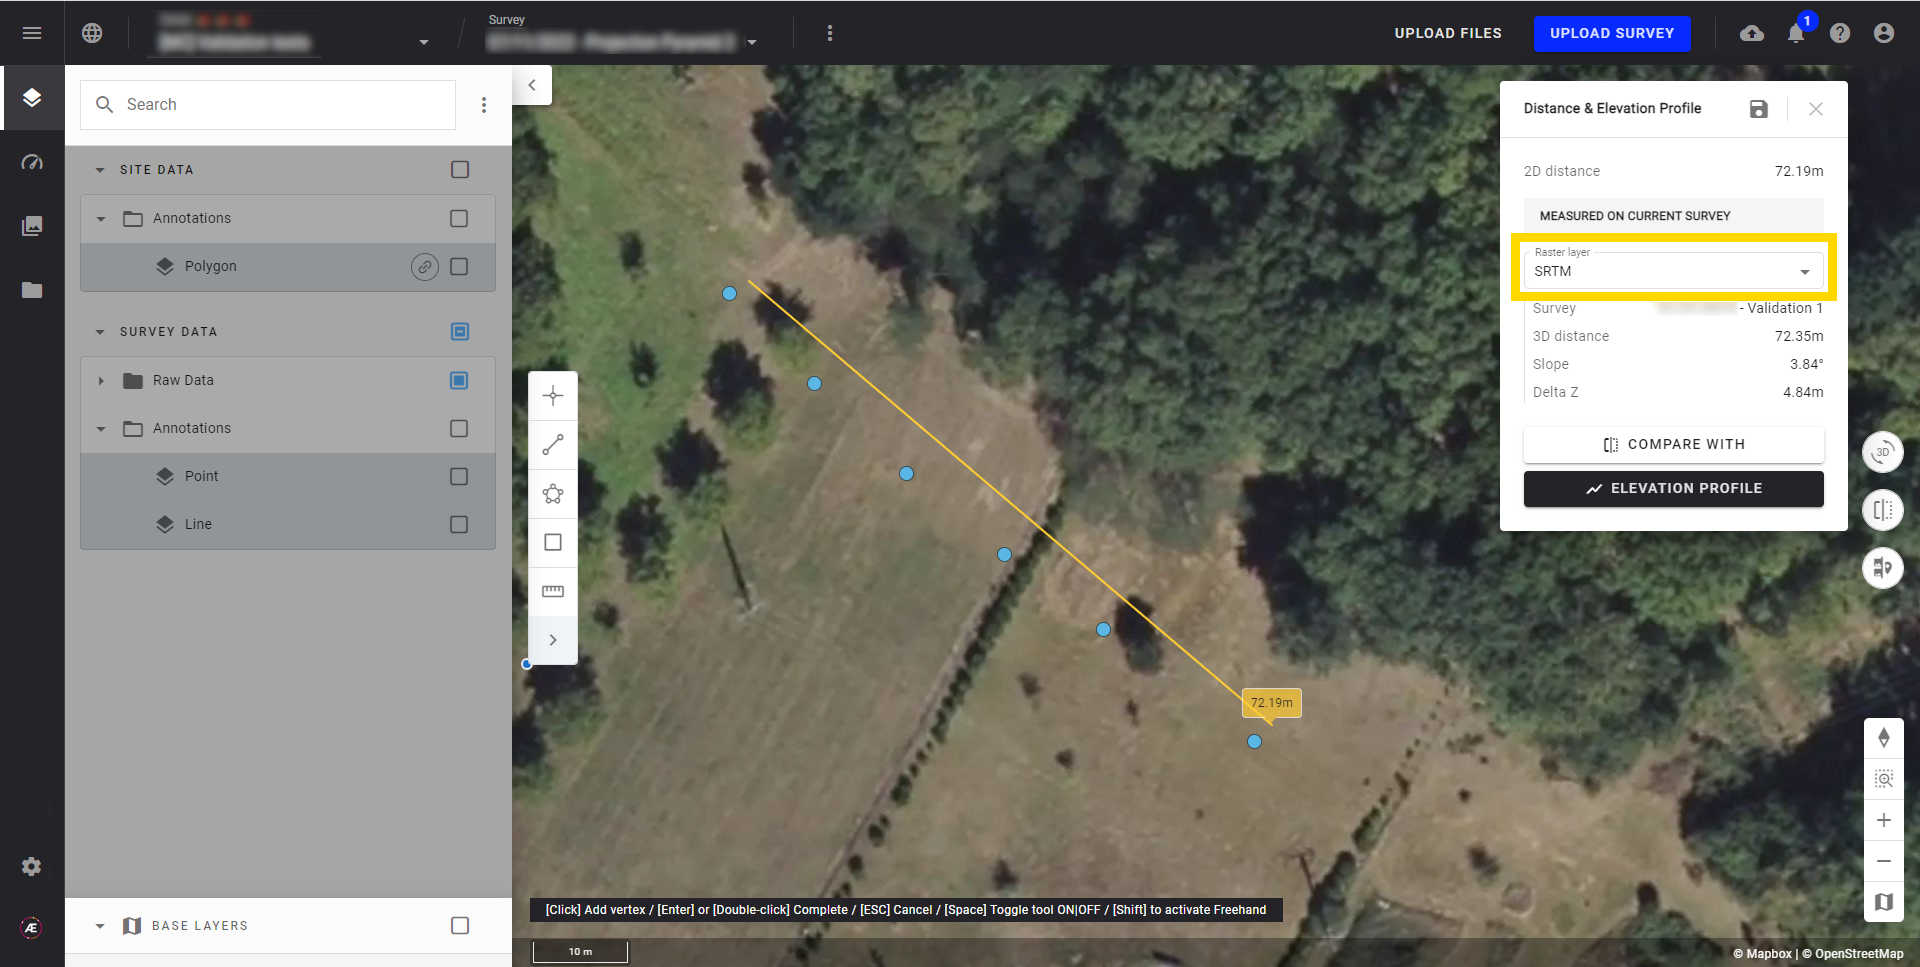
No requisite is mandatory, a DSM is nevertheless advised. If no DSM is available, Shuttle Radar Topography Mission (SRTM) will be selected by default.
Info
SRTM limitations
SRTM is a default option selected on the platform. Its display depends on the presence or not of a DSM layer on your survey.
- SRTM measurements are less precise than measurements on a DSM or DTM layer.
- The STRM resolution will depend on the area of interest.
- This option is currently not available for area, volume, and elevation profile measures.
- Currently, the STRM layer cannot be visualized on the map.
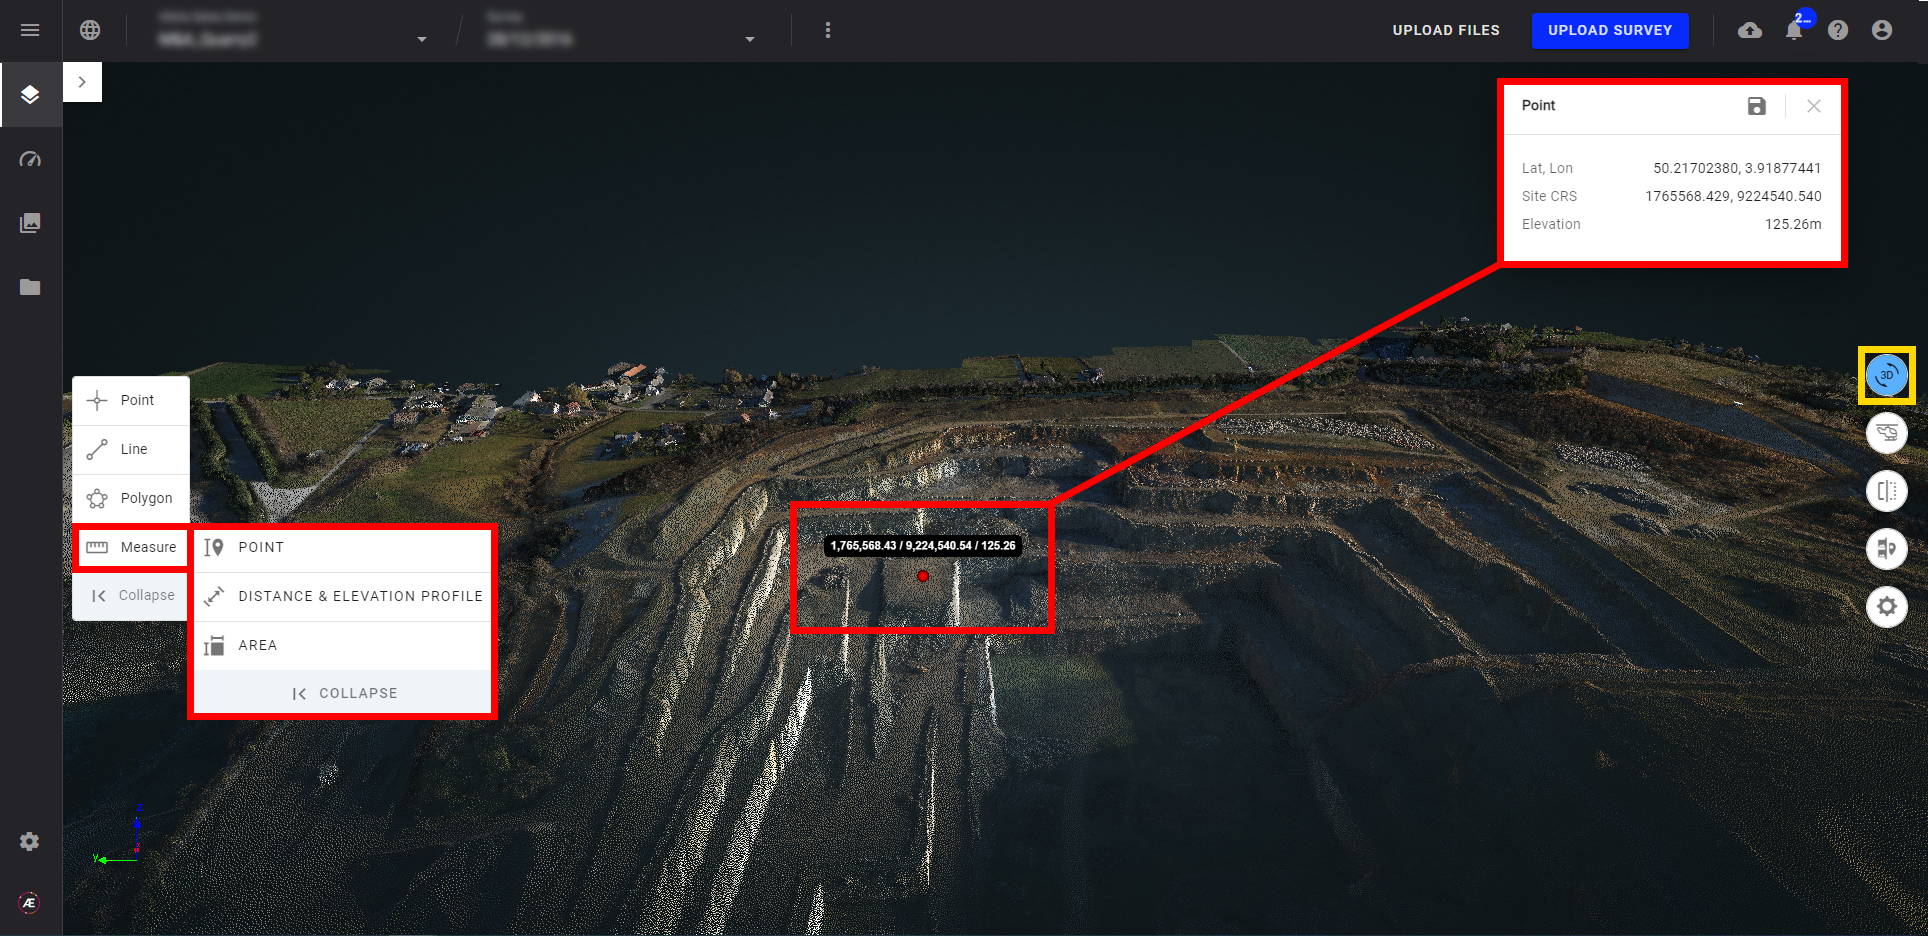
3. Point measurement
3.1 Create a point measurement
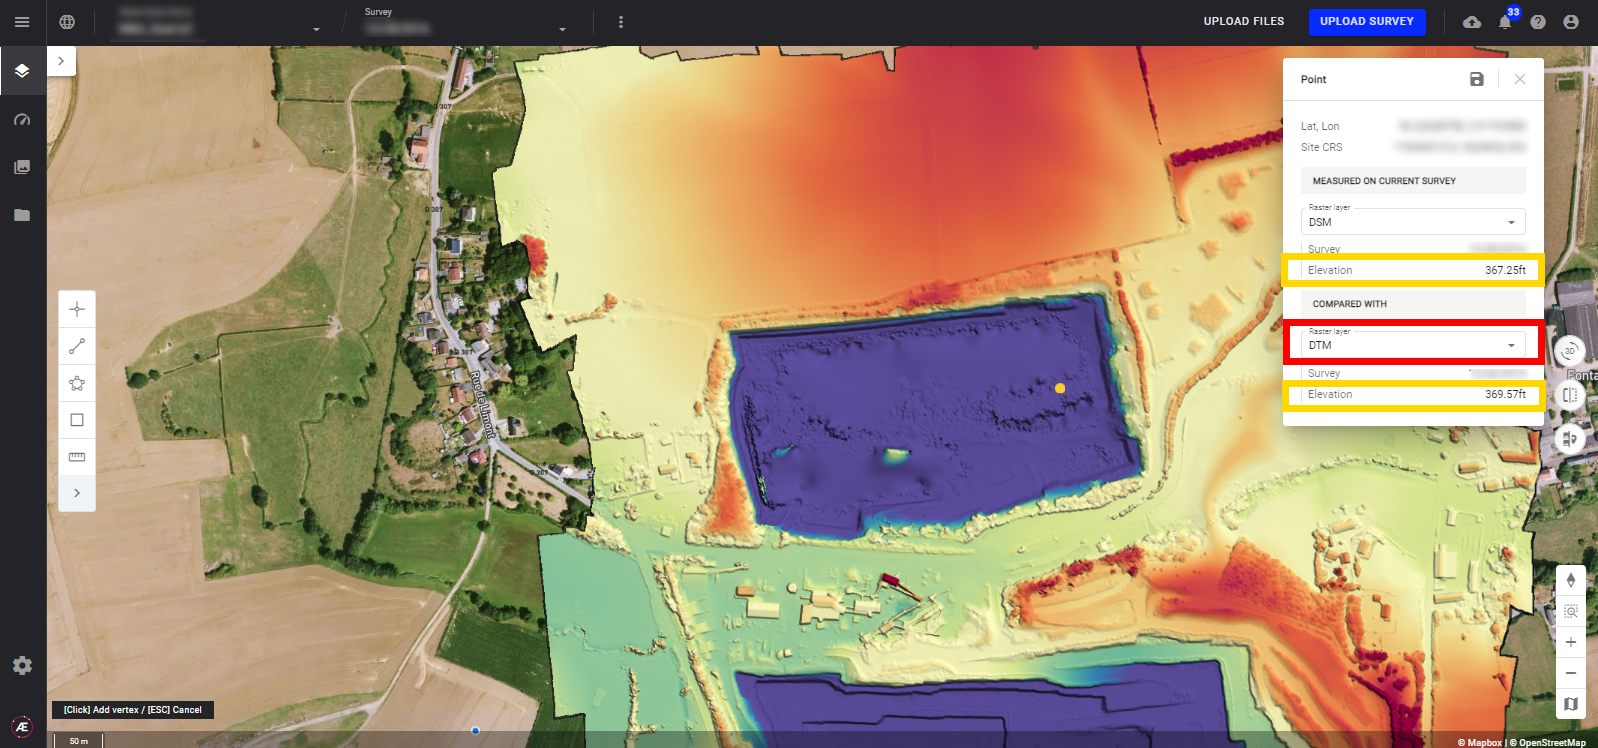
Step 1 - Select "POINT" on the Measure tool and click on a location to measure to create a point.
- The position of the point is displayed in WGS84 (Lat, Long) and in the Project CRS (Global Coordinates).
- The elevation of the point will be displayed If there is an elevation raster available on the Project (for example DSM) and in the current survey.
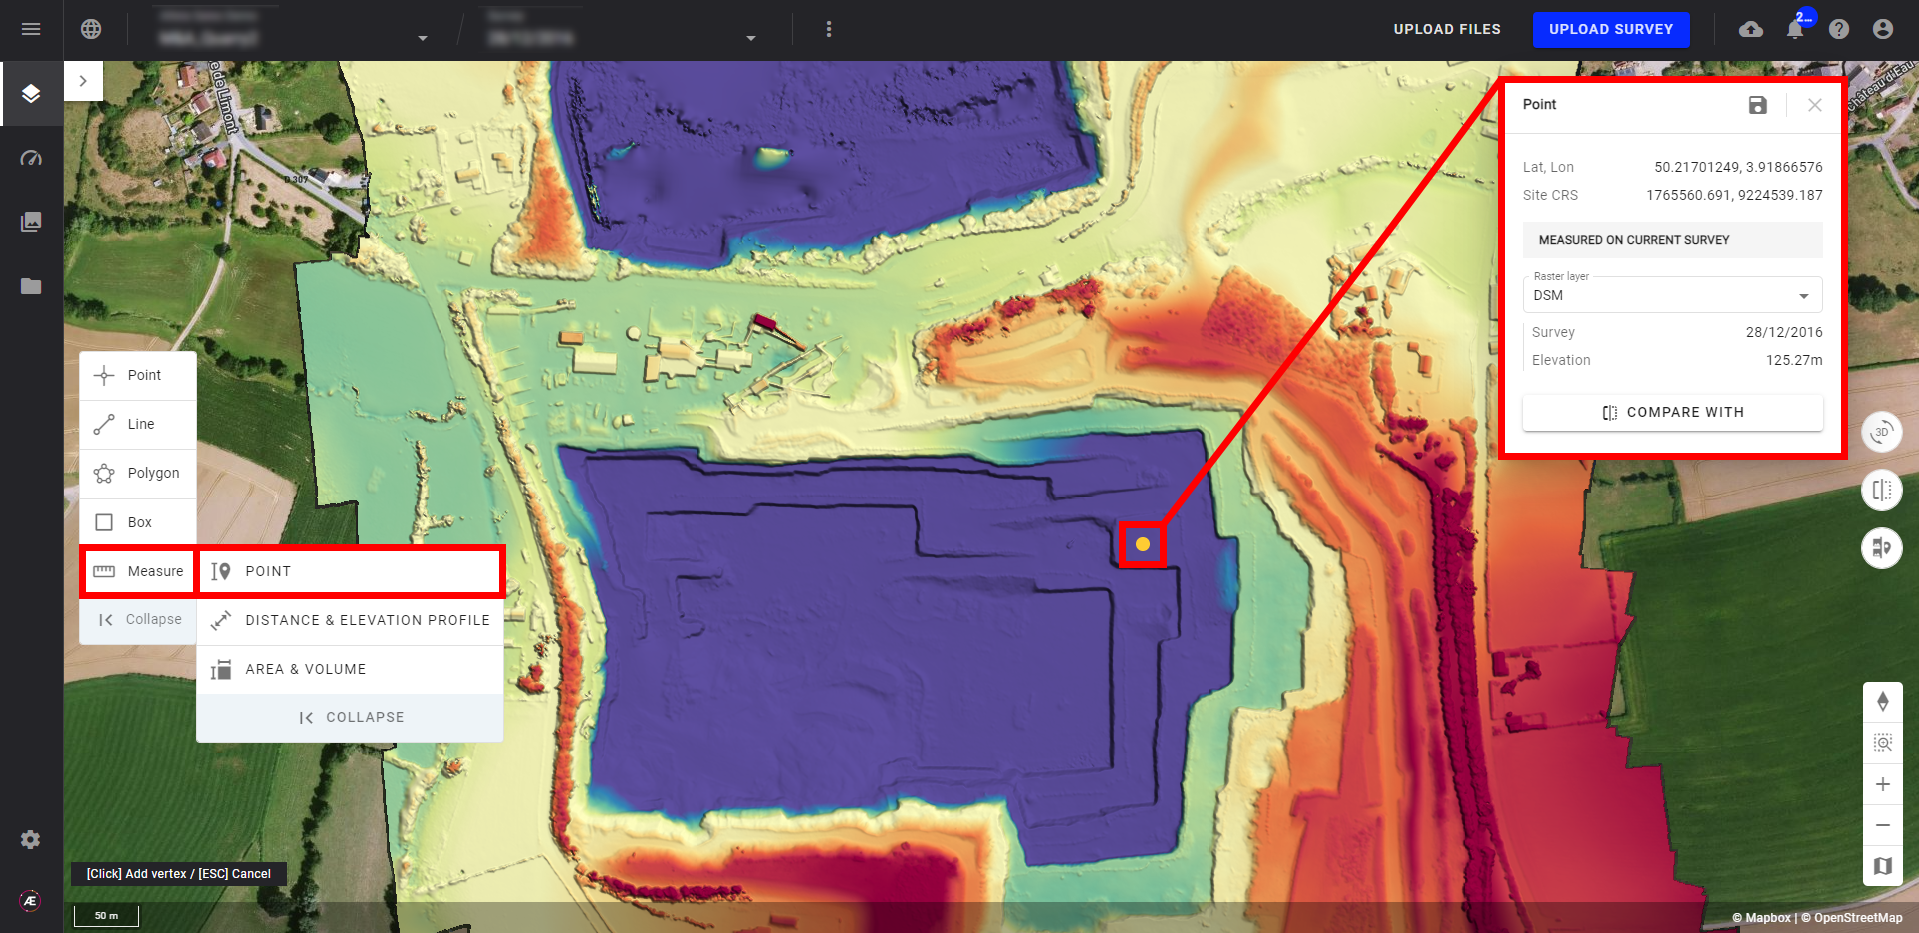
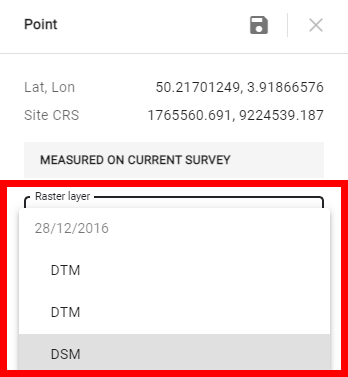
Step 2 - Select which raster the measurement is done by opening the dropdown menu.
Step 3 - Save this point as an annotation by clicking on the floppy disk icon.
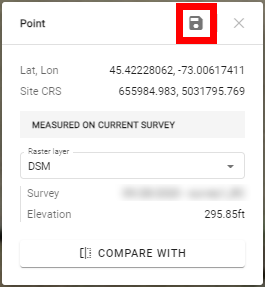
3.2 Compare a point measurement
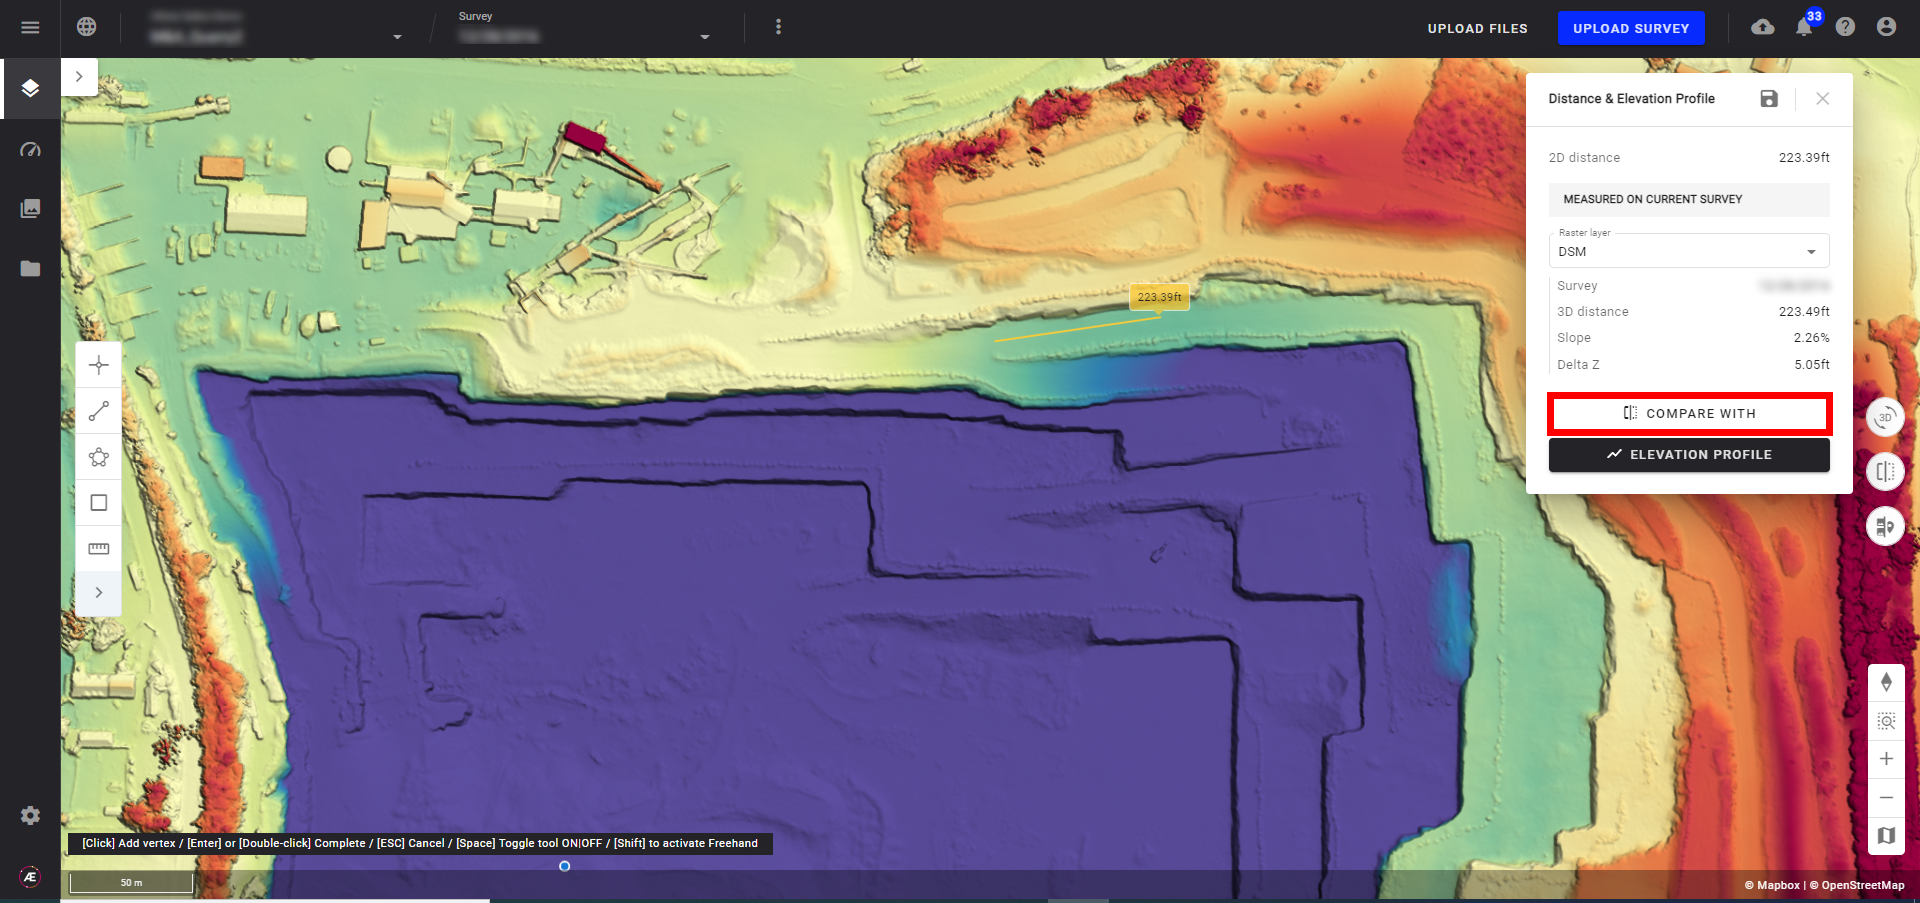
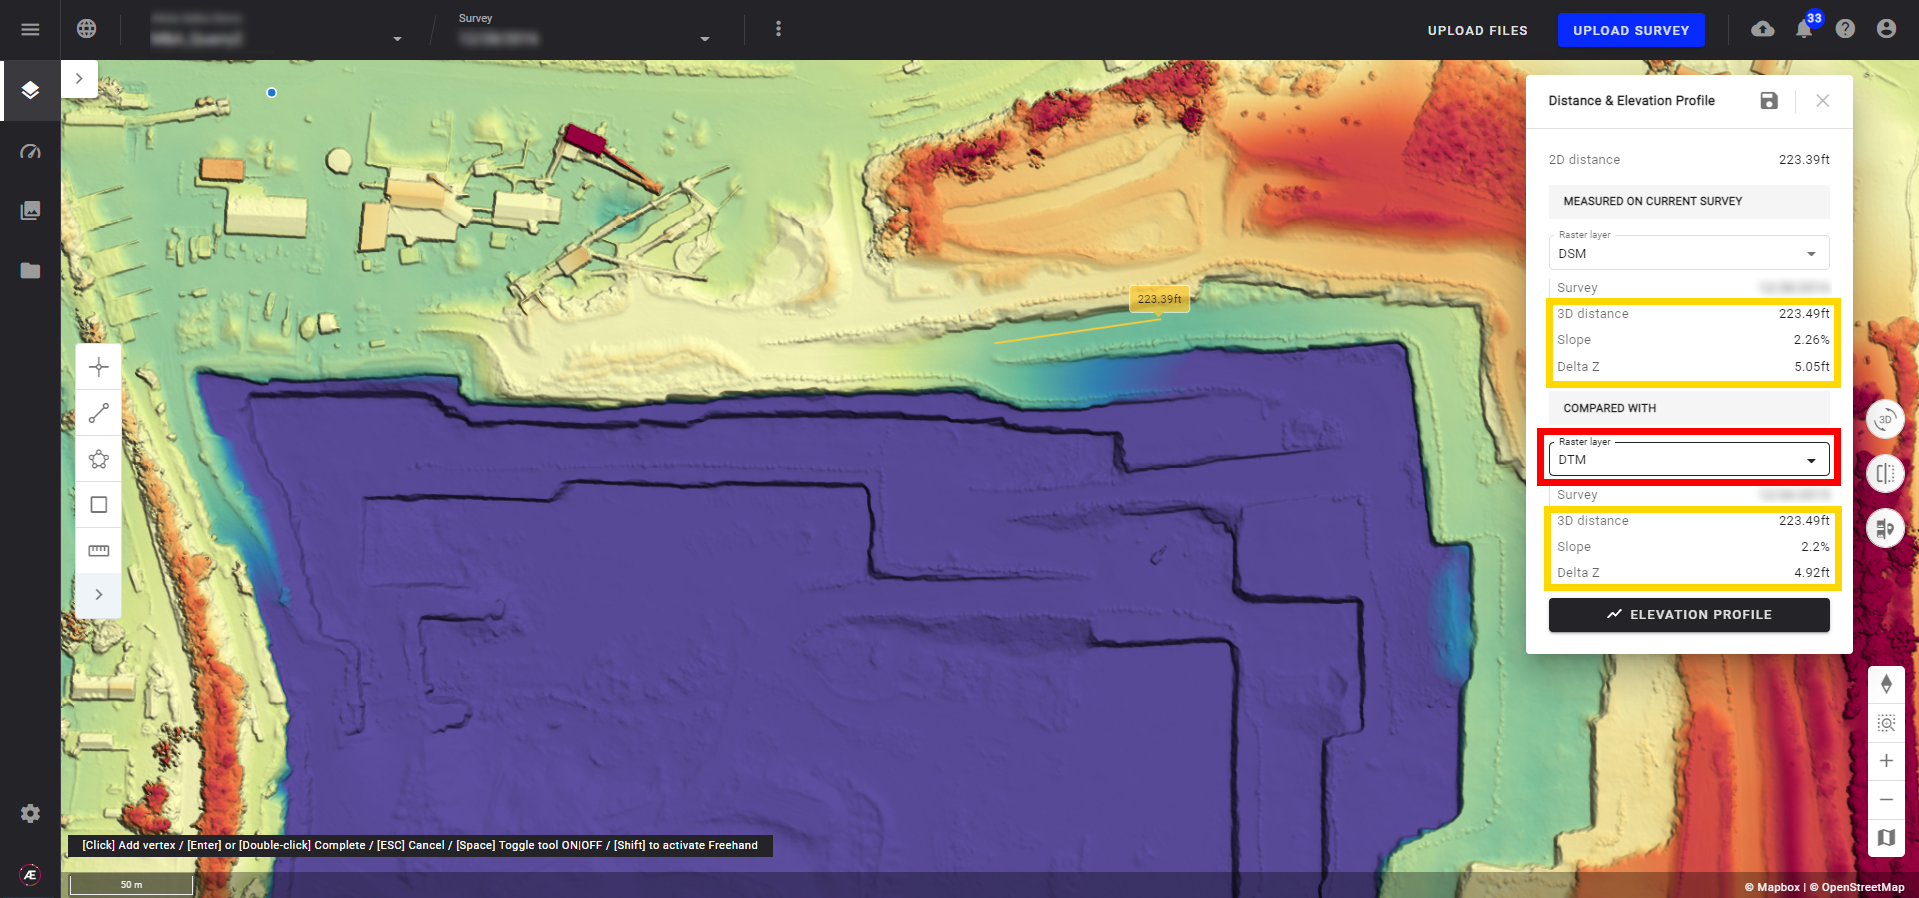
Step 1 - Click on "COMPARE WITH" to compare a measurement point between two rasters.
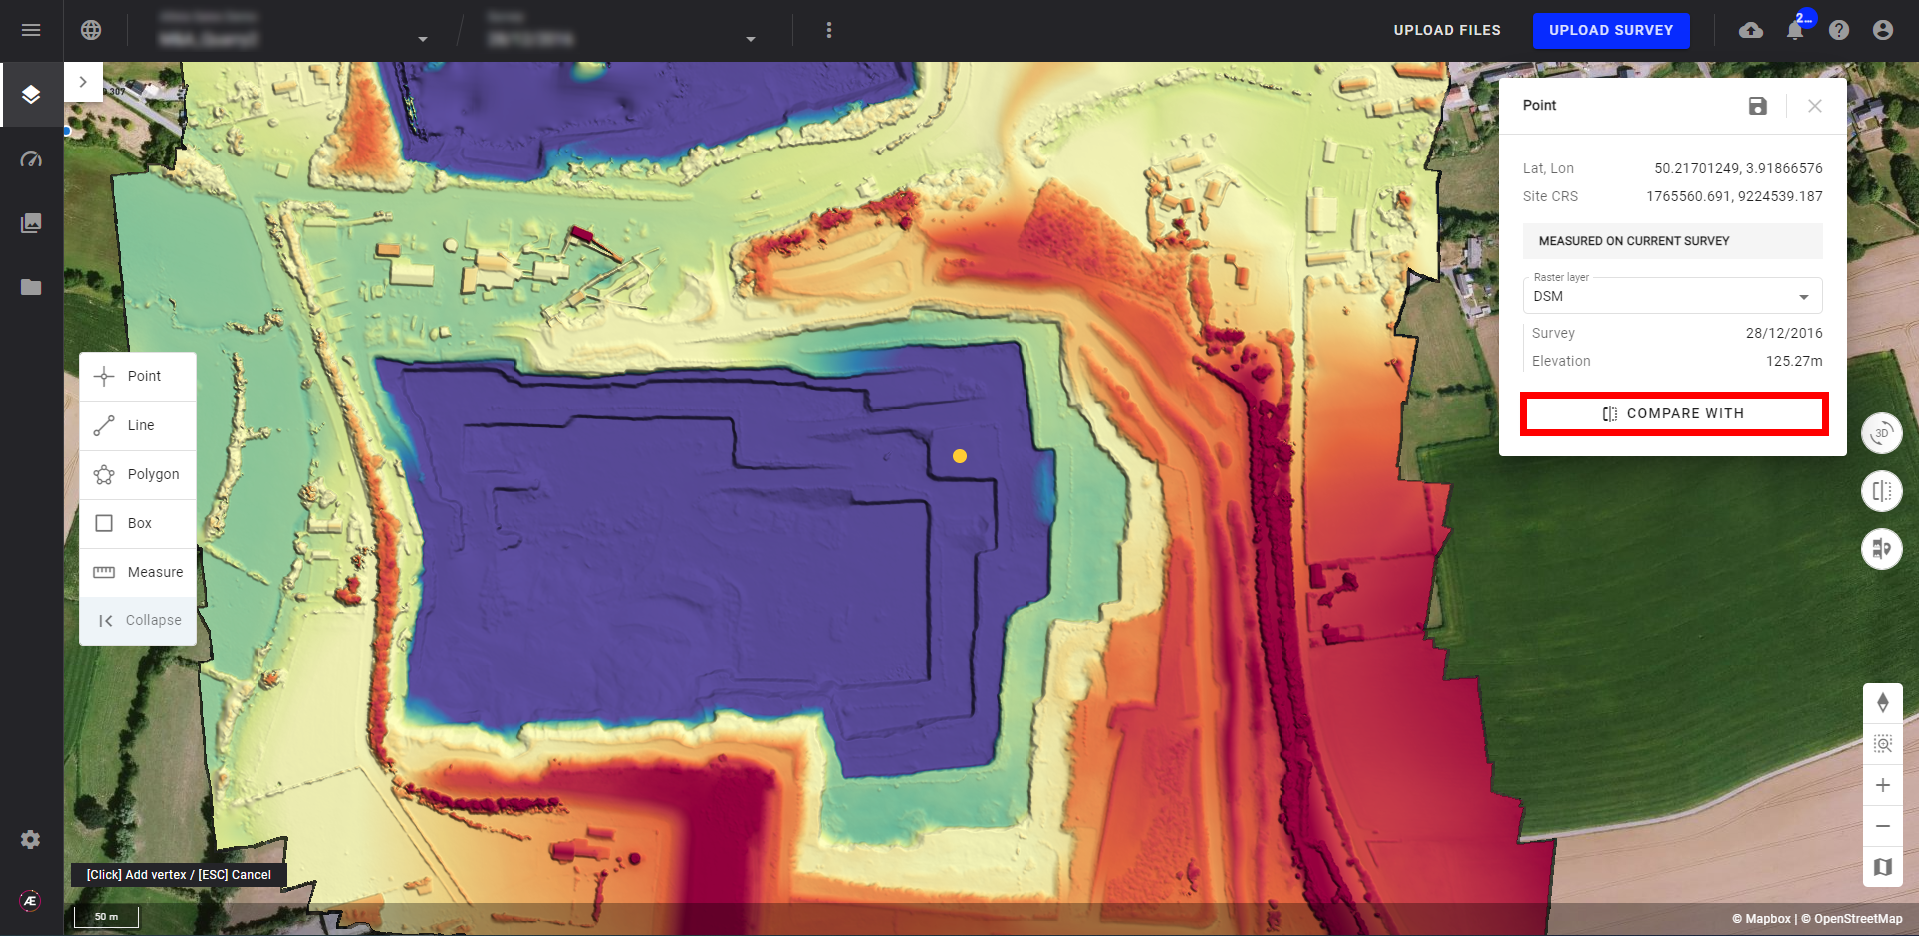
Step 2 - Select a different raster from the one in the current survey to compare the elevations.
4. Distance & Elevation profile
4.1 Create a line measurement
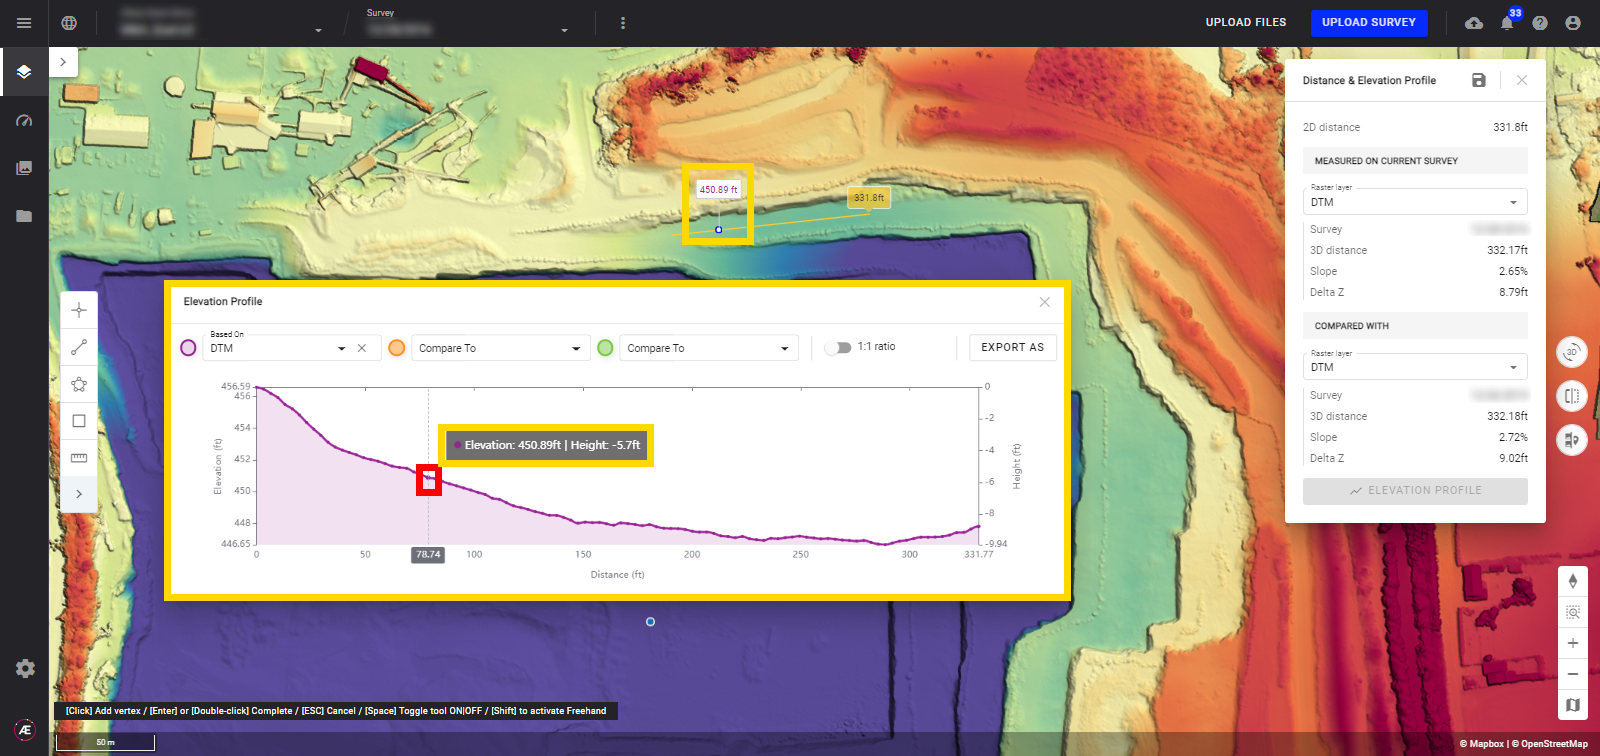
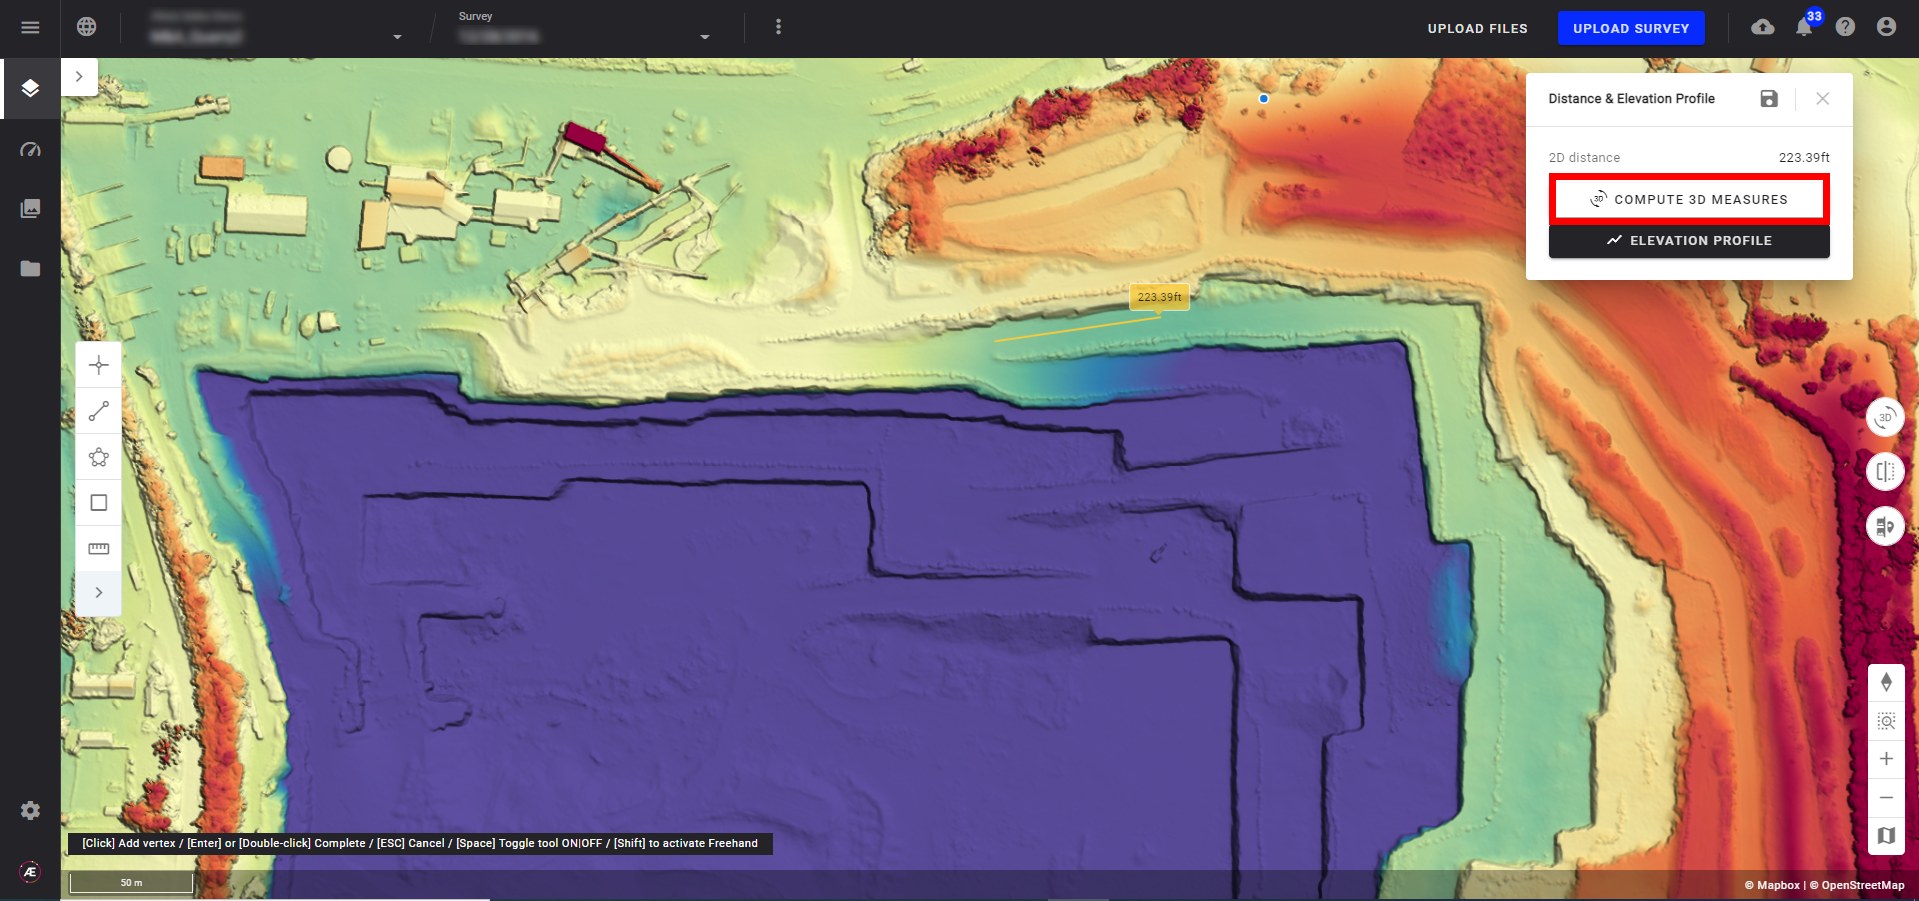
Step 1 - Select "DISTANCE & ELEVATIONS" on the Measure tool and draw a line with a location to measure. The distance is also measured (projected distance to a flat plane).
Info
Draw a polyline with the left click. Click again on the last point to finalize the line.
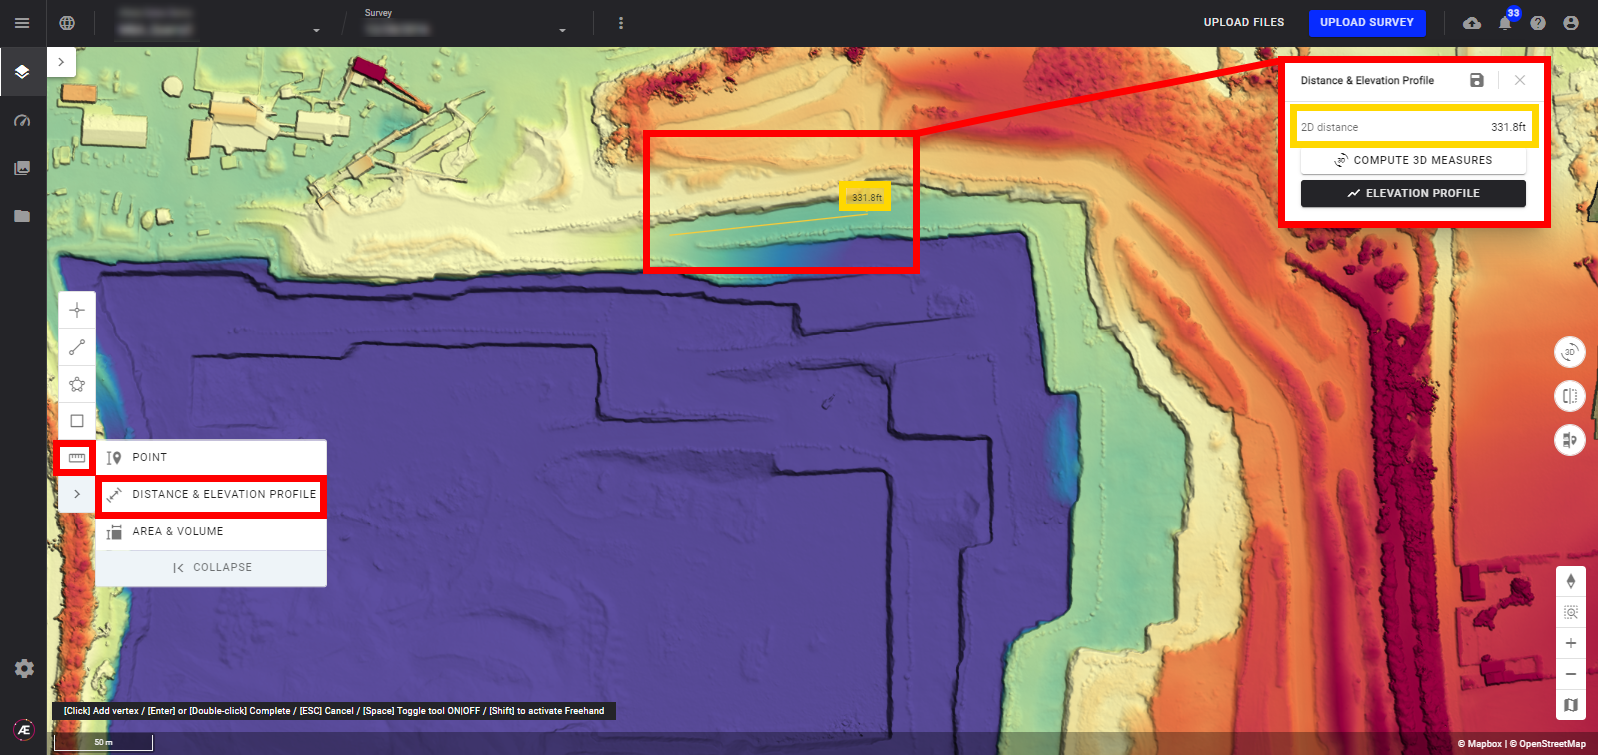
Step 2 - Click on "ELEVATION PROFILE", a pop-up window will appear that displays the elevation profile.
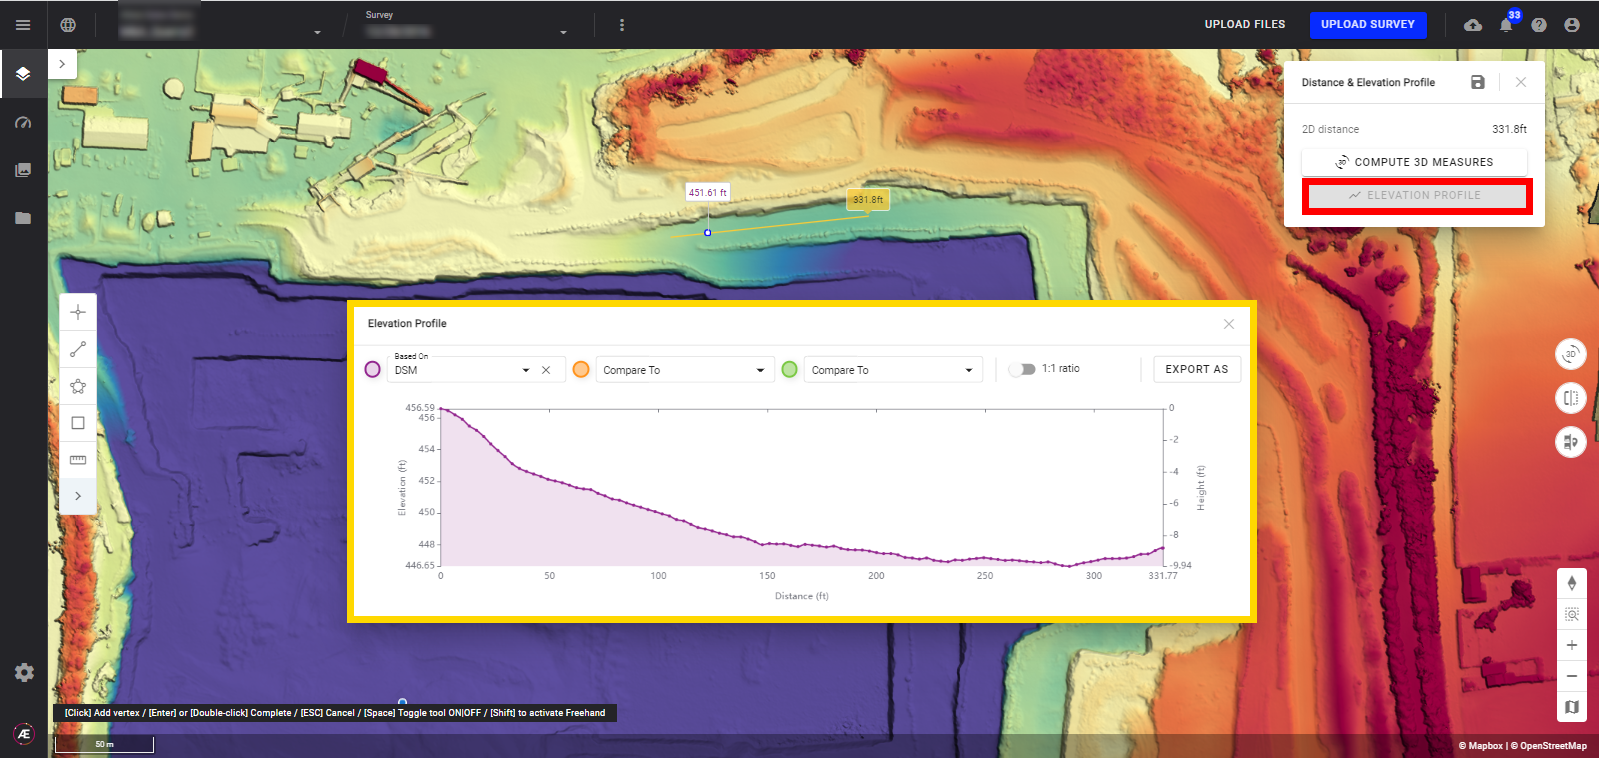
Step 3 - Save this line as an annotation by clicking on the floppy disk icon.
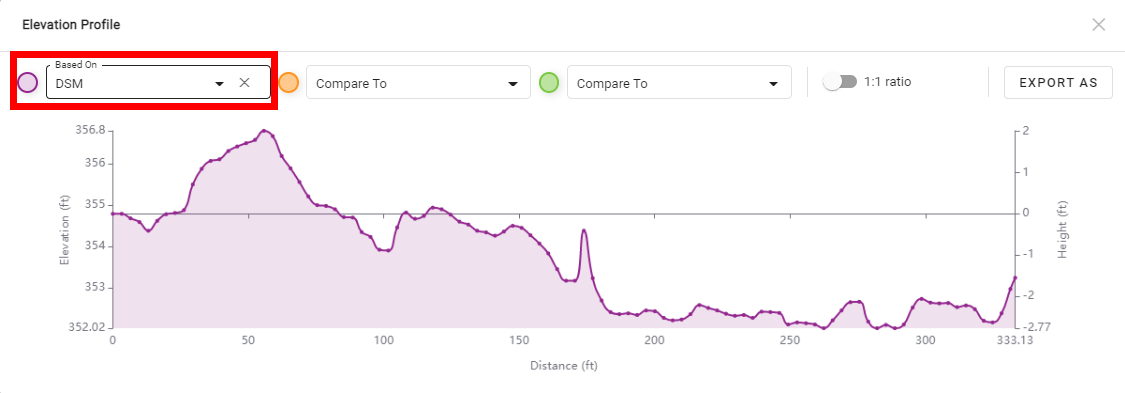
4.2 Elevation profile options
In the Elevation profile window, there are a few options:
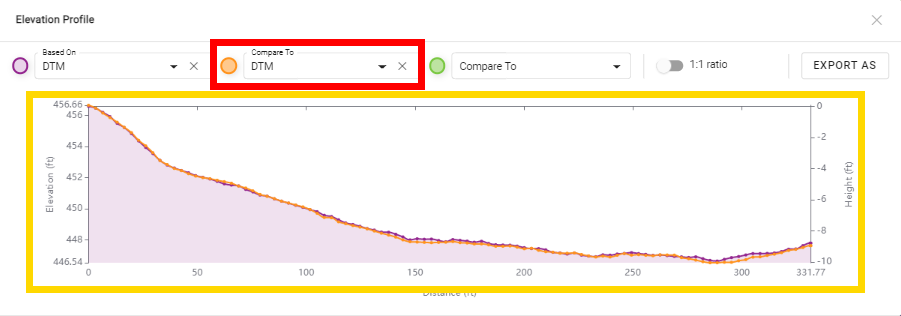
- Compare To: with the drag-down menu, select another raster to obtain another elevation profile for comparison. The second curve is displayed with different colors.
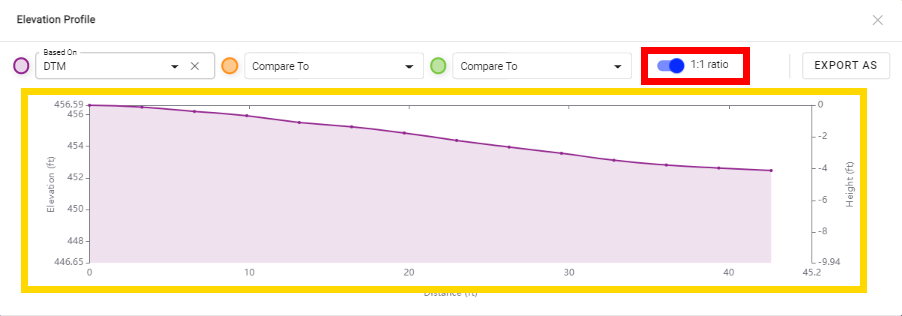
- 1:1 ratio: change the ratio of the curves.
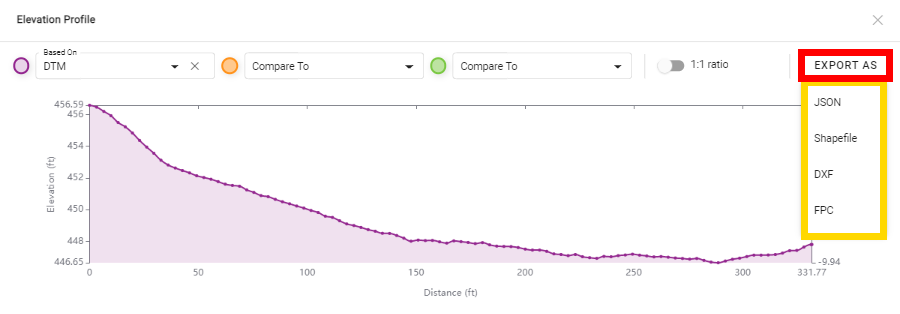
- EXPORT AS: different formats are available: JSON, Shapefile, DXF, and FPC.
- Move the mouse along the curves to read the values. The point is highlighted on the line in the map view.
- Choose which raster to calculate the measurement.
4.3 Compare a line measurement
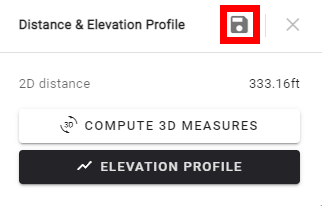
Step 1 - Draw a line (see Paragraph 4.1) and click on "COMPUTE 3D MEASURES" to deploy the menu and get access to "COMPARE WITH".
Info
If there isn't any DSM available, the SRTM option will be selected.
Step 2 - Click on "COMPARE WITH" to compare a measurement line between two rasters of different surveys.
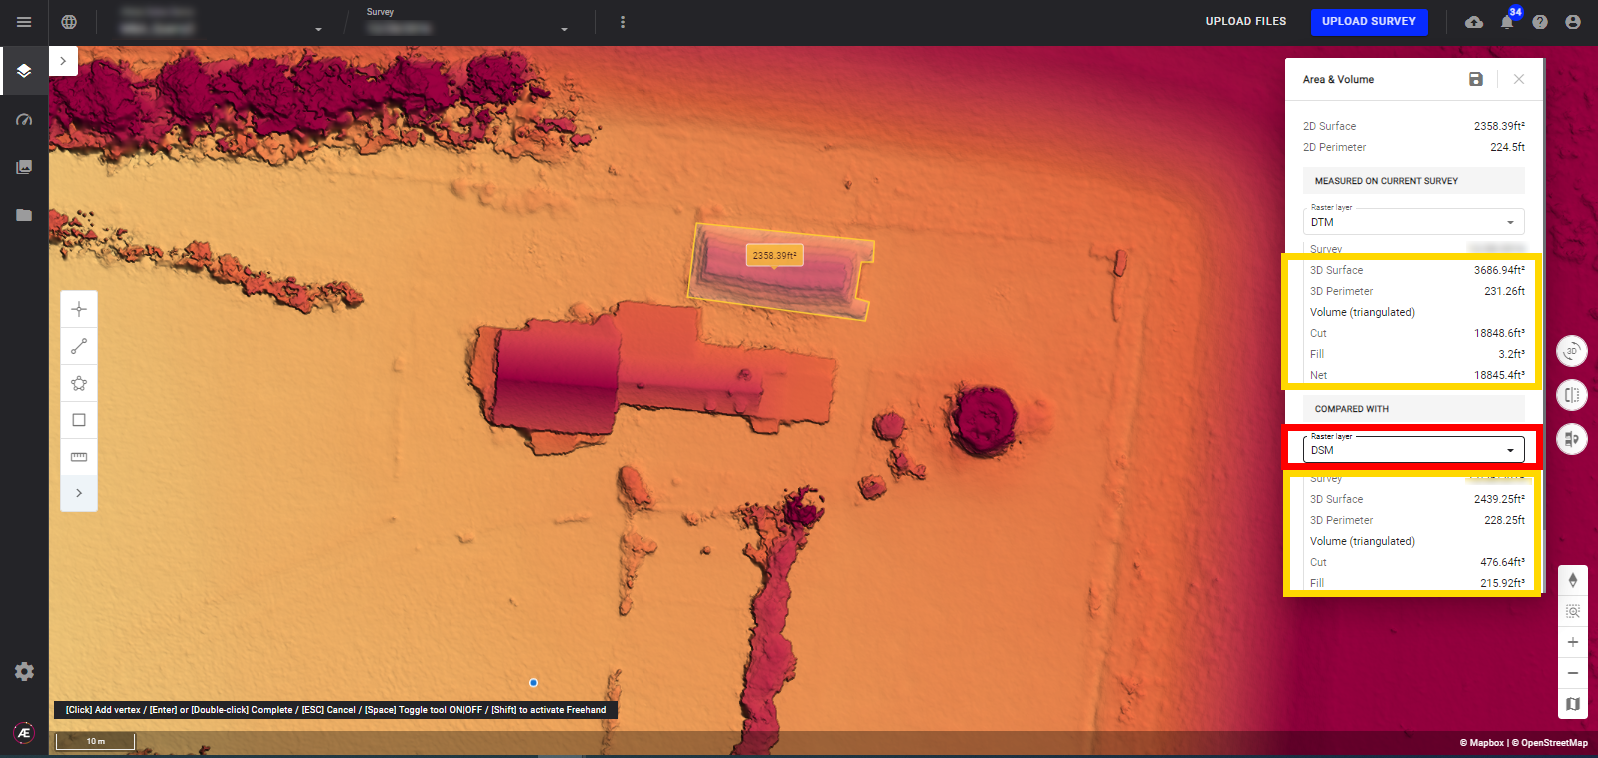
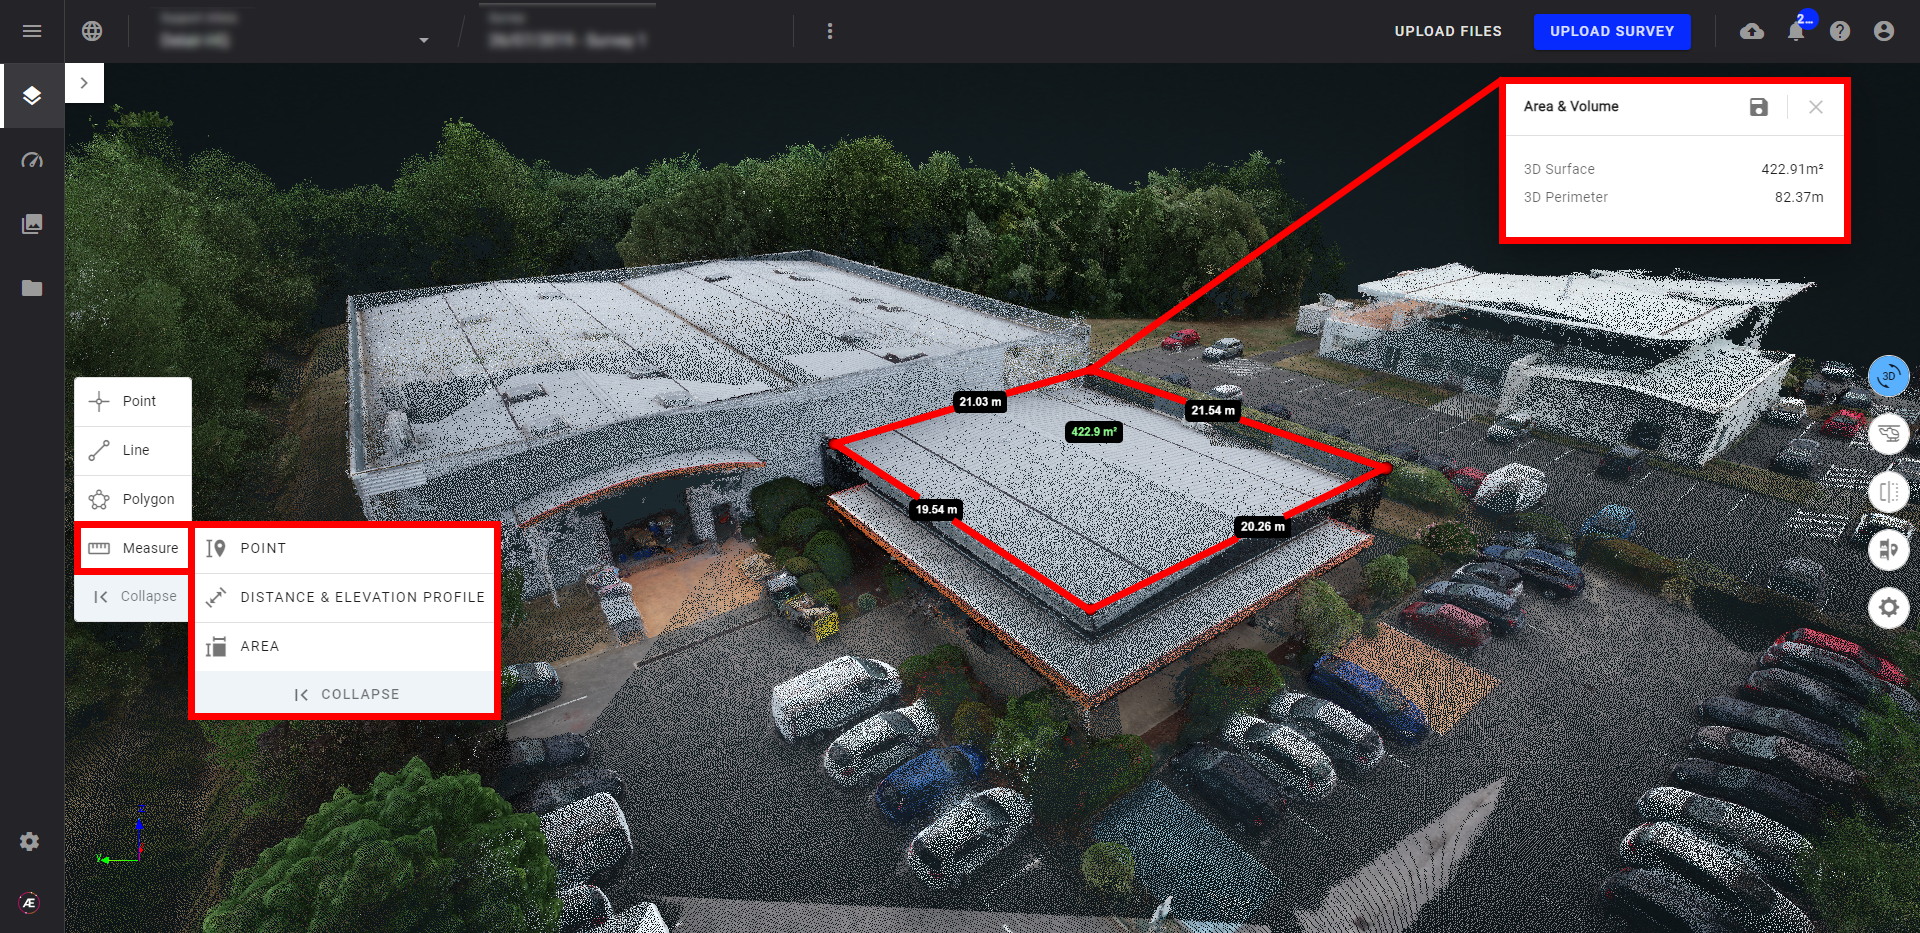
5. Area & Volume
5.1 Create a polygon measurement
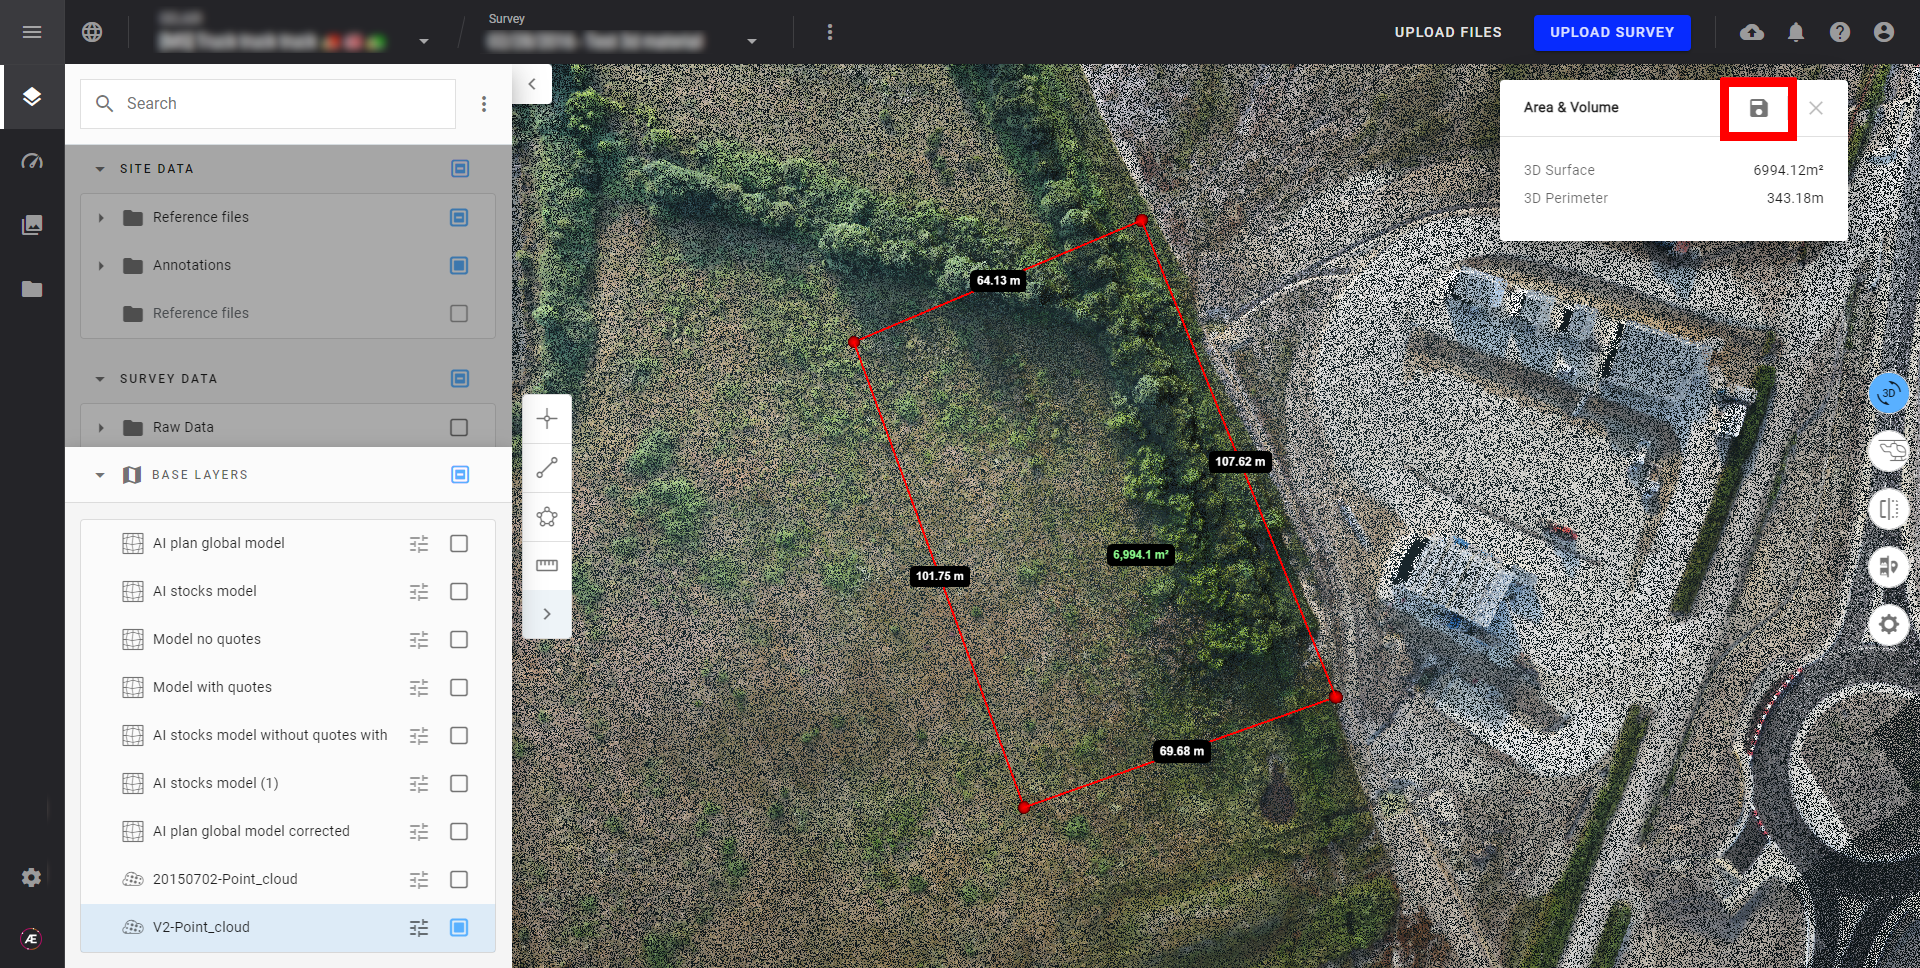
Select "AREA & VOLUME" on the Measure tool and draw a polygon on the zone to measure to obtain a 2D surface and perimeter measurement.
Info
Draw a polygon with the left click. Click again on the last point to end the polygon.
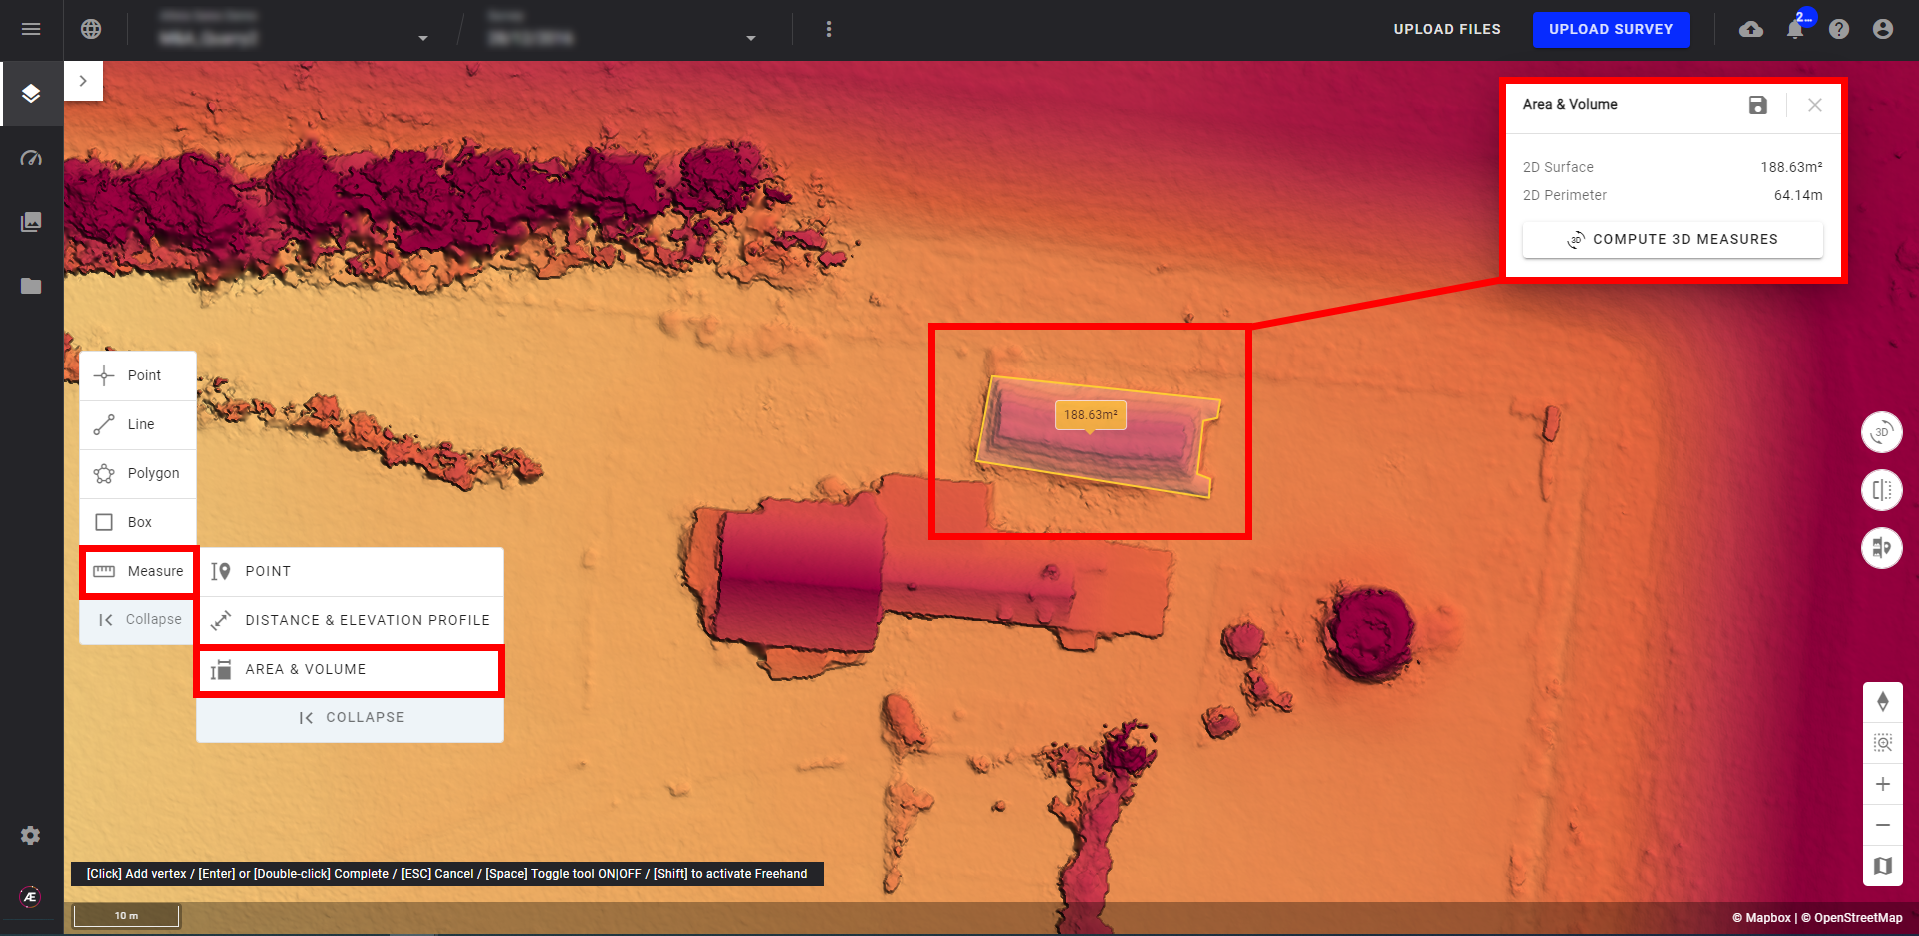
5.2 3D measurements
Step 1 - Click on "COMPUTE 3D MEASURES" to obtain 3D measurements.
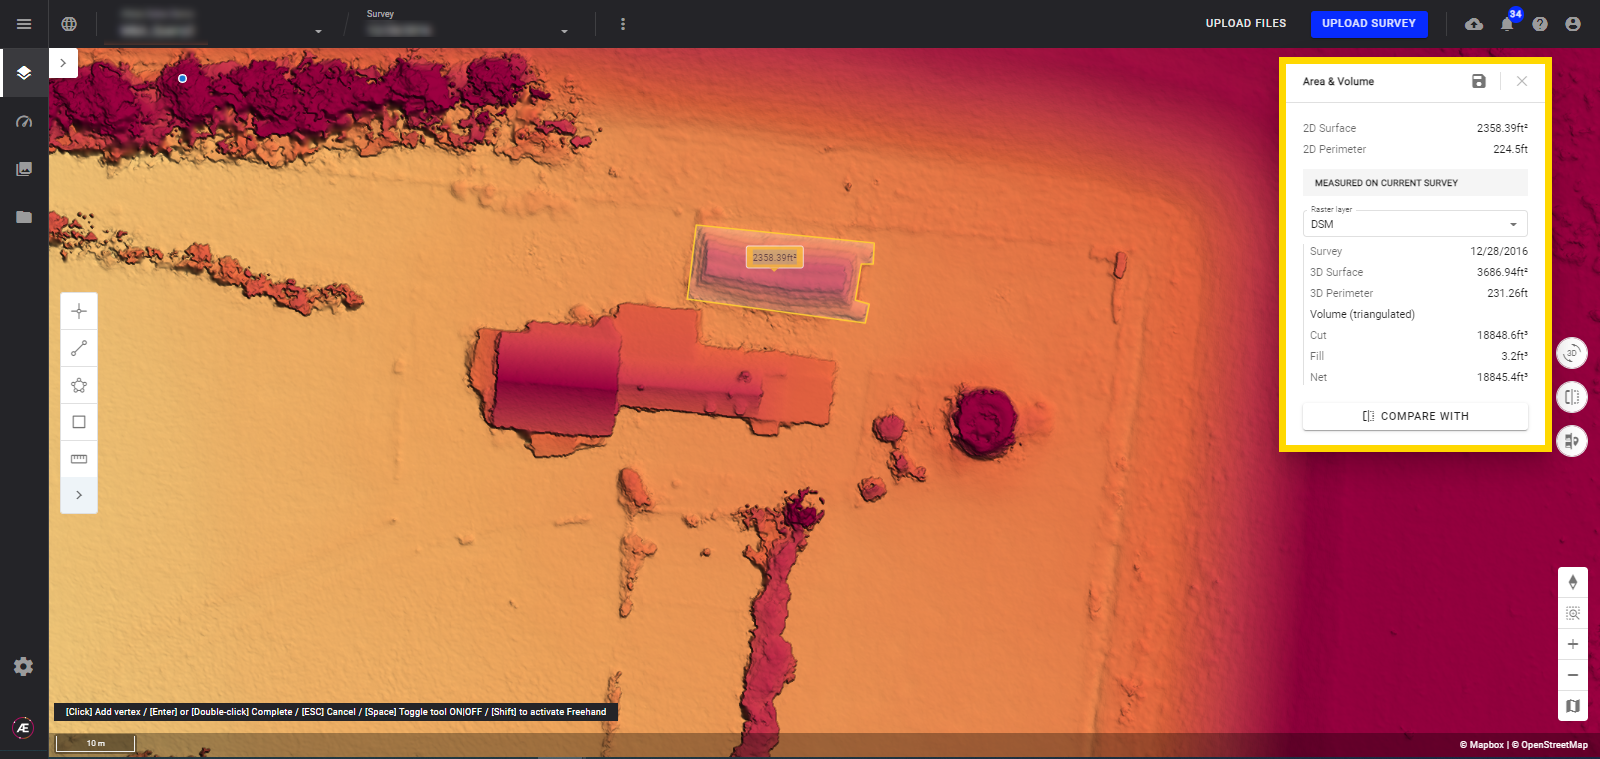
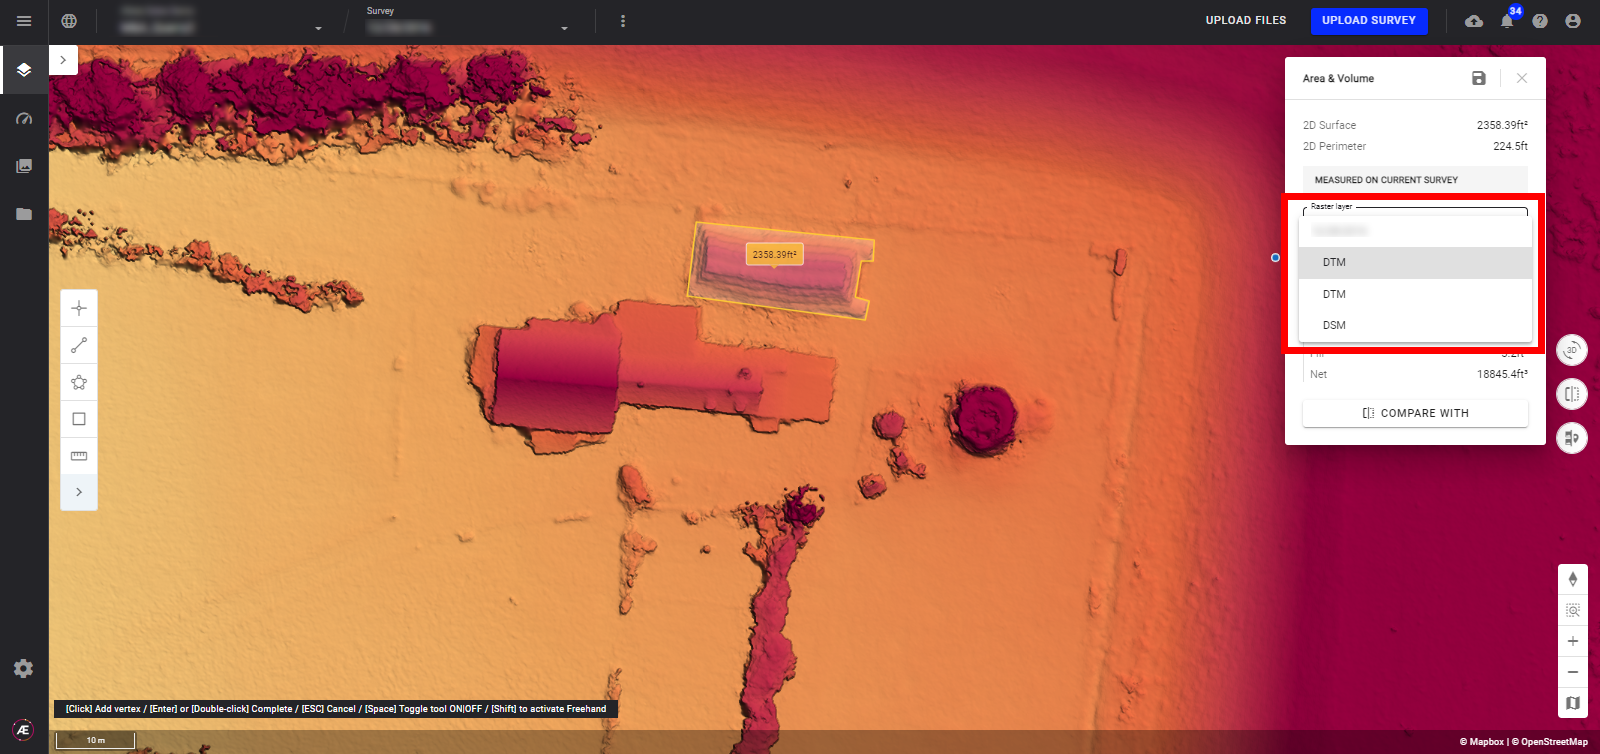
Step 2 - Select the raster layer to which the measures will be applicable.
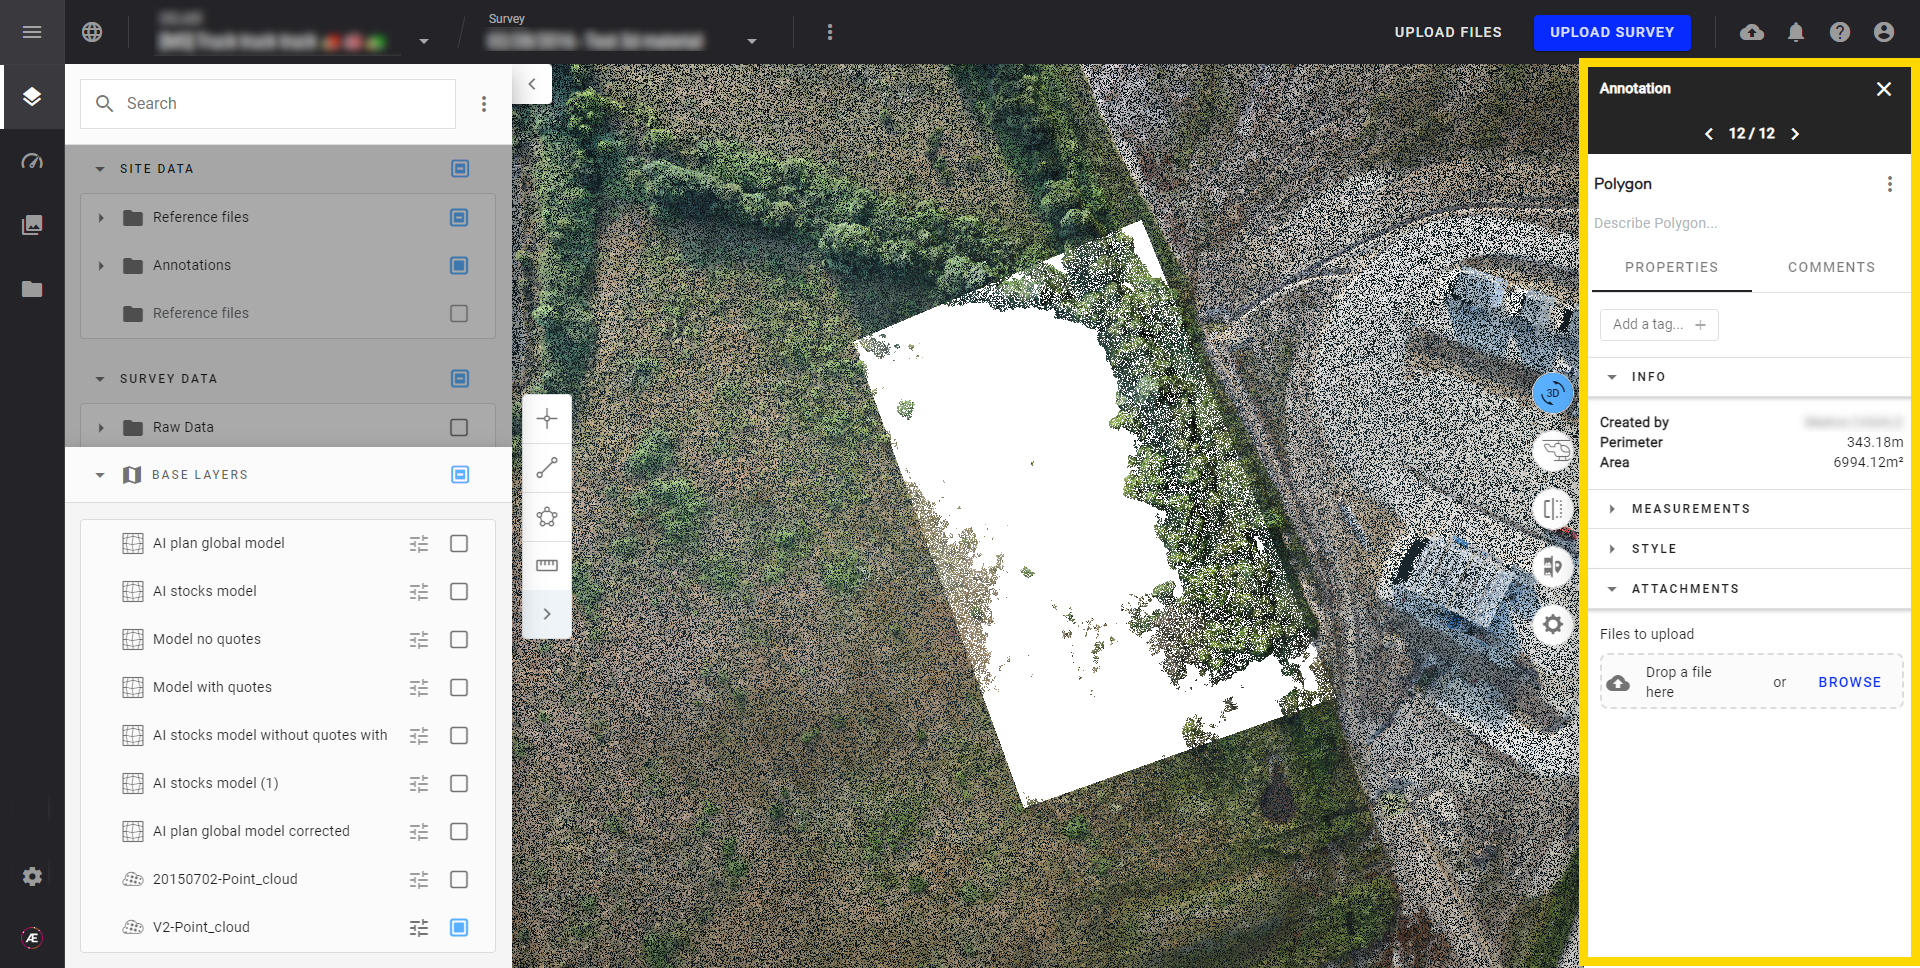
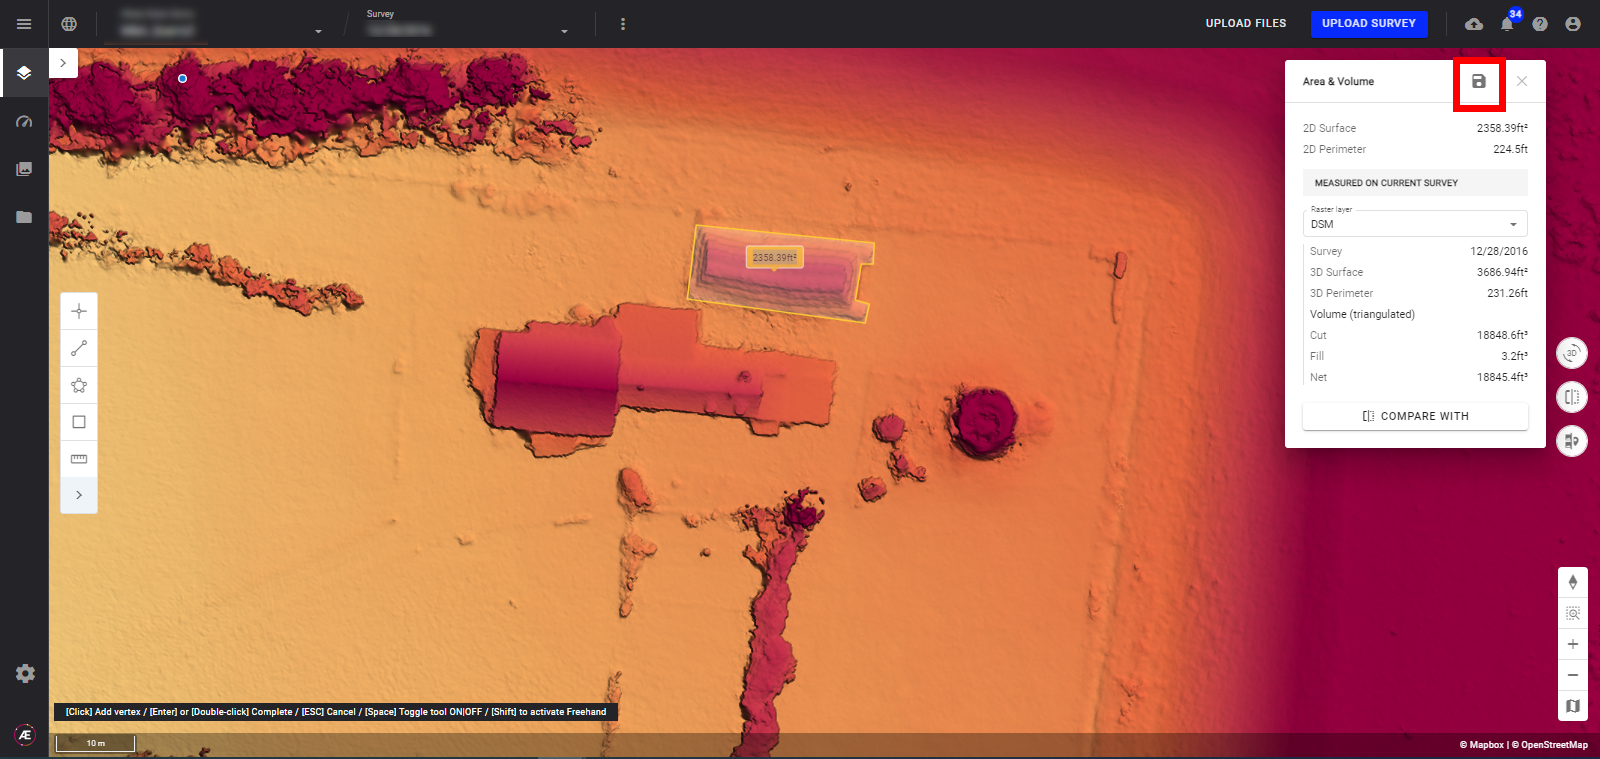
Step 3 - Click on the floppy disk icon to save the polygon as an annotation.
5.3 Compare a polygon measurement
Click on "COMPARE WITH" and select a different raster layer of the current or another survey to compare the values.
Info
For all other information concerning the calculation of volumes, see Volume Calculation.
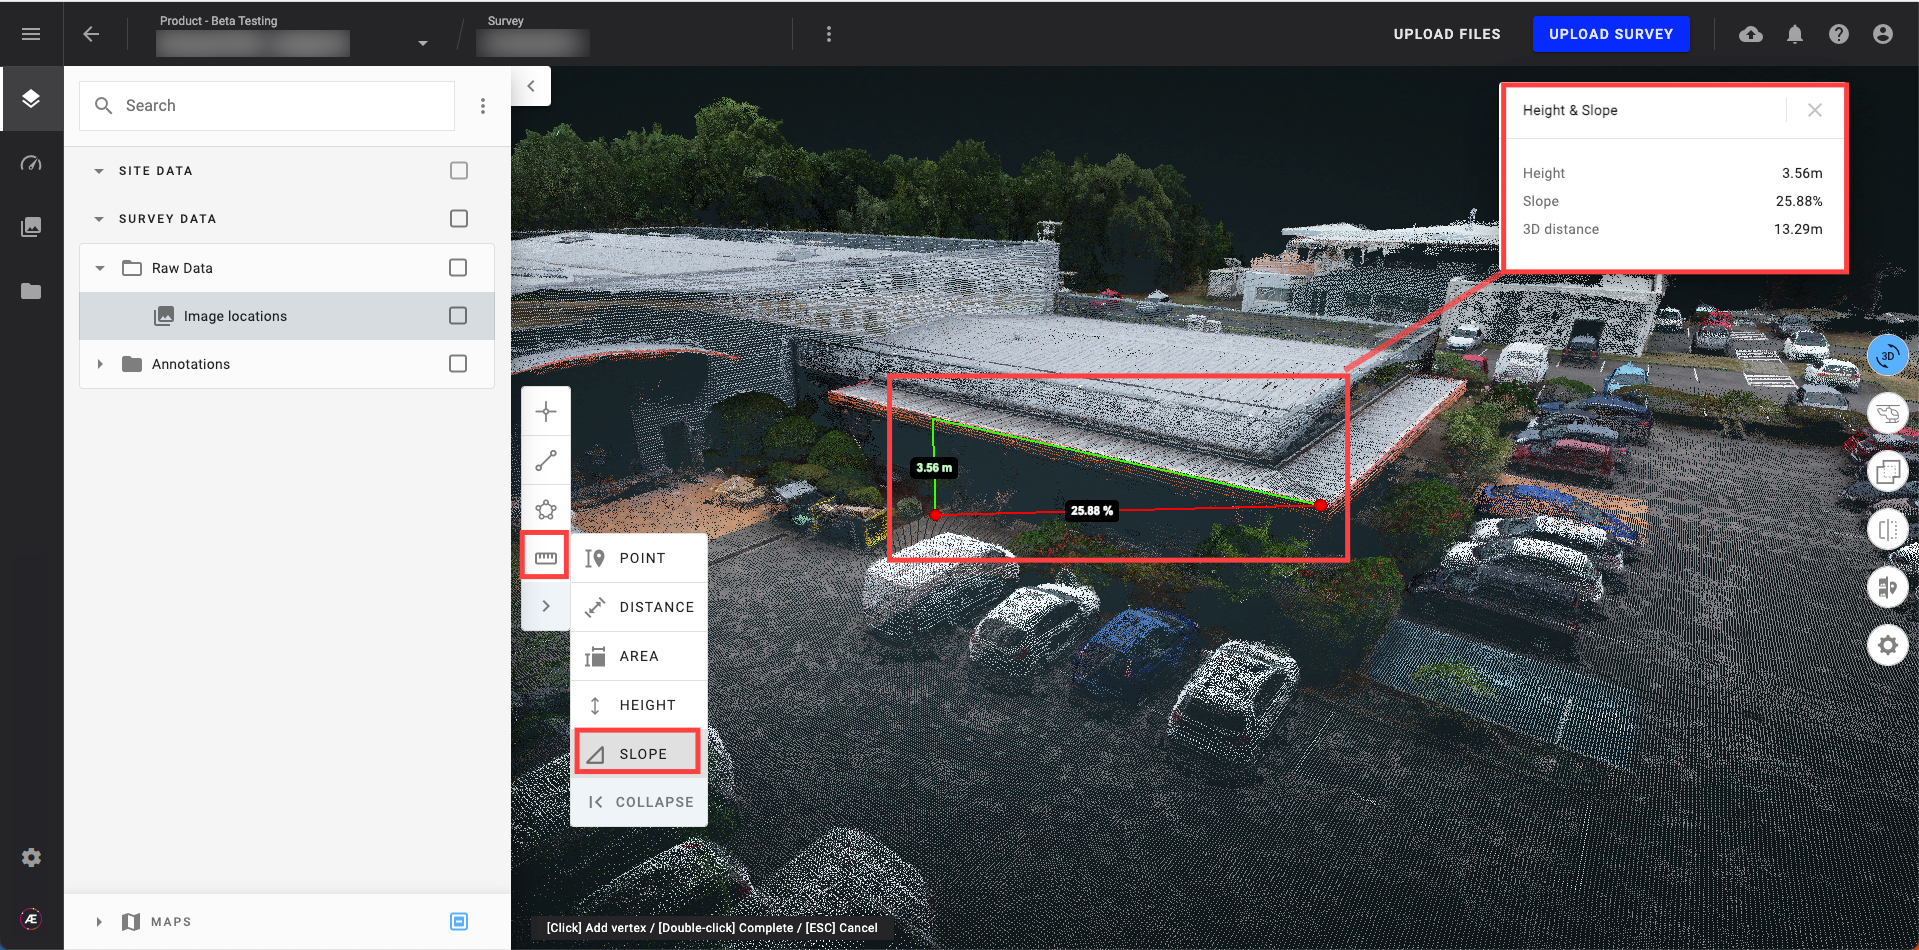
6. 3D View Measurement Tool
Measurements of points, distances, areas, heights, and slopes are also possible in 3D view and are displayed in the same way as in 2D view thanks to a pop-up window.
Info
To obtain consistent measures be sure that units of the Global Project CRS and units of the layer are consistent.
Click on the yellow boxed button below to access or exit the 3D view. To learn more about the 3D view, see 3D Viewer or Advanced 3D Viewer.
- Point
- Area and Volume
- Height
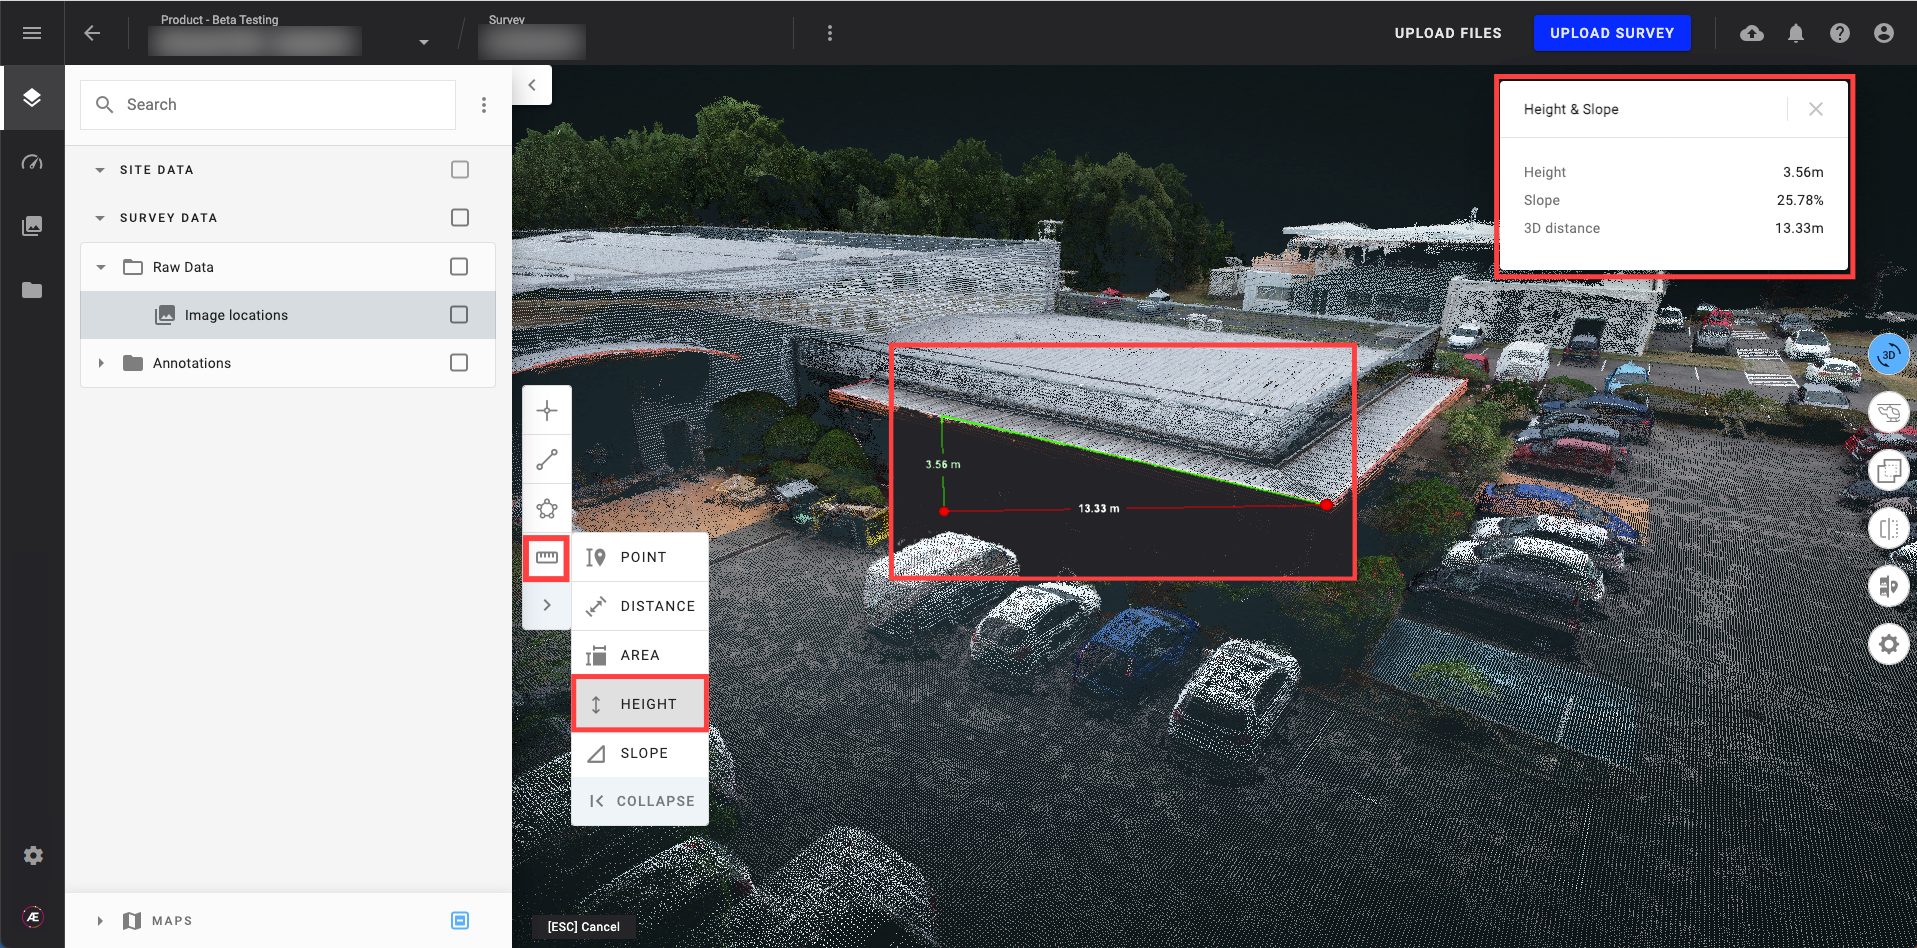
- Slope
- Click on the floppy disk icon to save the polygon as an annotation.