

Spectral Index and Custom Spectral Index Map
1. Description
There are 2 analytics for spectral index map:
- Spectral index map: allows generating available spectral index maps in Aether such as RGB, VARI, NDVI, NDRE, MCARI2, CCCI, MSAVI2, CIR, and PRI.
- Custom spectral index Map: allows generating custom spectral index maps with a specific formula joined by the User.
2. Spectral Index Map
2.1 Inputs
Orthomosaic (from RGB sensor for the VARI) or Reflectance map (from multispectral sensor) are required for this analytics.
See below the required bands in the orthomosaic or reflectance map for each spectral index map:
- Bird View (RGB): red, blue, and green bands or RGB band
- Crop Vigor (NDVI): red and nir bands
- Green Biomass (MCARI2): red, nir and green bands
- Greenness (VARI): red, blue, and green bands or RGB band
- Chlorophyll content (NDRE): red and red edge bands
- PRI: R570 and R531
- MSAVI2: nir, red
- CIR: nir, red, green
- CCCI: nir, red edge
List of band names by sensor models: Sensor Band Names
2.2 Workflow
Step 1 - From the survey page, click on “Analytics”, and search for “Spectral index map”.
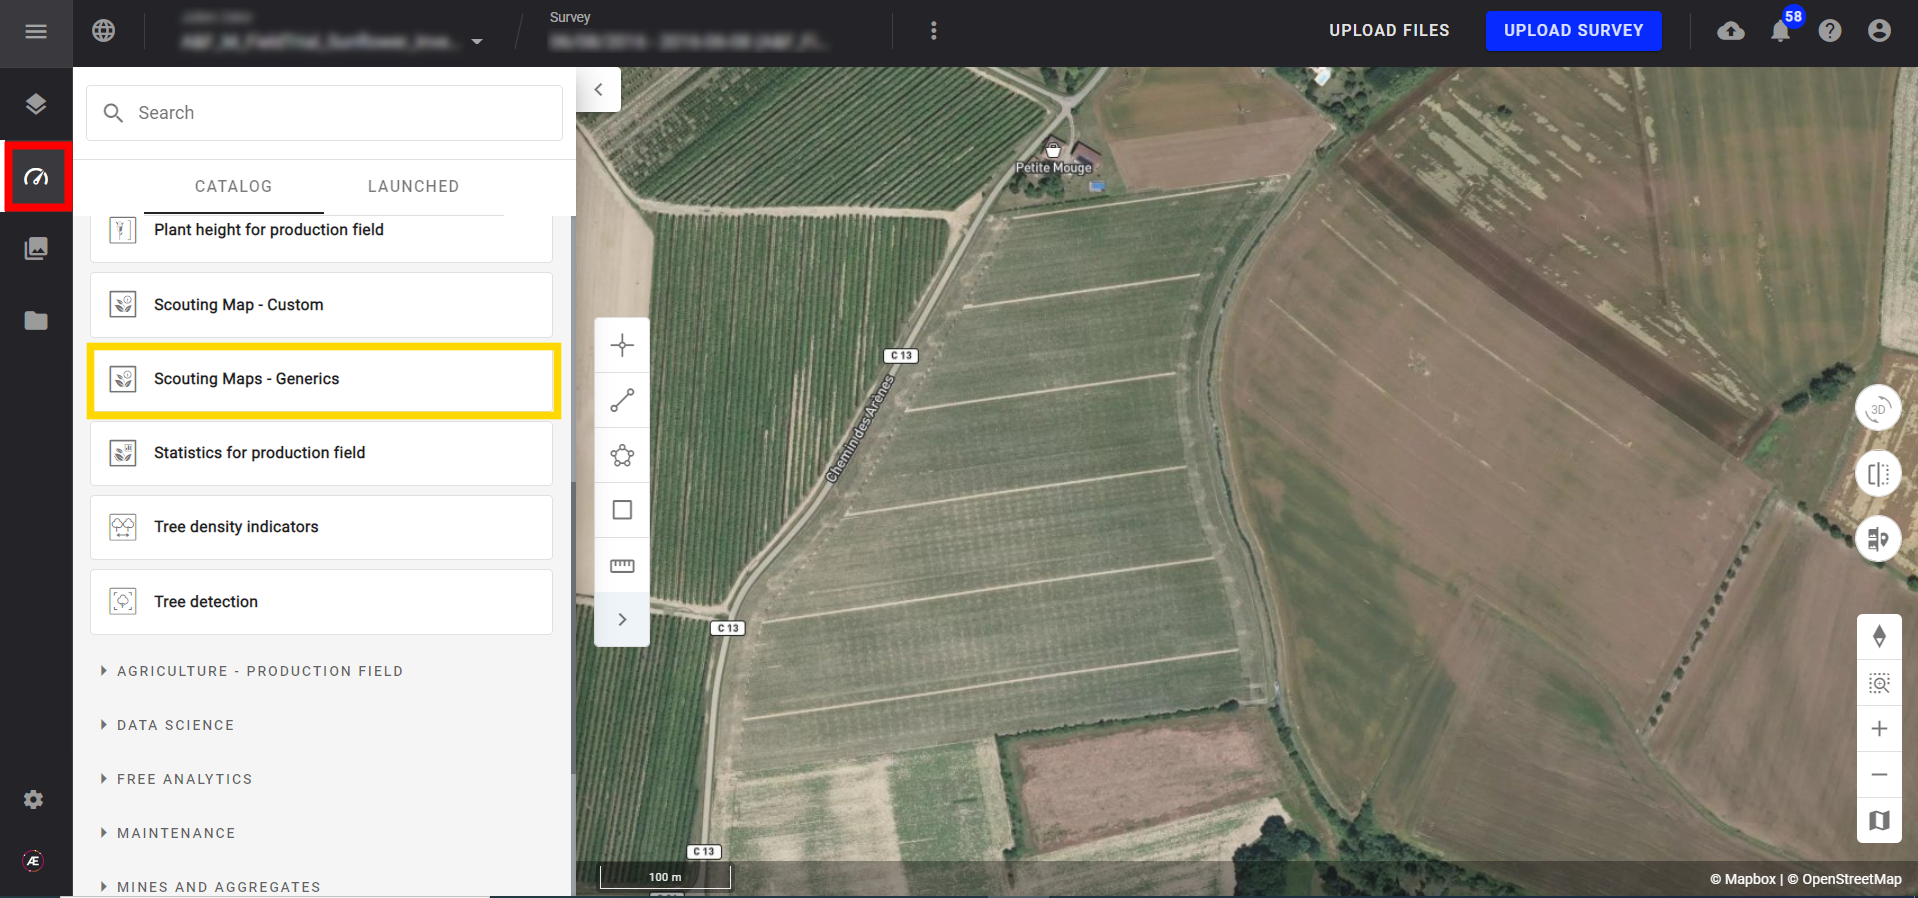
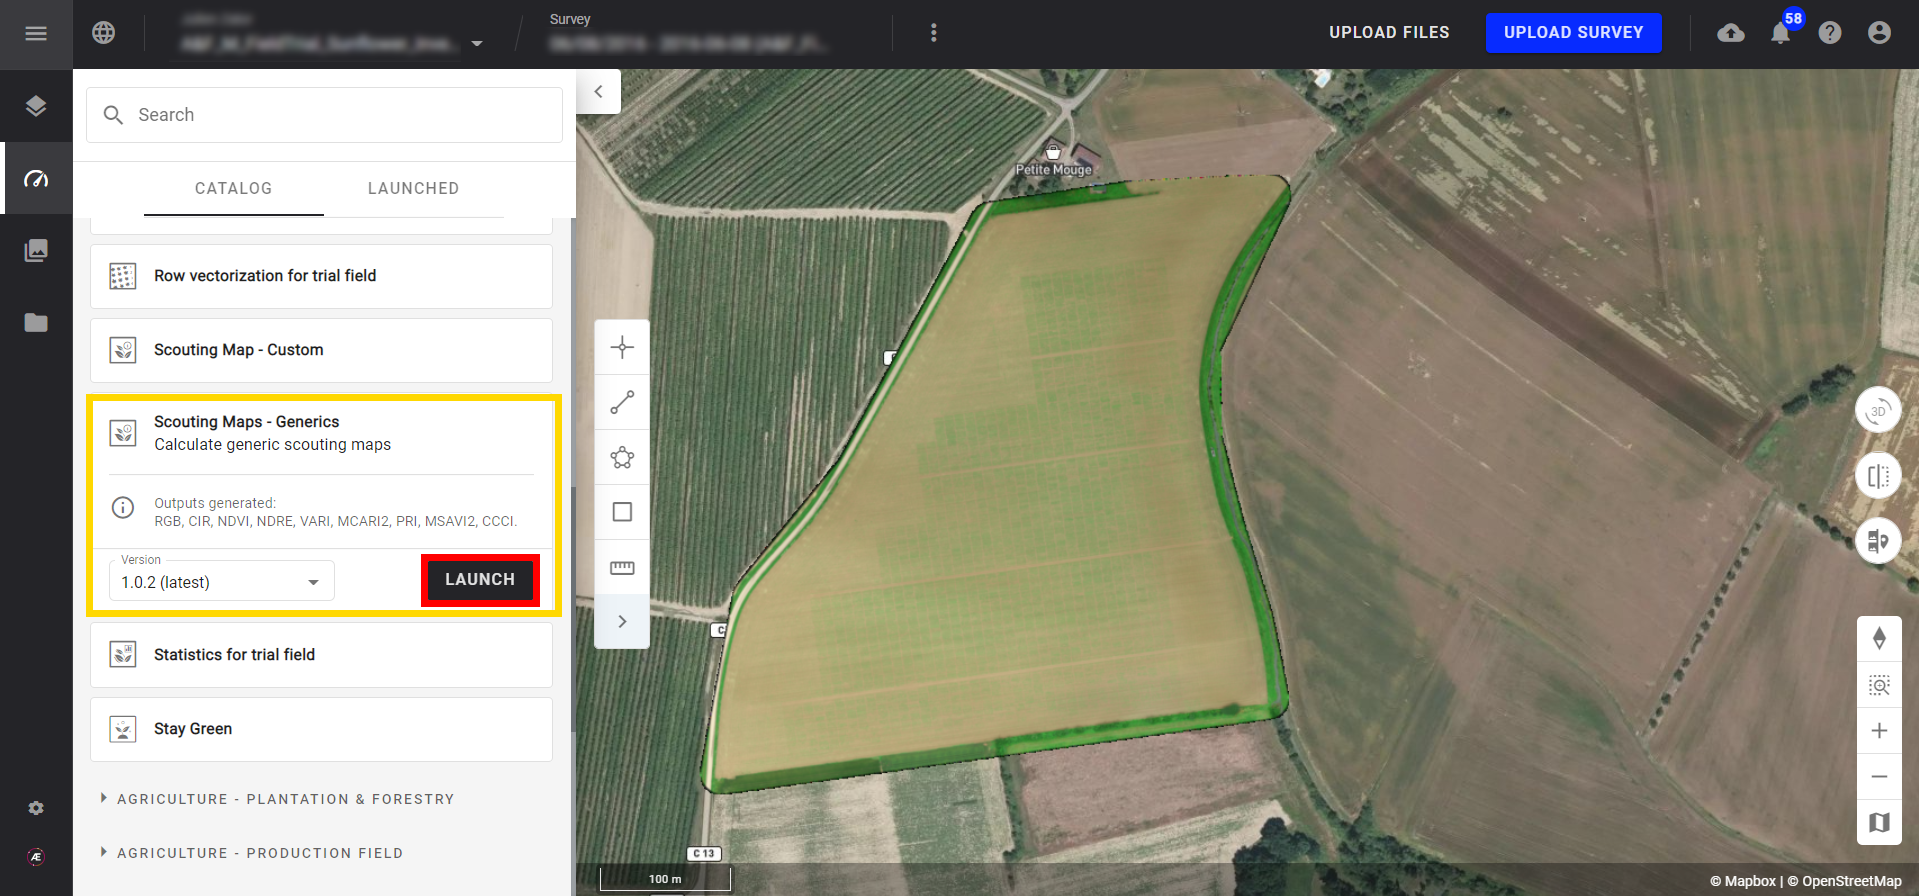
Step 2 - Click on "LAUNCH".
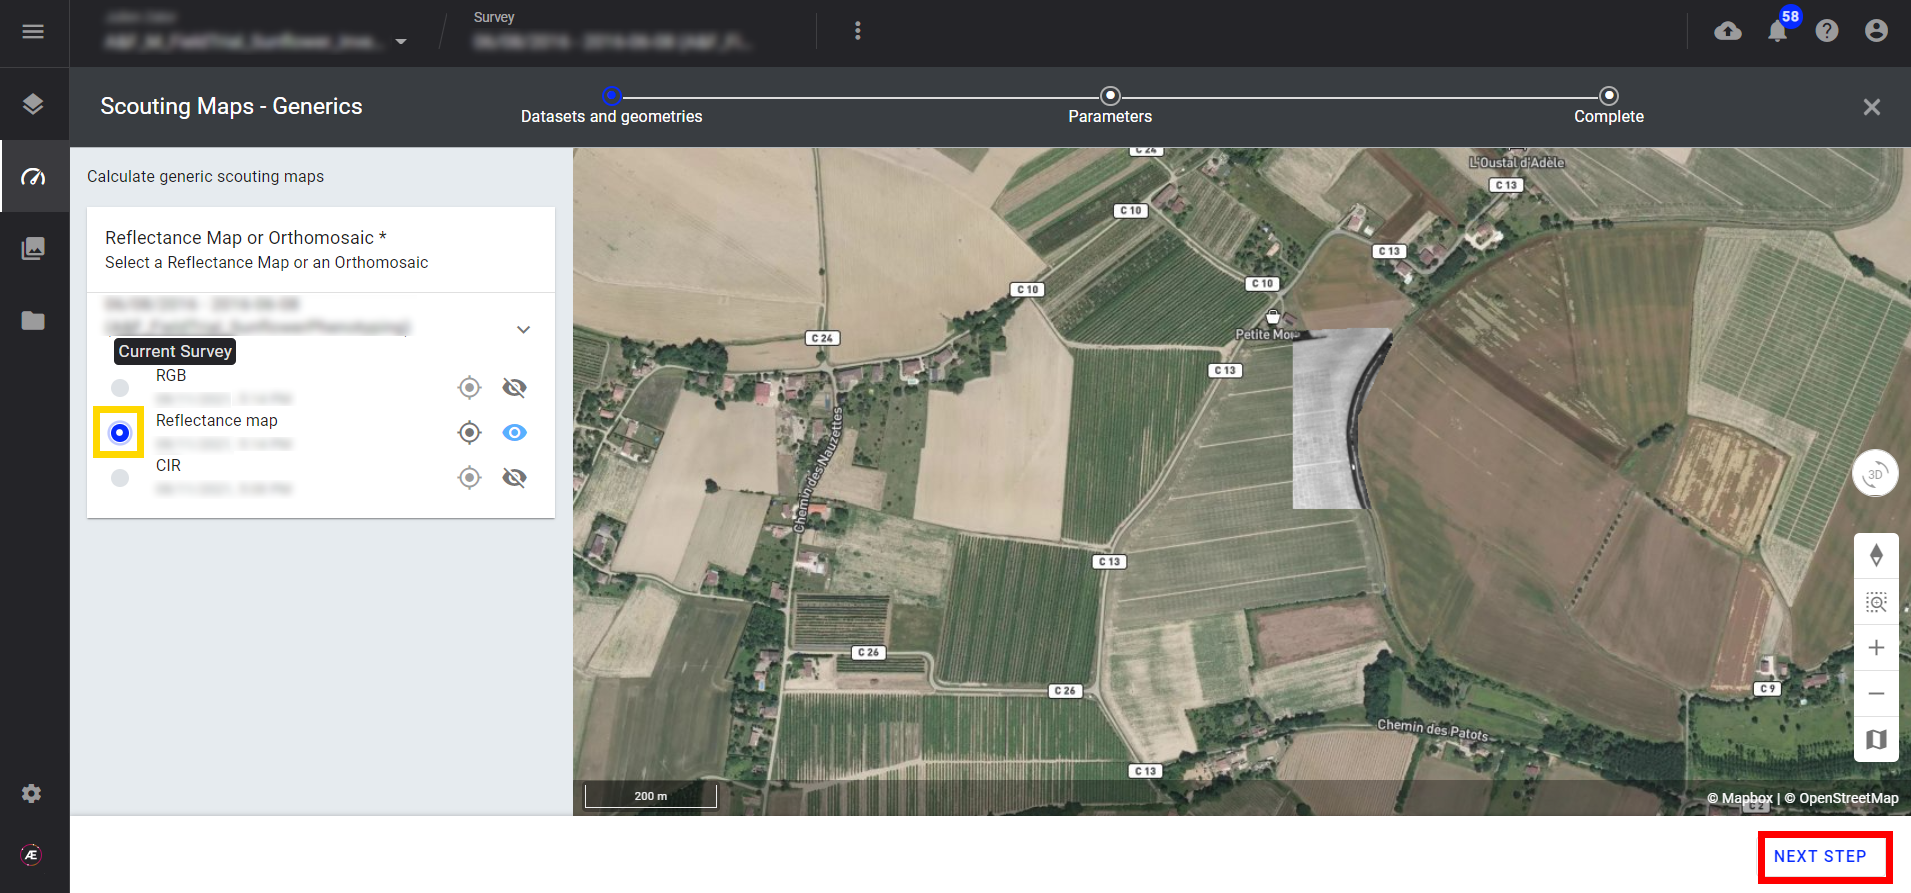
Step 3 - Select the map used as input: RGB map (RGB sensor) or Reflectance map (multispectral sensor) and click on "NEXT STEP".
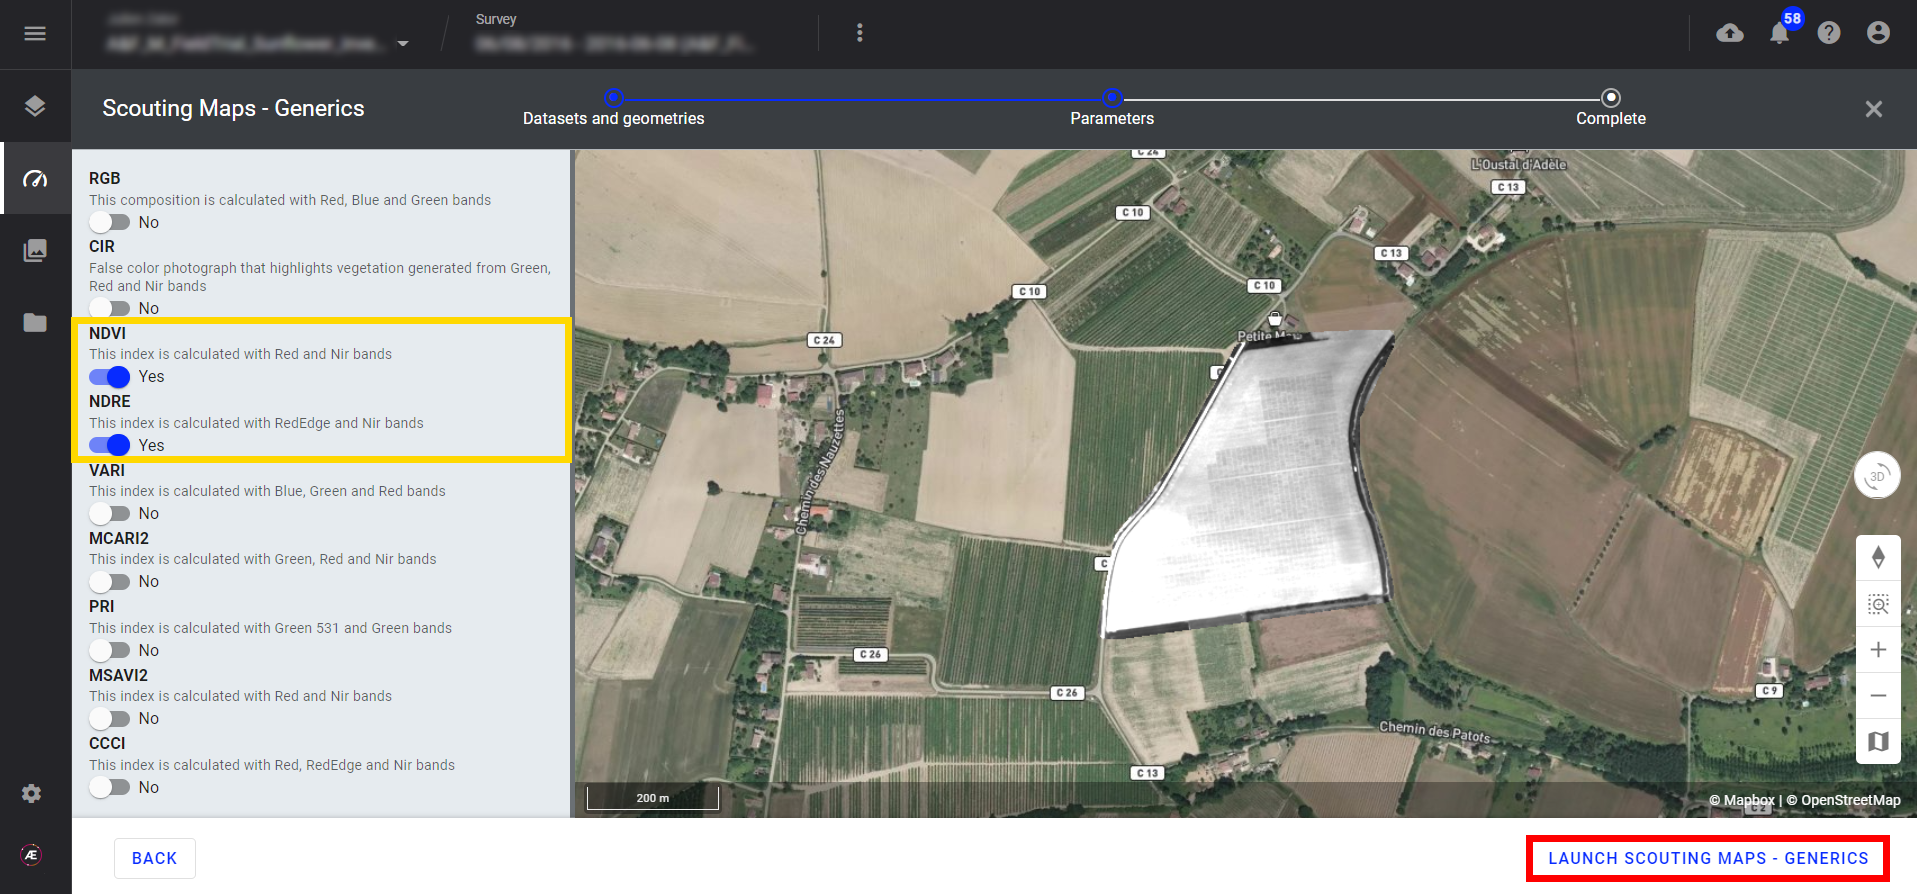
Step 4 - Select the type of spectral index map to generate and click on "LAUNCH SPECTRAL INDEX MAP".
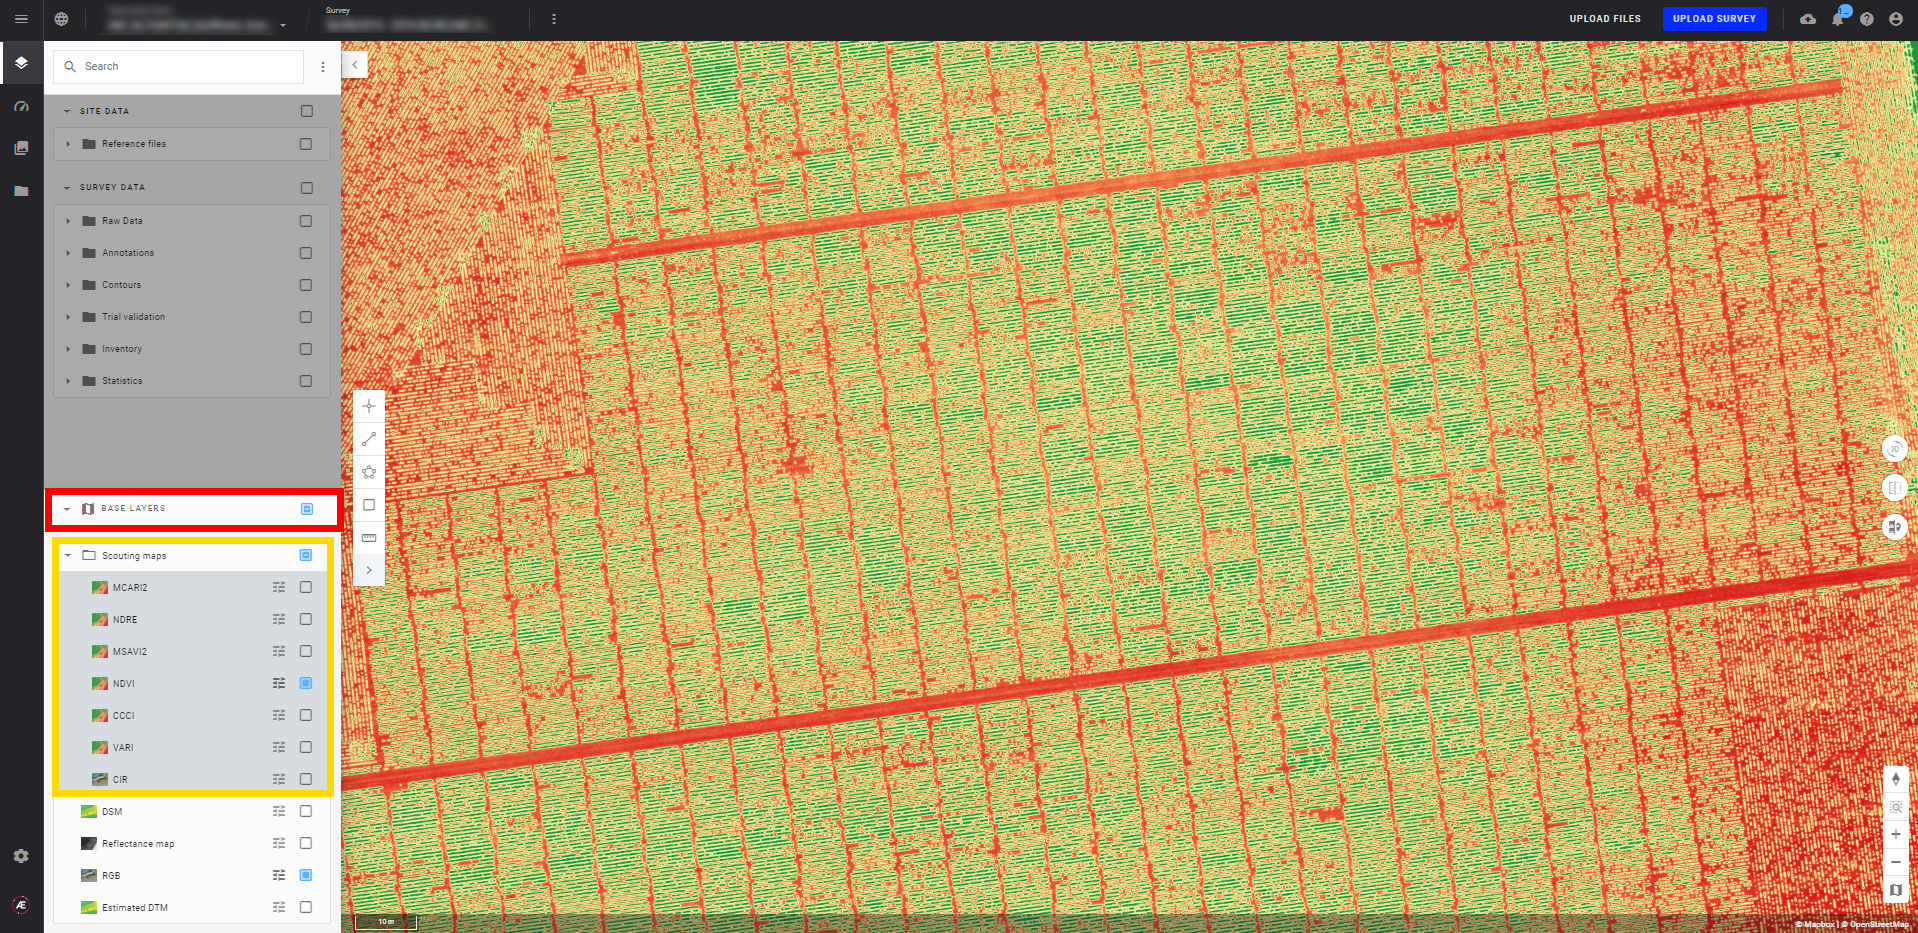
After completion, the spectral index map section appears in the BASE LAYERS of the left panel.
2.3 Outputs
The spectral index map in .tif format is available in the "Download" section and visualizable in the platform.
3. Custom Spectral Index Map
3.1 Inputs
- Orthomosaic (from the RGB sensor) or Reflectance map (from the multispectral sensor) are required for this analytics.
- Custom spectral index map formula.
3.2 Workflow
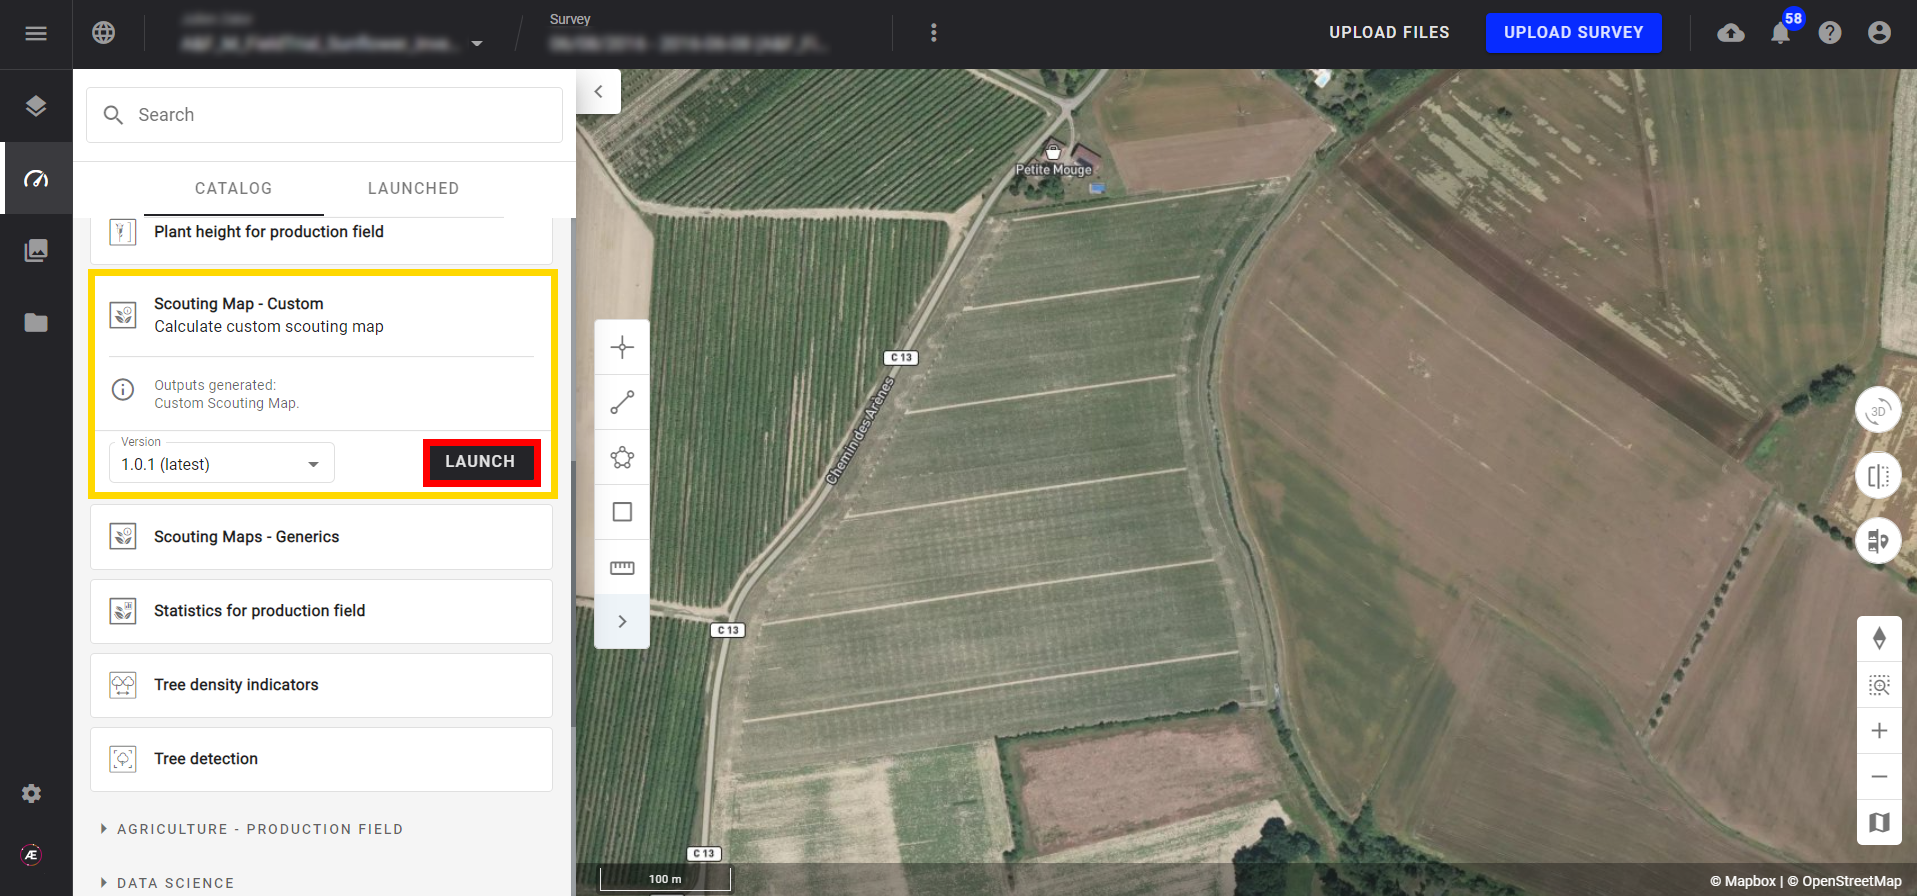
Step 1 - From the survey page, click on “Analytics”, and search for “custom spectral index map”.

Step 2 - Click on "LAUNCH".
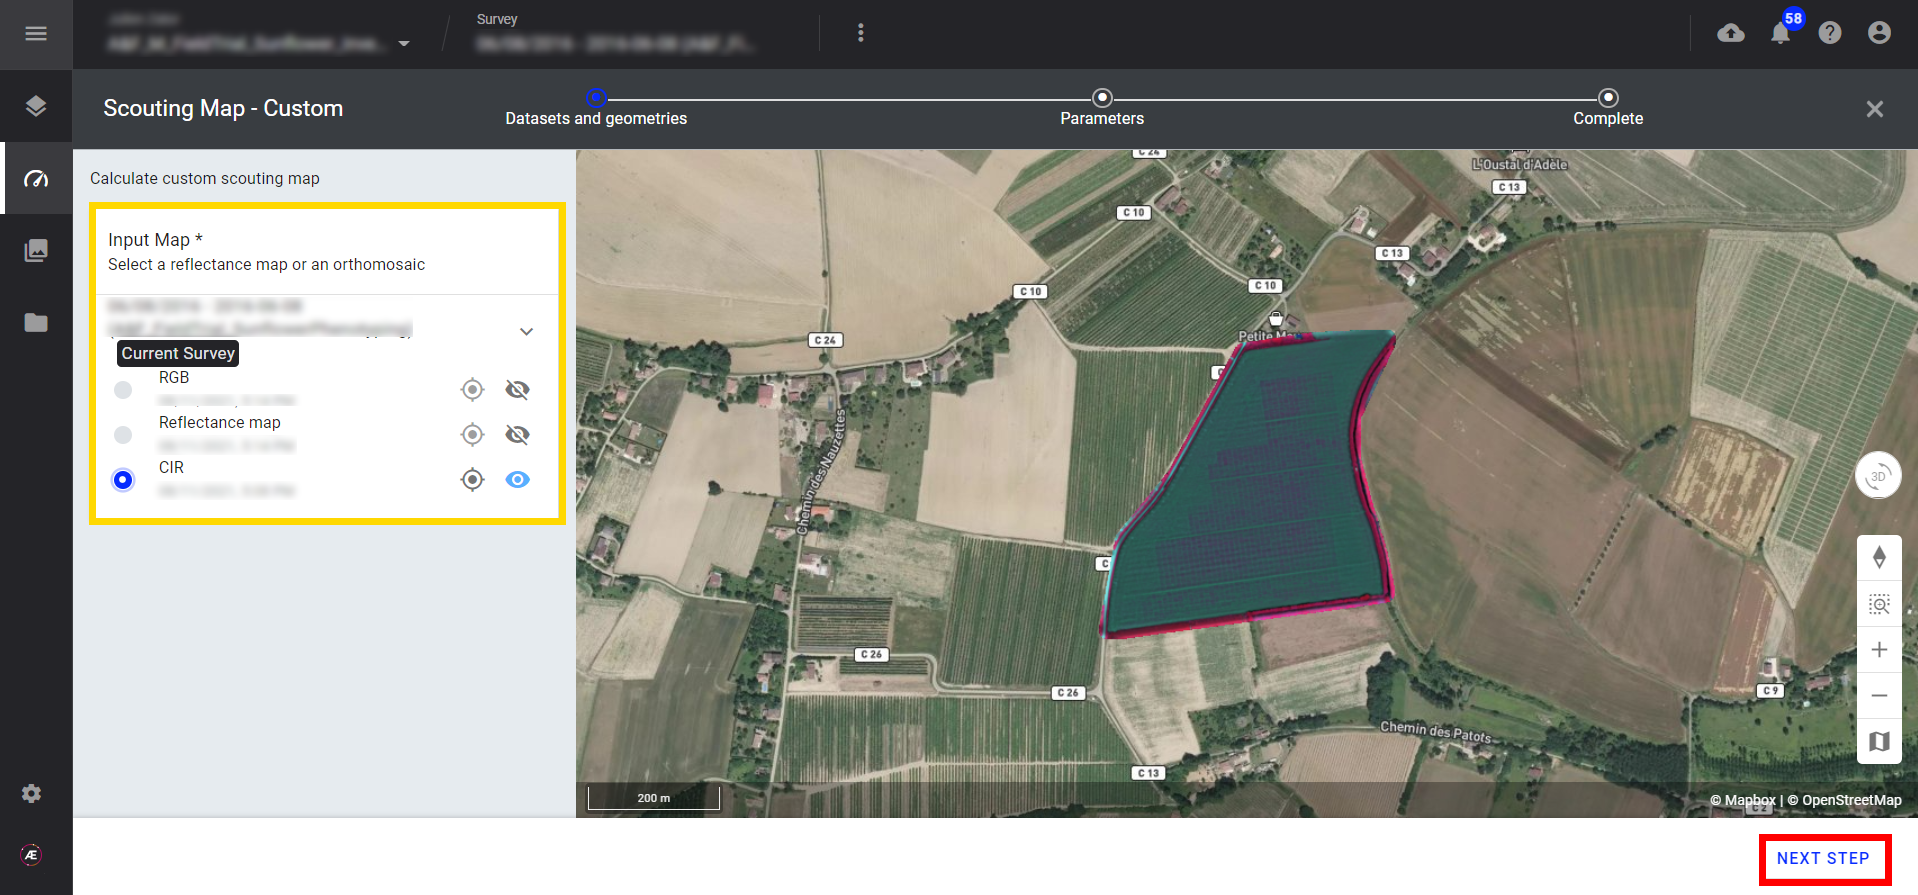
Step 3 - Select the map used as input: RGB map (RGB sensor) or Reflectance map (multispectral sensor), and click on "NEXT STEP".
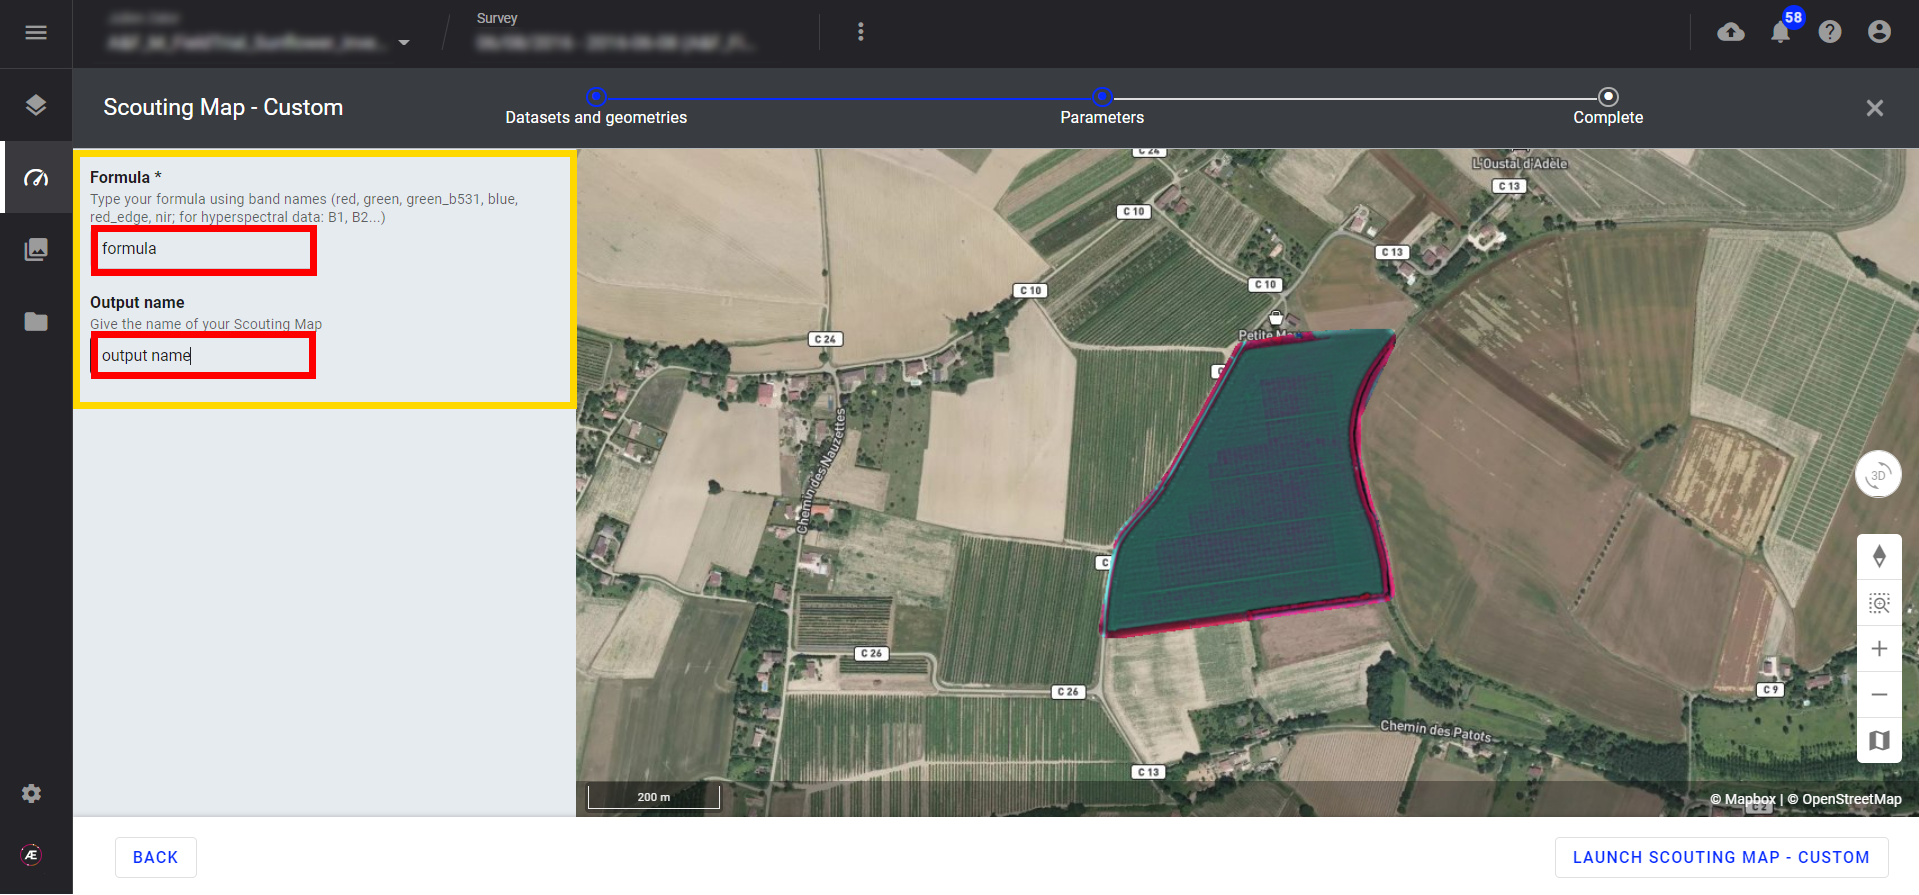
Step 4 - Type the formula using band names and operators then enter an output name.
| OPERATOR OR FUNCTION | STRING | FORMULA EXAMPLE |
| Sum | + | red+nir |
| Subtraction | - | red-nir |
| Division | / | red/nir |
| Multiplication | * | red*nir |
| Power | x**n OR x^n | nir**3 OR nir^3 |
| Square Root | sqrt(x) | sqrt(nir) |
| Exponential | exp(x) | exp(nir) |
| Natural Logarithm | log(x) | log(nir) |
| Logarithm | log(x,n) | log(nir,4) |
| Cos | cos(x) | cos(nir) |
| Sin | sin(x) | sin(nir) |
| Tan | tan(x) | tan(nir) |
| Acos | acos(x) | acos(nir) |
| Asin | asin(x) | asin(nir) |
| Atan | atan(x) | atan(nir) |
| Pi | x*pi | red*pi |
| Parentheses | 3*(x+y) | 3*(nir+red) |
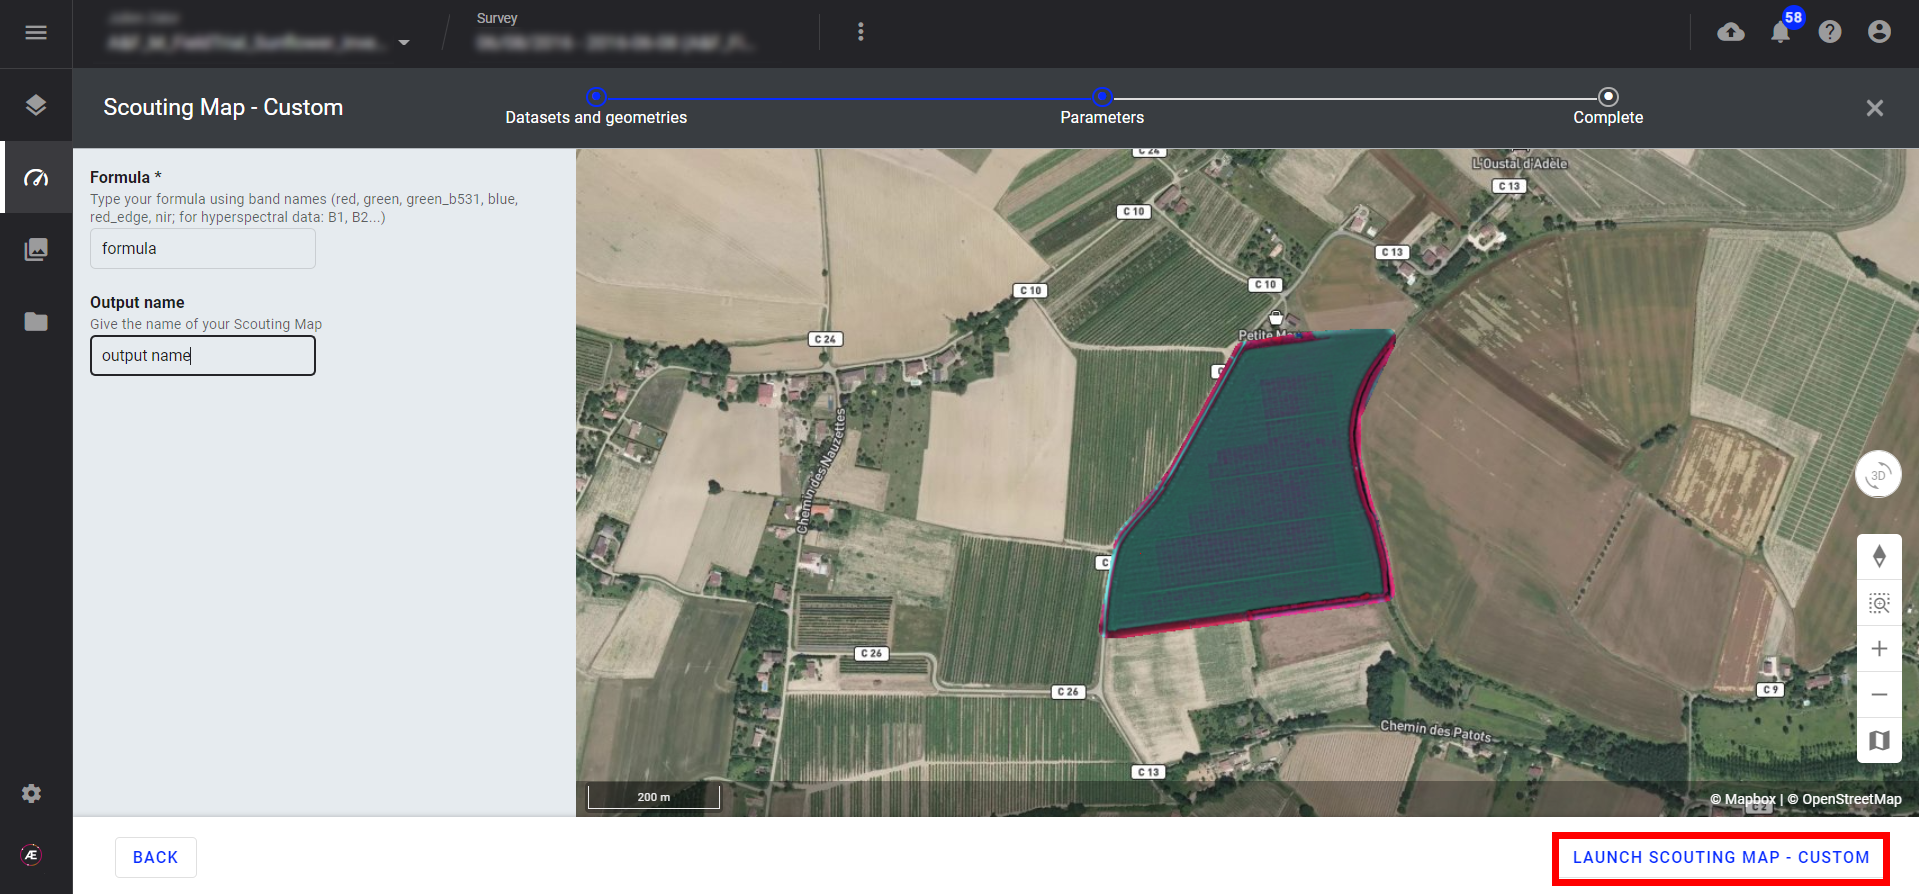
Step 5 - Click on "LAUNCH CUSTOM SPECTRAL INDEX MAP".
After completion, the spectral index maps section appears in the BASE LAYERS of the left panel.
From there features such as Value at Point to read indices values at any map position or use a Point annotation to extract values are available (read Measurement Tool for more information). The custom map can be exported from the Download section as well.
3.3 Outputs
The spectral index map in .tif format is available in the "Download" section and visualizable in the platform.
4. Use the spectral index map
Please read the article Spectral Index Map to see how to value the results
