Season Planner - Introduction
1. Description
The Season Planner allows users to:
- Automate data processing chains for digital phenotyping by describing the sequence of analyses to be performed throughout the season.
- Standardize processing chains between different projects.
- Track the progress of data collection and processing tasks.
The Season Planner module collaborates with the Data Acquisition module, as detailed in the dedicated article.
The joint functionality of these modules significantly simplifies the field trial assessments in agriculture research and development. This includes defining the parameters to monitor, determining the methodology for acquiring those parameters, planning the flight path, and extracting the relevant data.
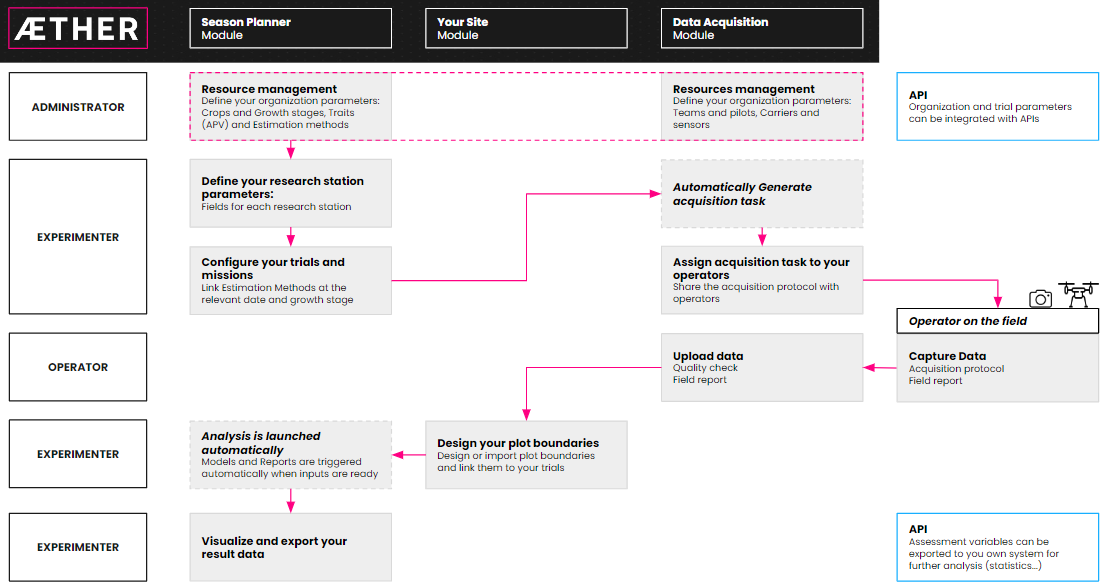
5-step workflow:
- Module configuration: Define your field experiments, assessment parameters, and the related estimation method.
- Data Acquisition module configuration: Manage your teams, their data collection devices, and related sensors.
- Trials and Missions creation: Plan and monitor all stages of the data operations throughout the year.
- Collection tasks monitoring: Plan automatically your data collection campaigns and task the right operator for the job.
- Data Upload and Quality Check: Streamline the data upload, quality check, and data processing.
2. Workflow Overview
2.1 Module configuration
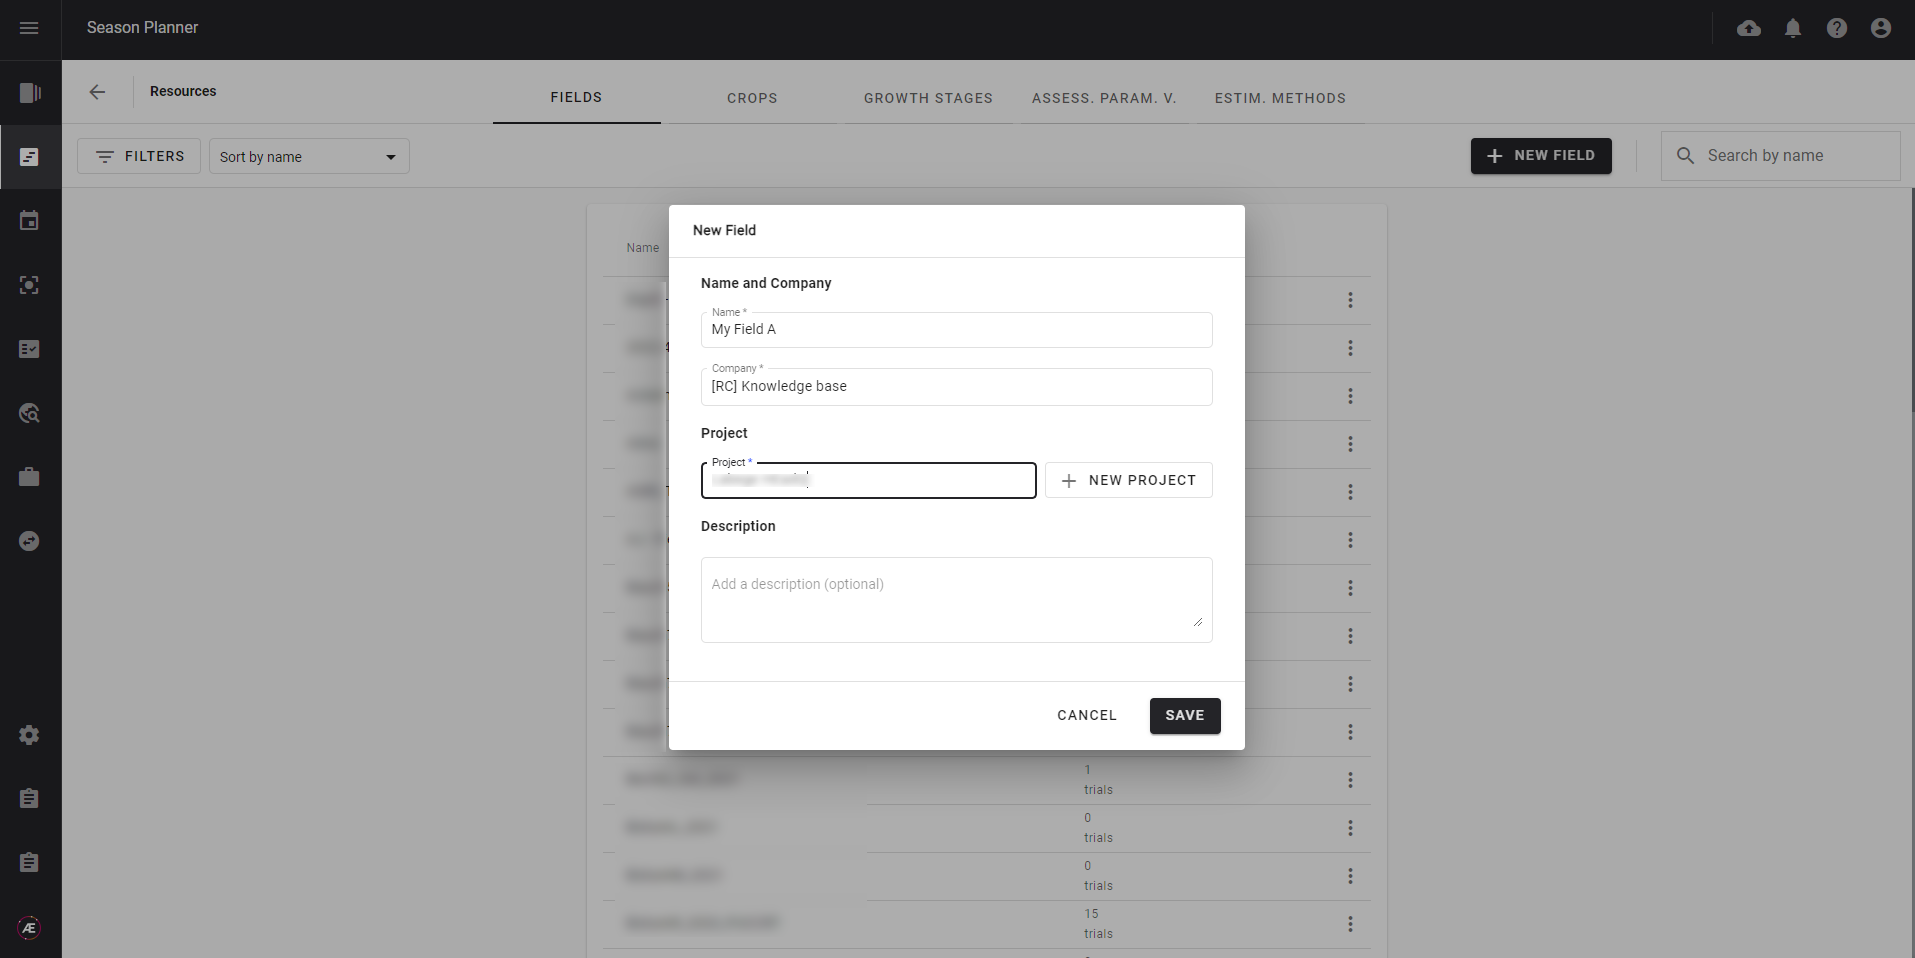
Define your organization's assets in the Season Planner, create and name your fields, and link them to a specific project to describe the different crop types and growth stages. A field in the platform corresponds to a geographical area where one or more trials can be carried out, there can be several fields for the same project.
Define trait assessment parameters and the associated estimation method. Assessment Parameter Variables (APV) are the user-defined attributes to be measured to assess a trait or plant response to an experiment. The estimation method defines which analytics, custom or pre-set, needs to be used to compute the APV. The APV appears in the report generated by the Season Planner.
2.2 Data Acquisition Module Configuration
Define the resources owned for data acquisition, and create teams of pilots to whom you will assign data collection tasks, according to the type of equipment they use.
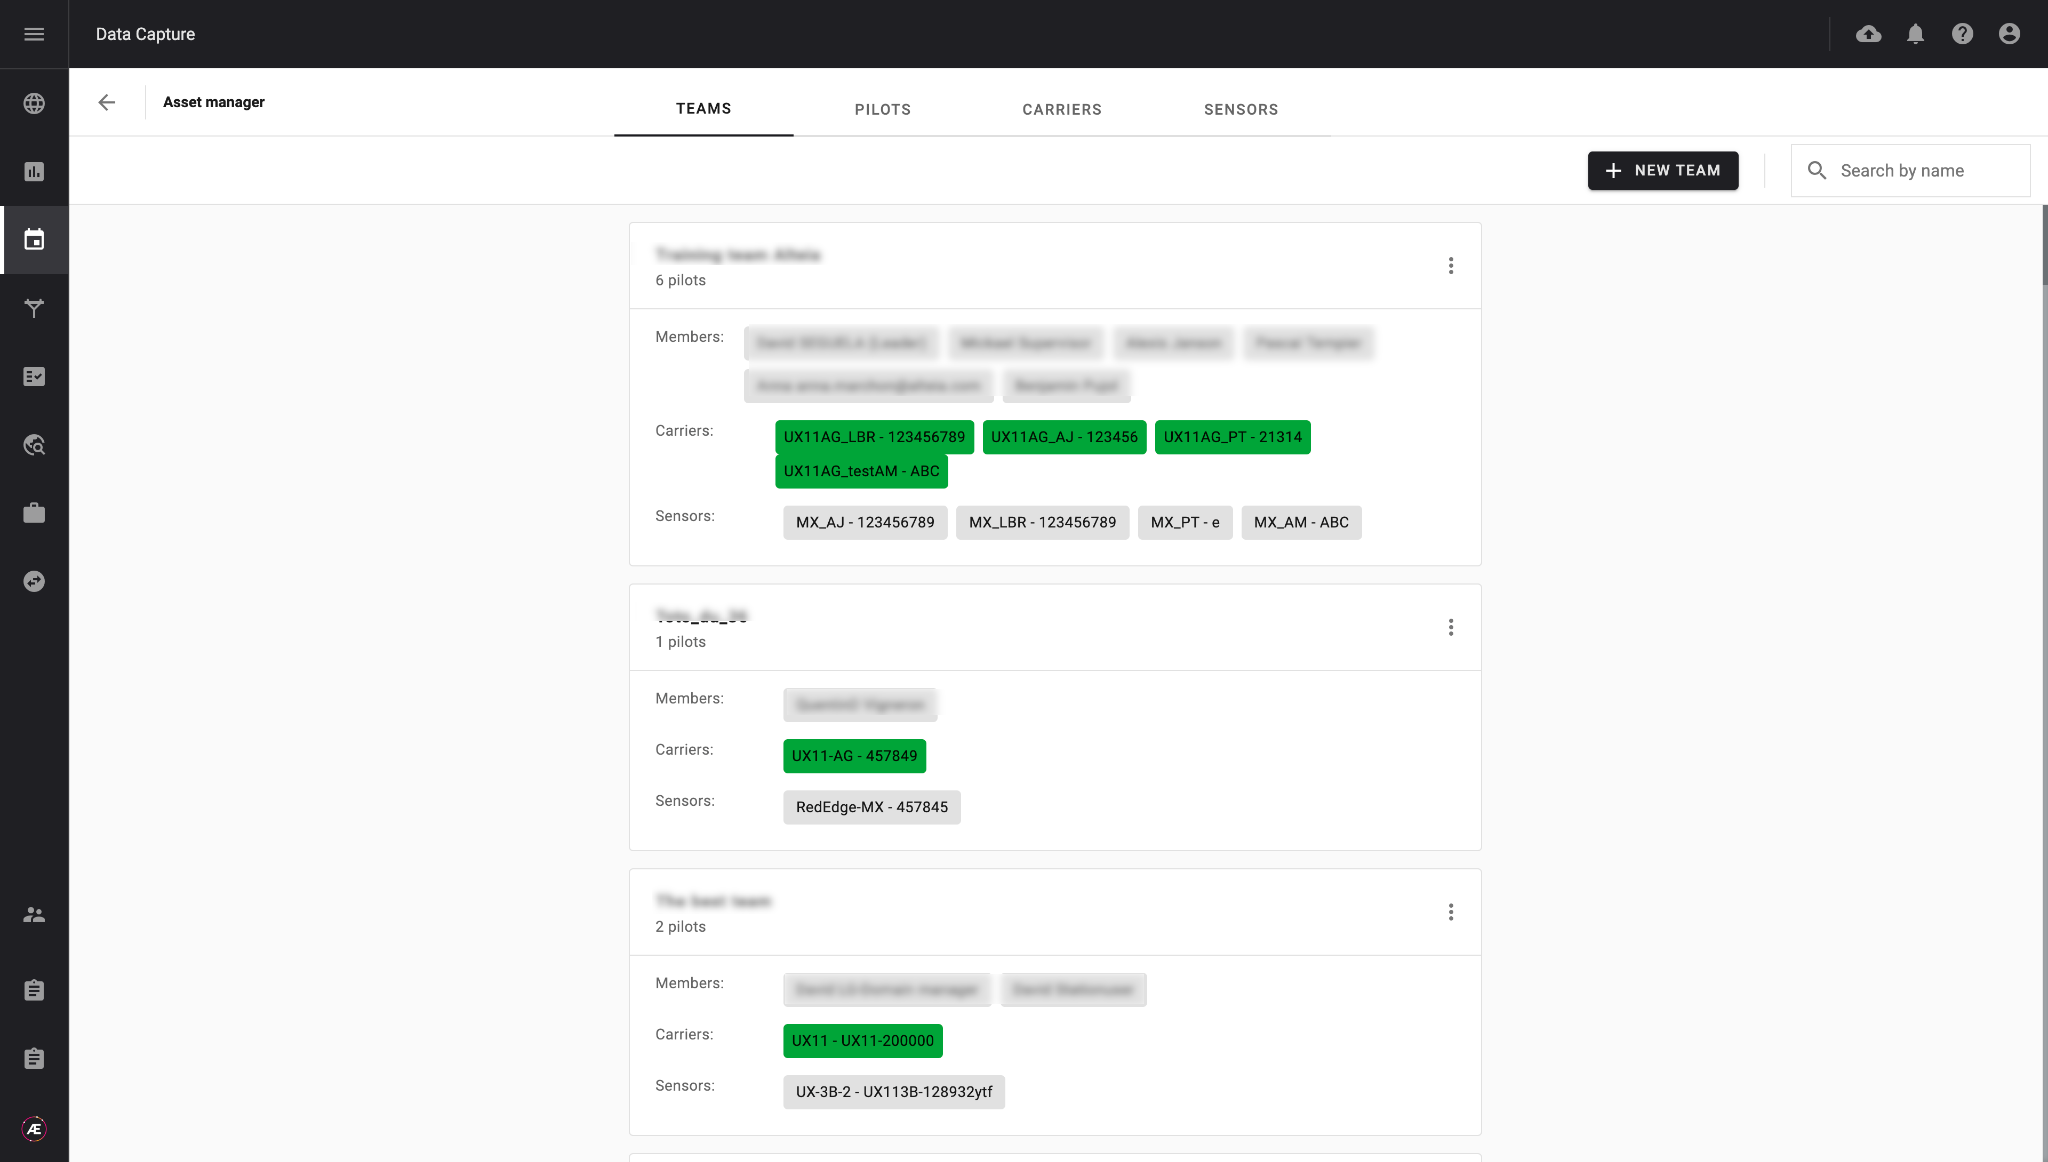
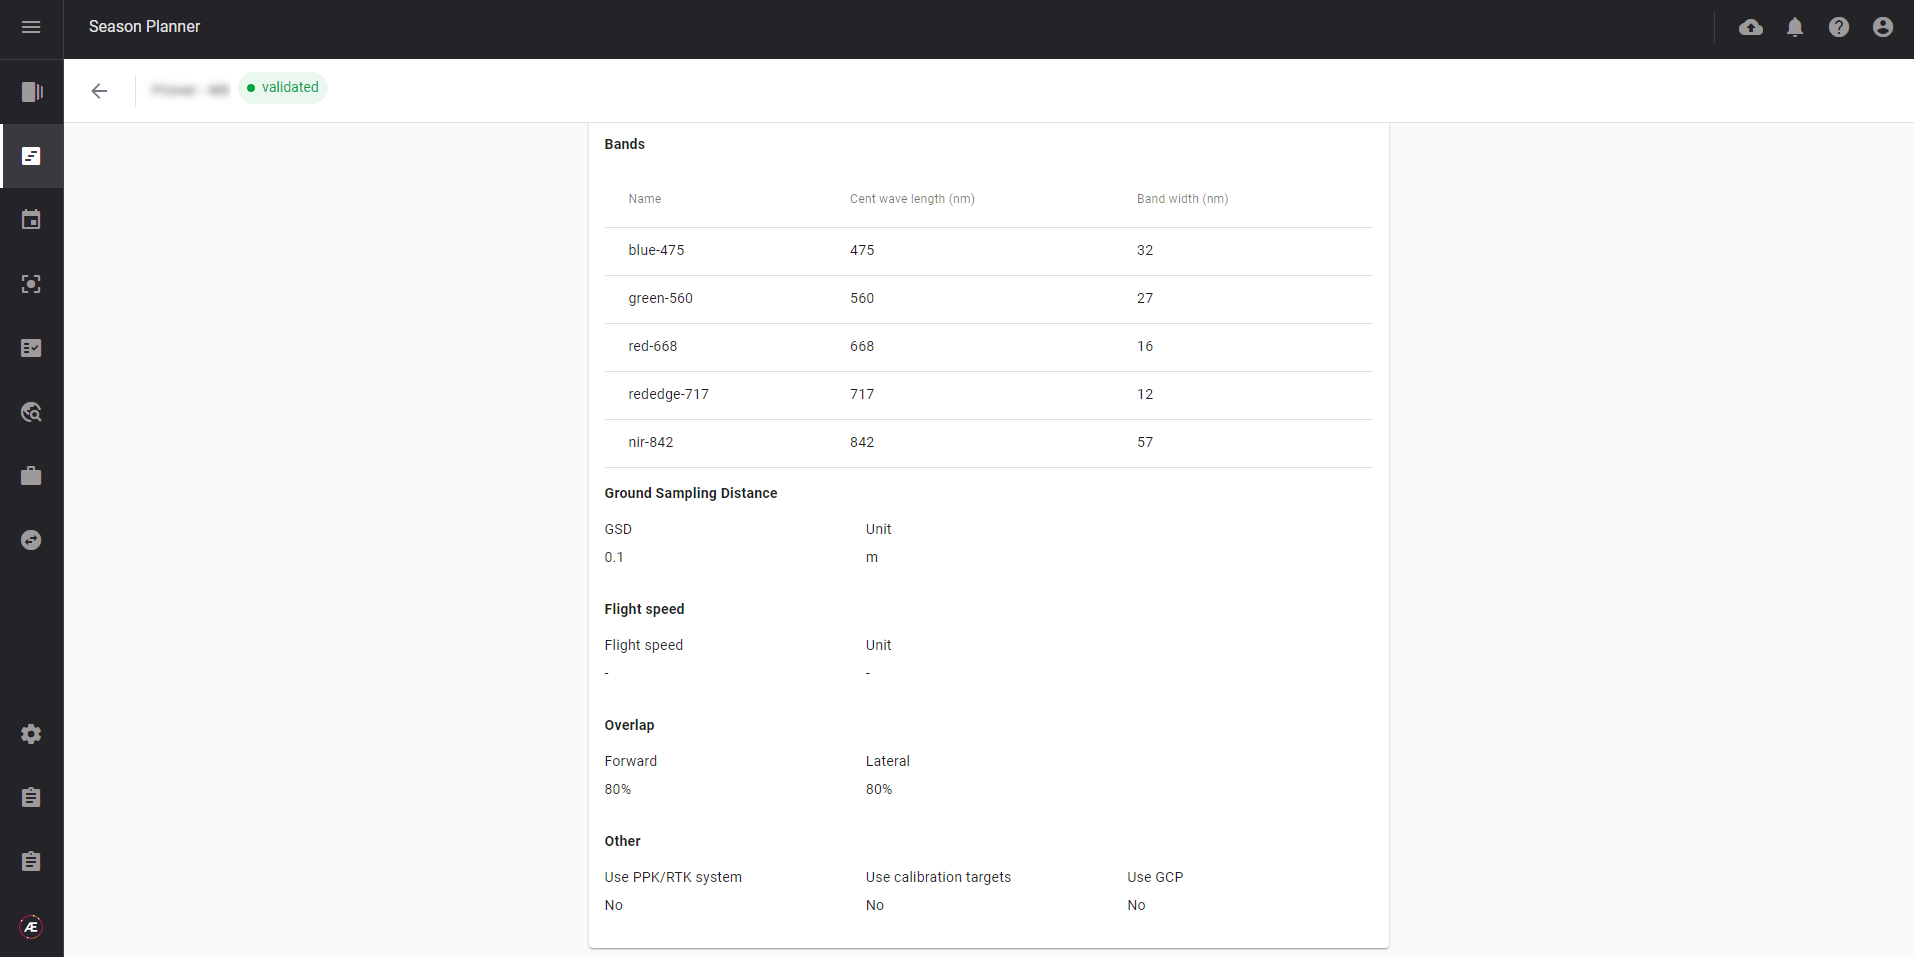
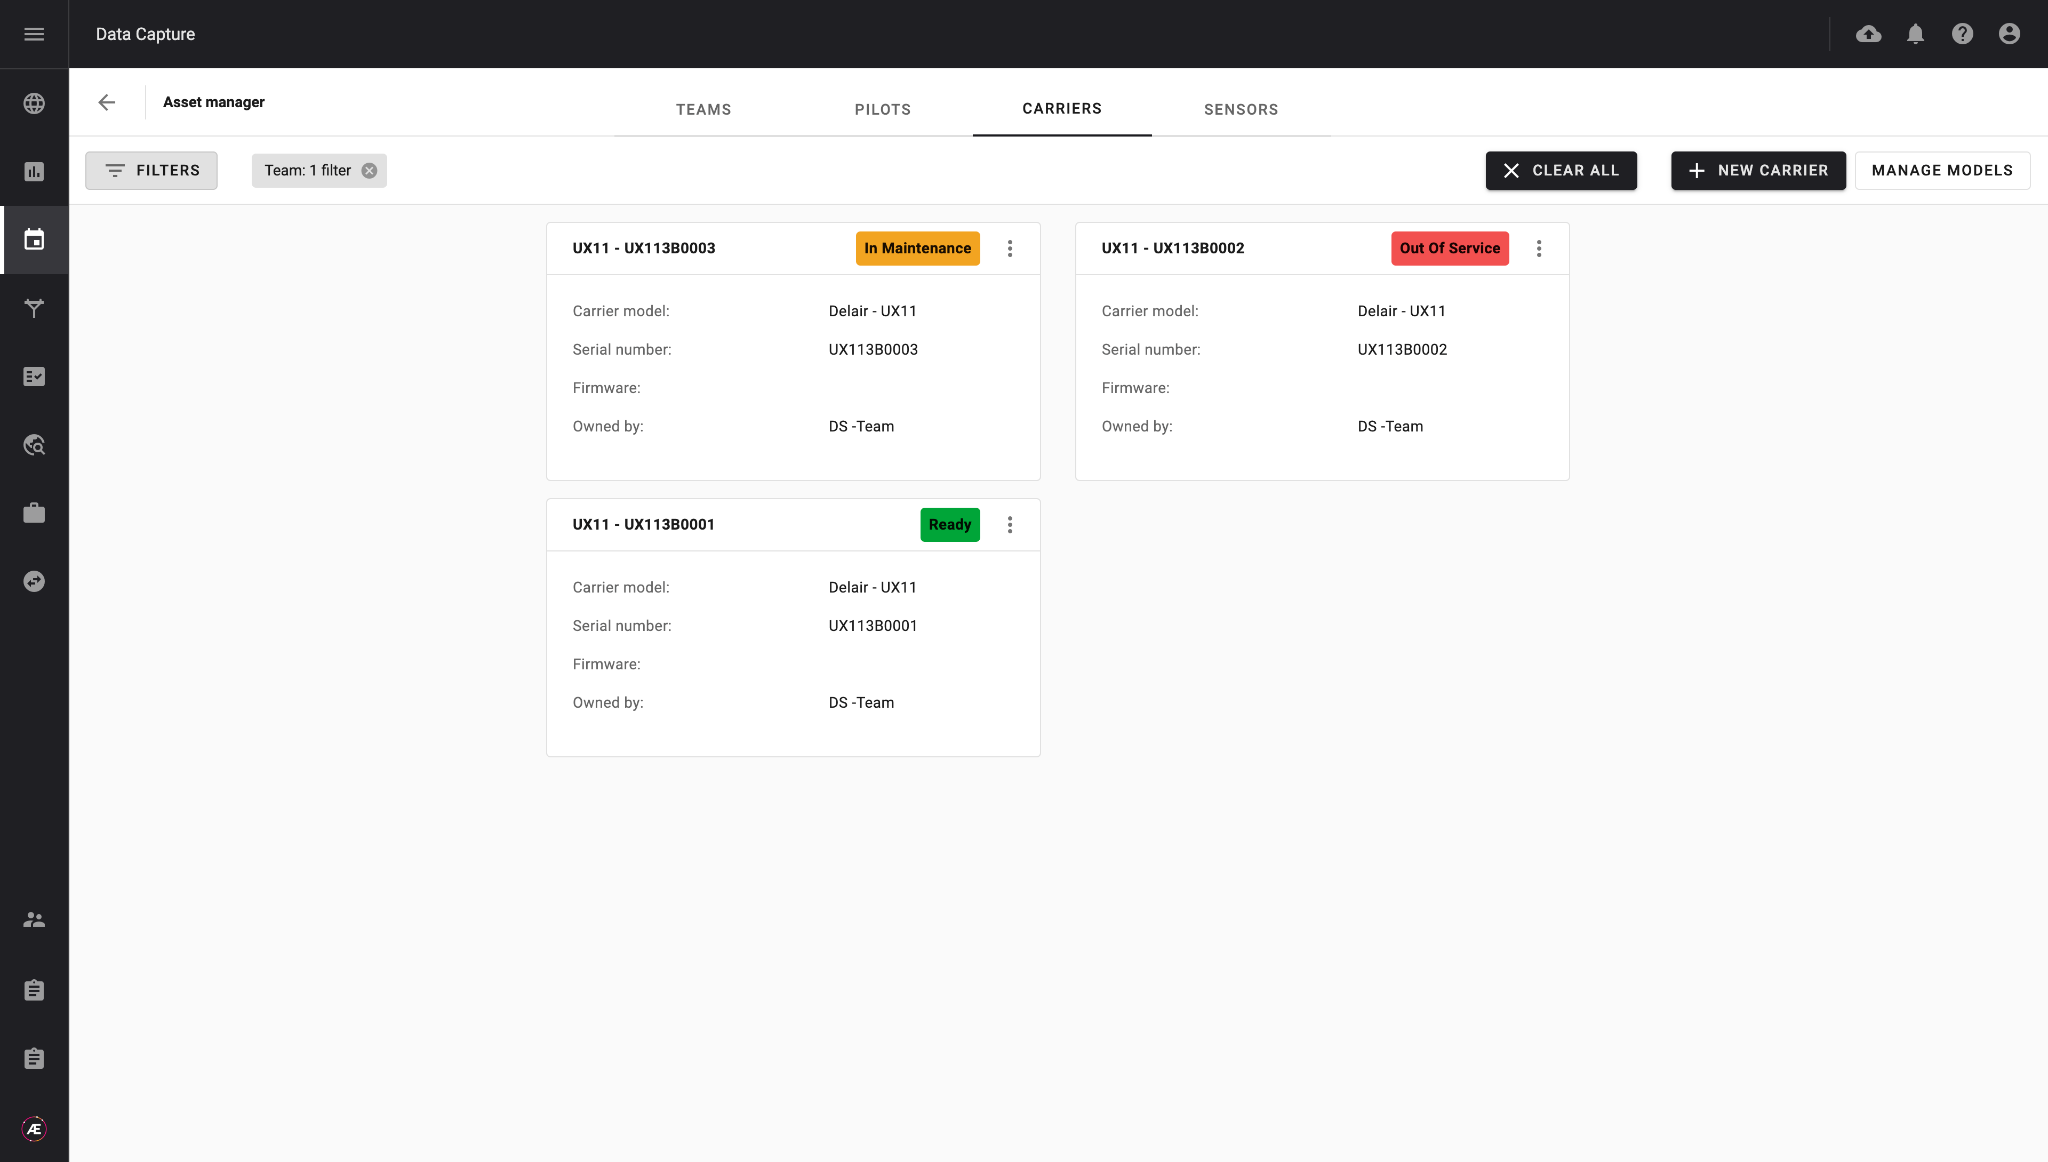
For each team of operators, configure the respective carriers and sensors they have in the data collection module. Operators can indicate whether their equipment is operational or not, allowing detailed knowledge of the resources available for the protocols to be planned.
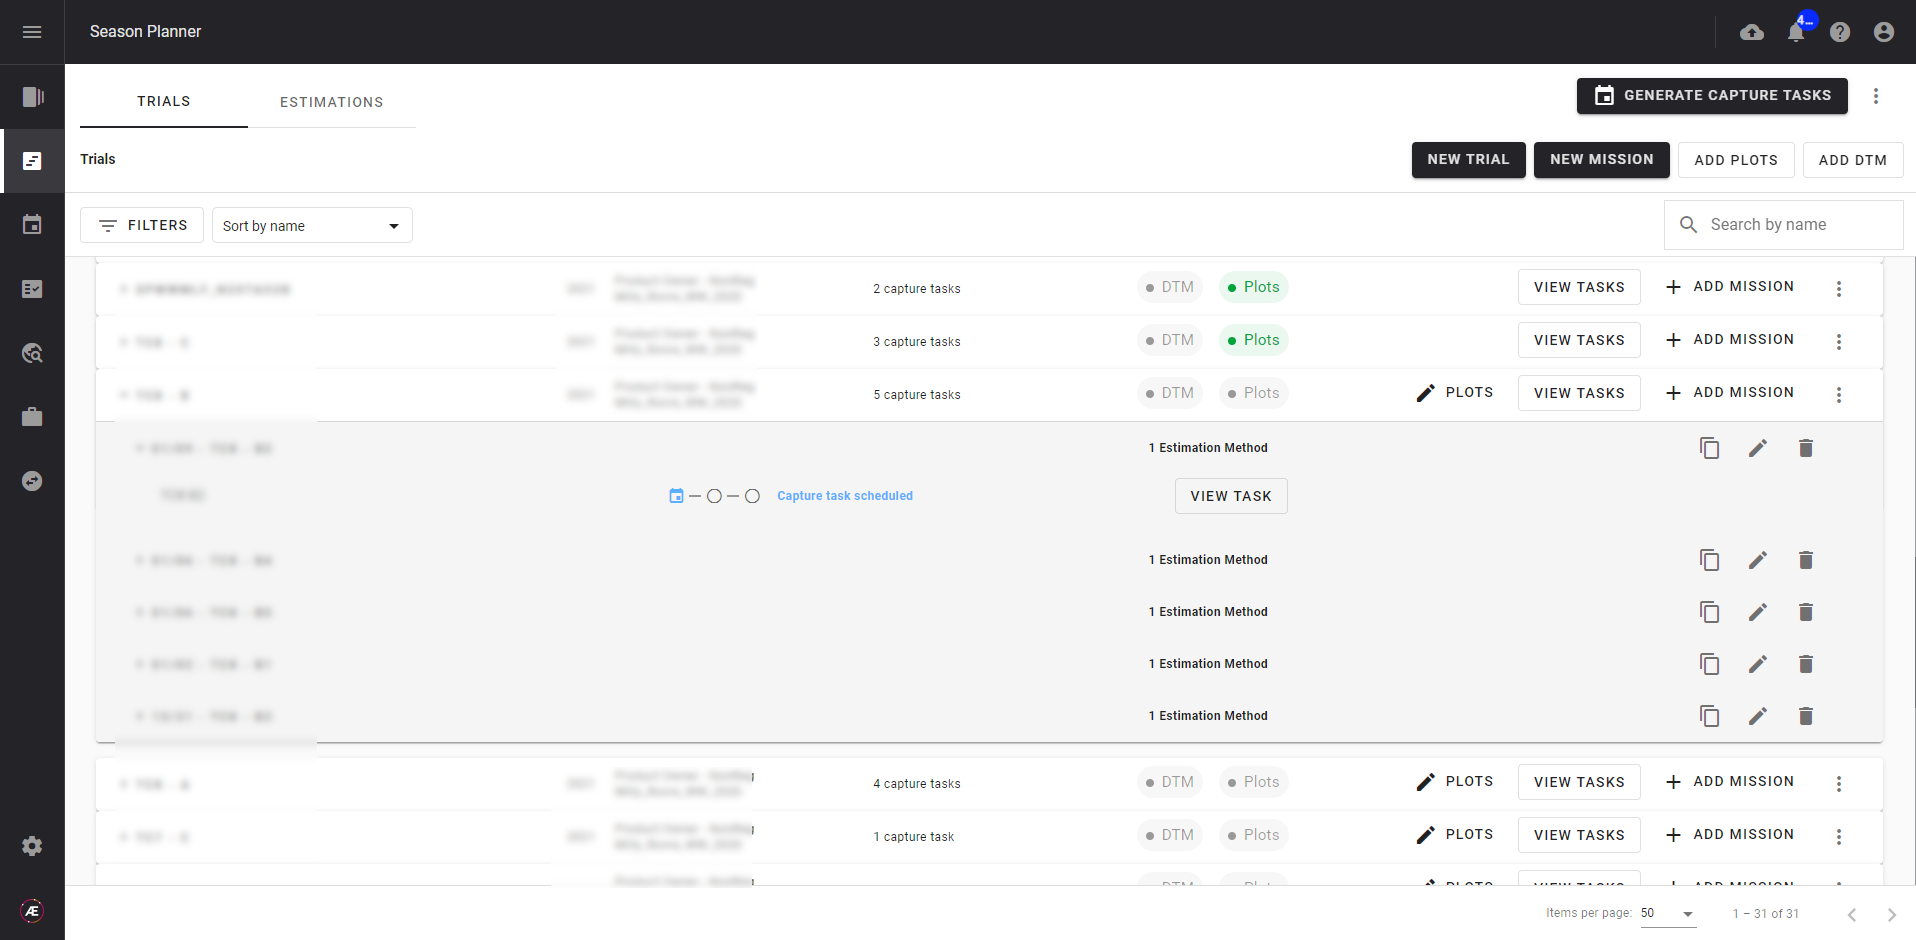
2.3 Trials and Missions Creation
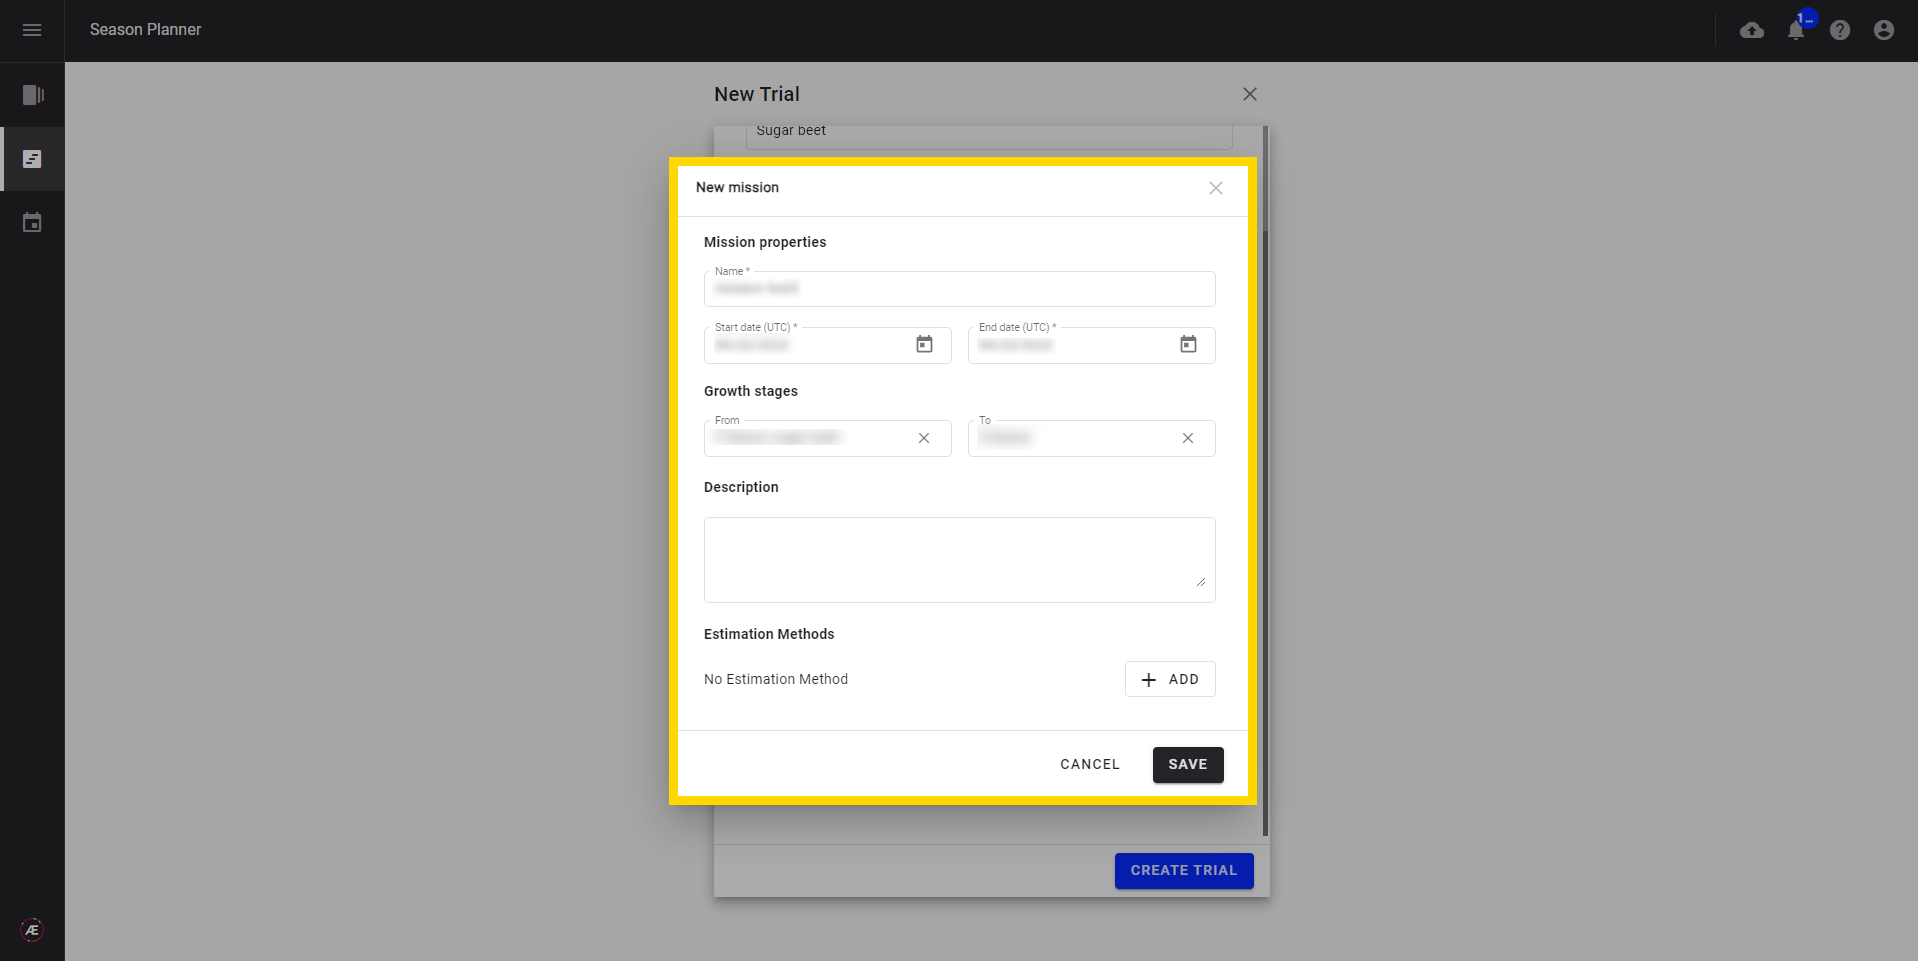
Divide your fields into trials with specific protocols. A trial represents an area where you conduct the same experiment. It can be a field or part of a field. Associate your different trials to fields and schedule the data operations for the entire season.

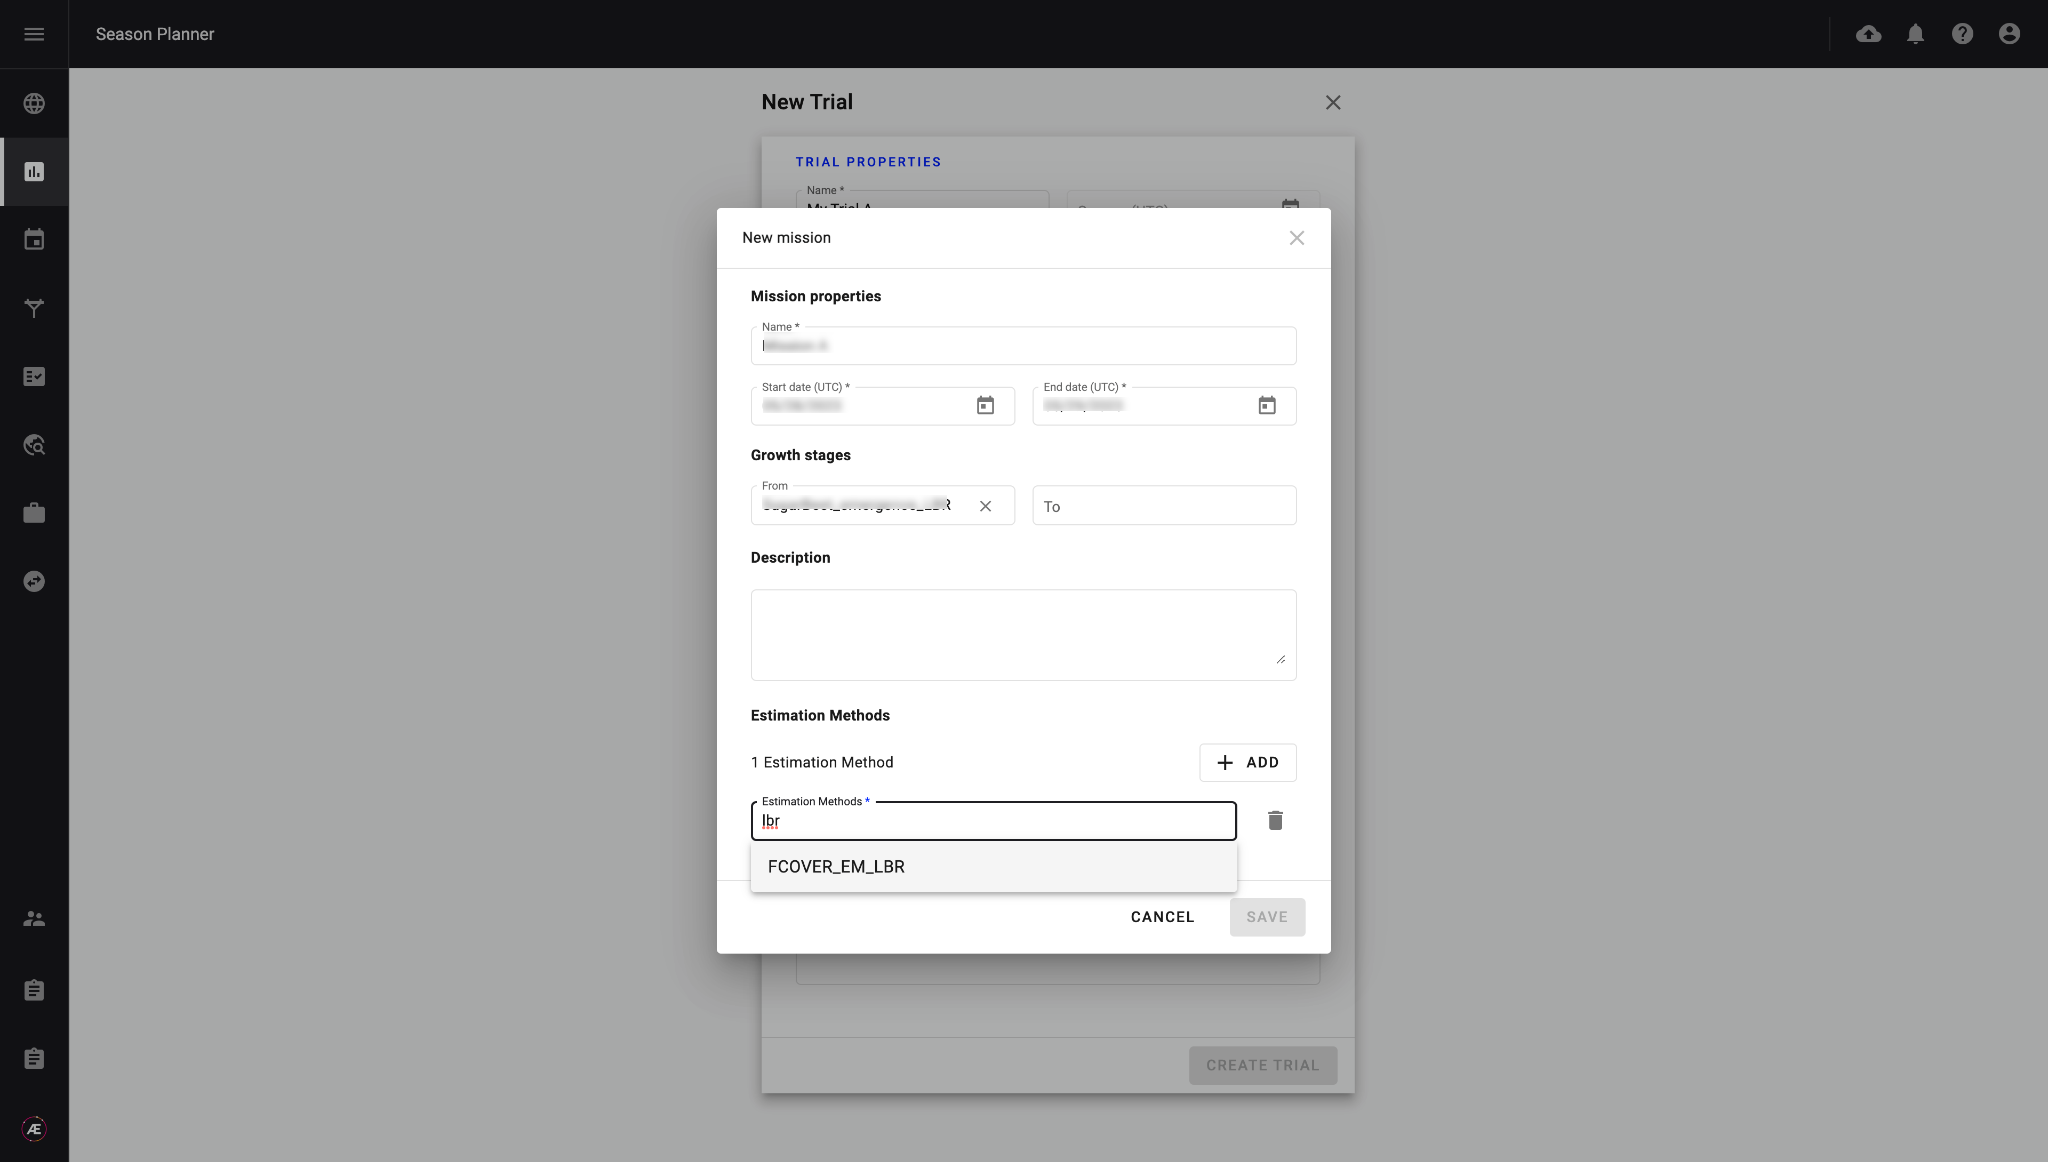
Define missions to assess traits in the trial. Describe the data collection parameters: when to collect the data (growth stage or date), the type of data to be collected, and how to collect it (which sensors and carriers to use). Select an estimation method from the configured resources (see paragraph 2.1) to assess the trait.
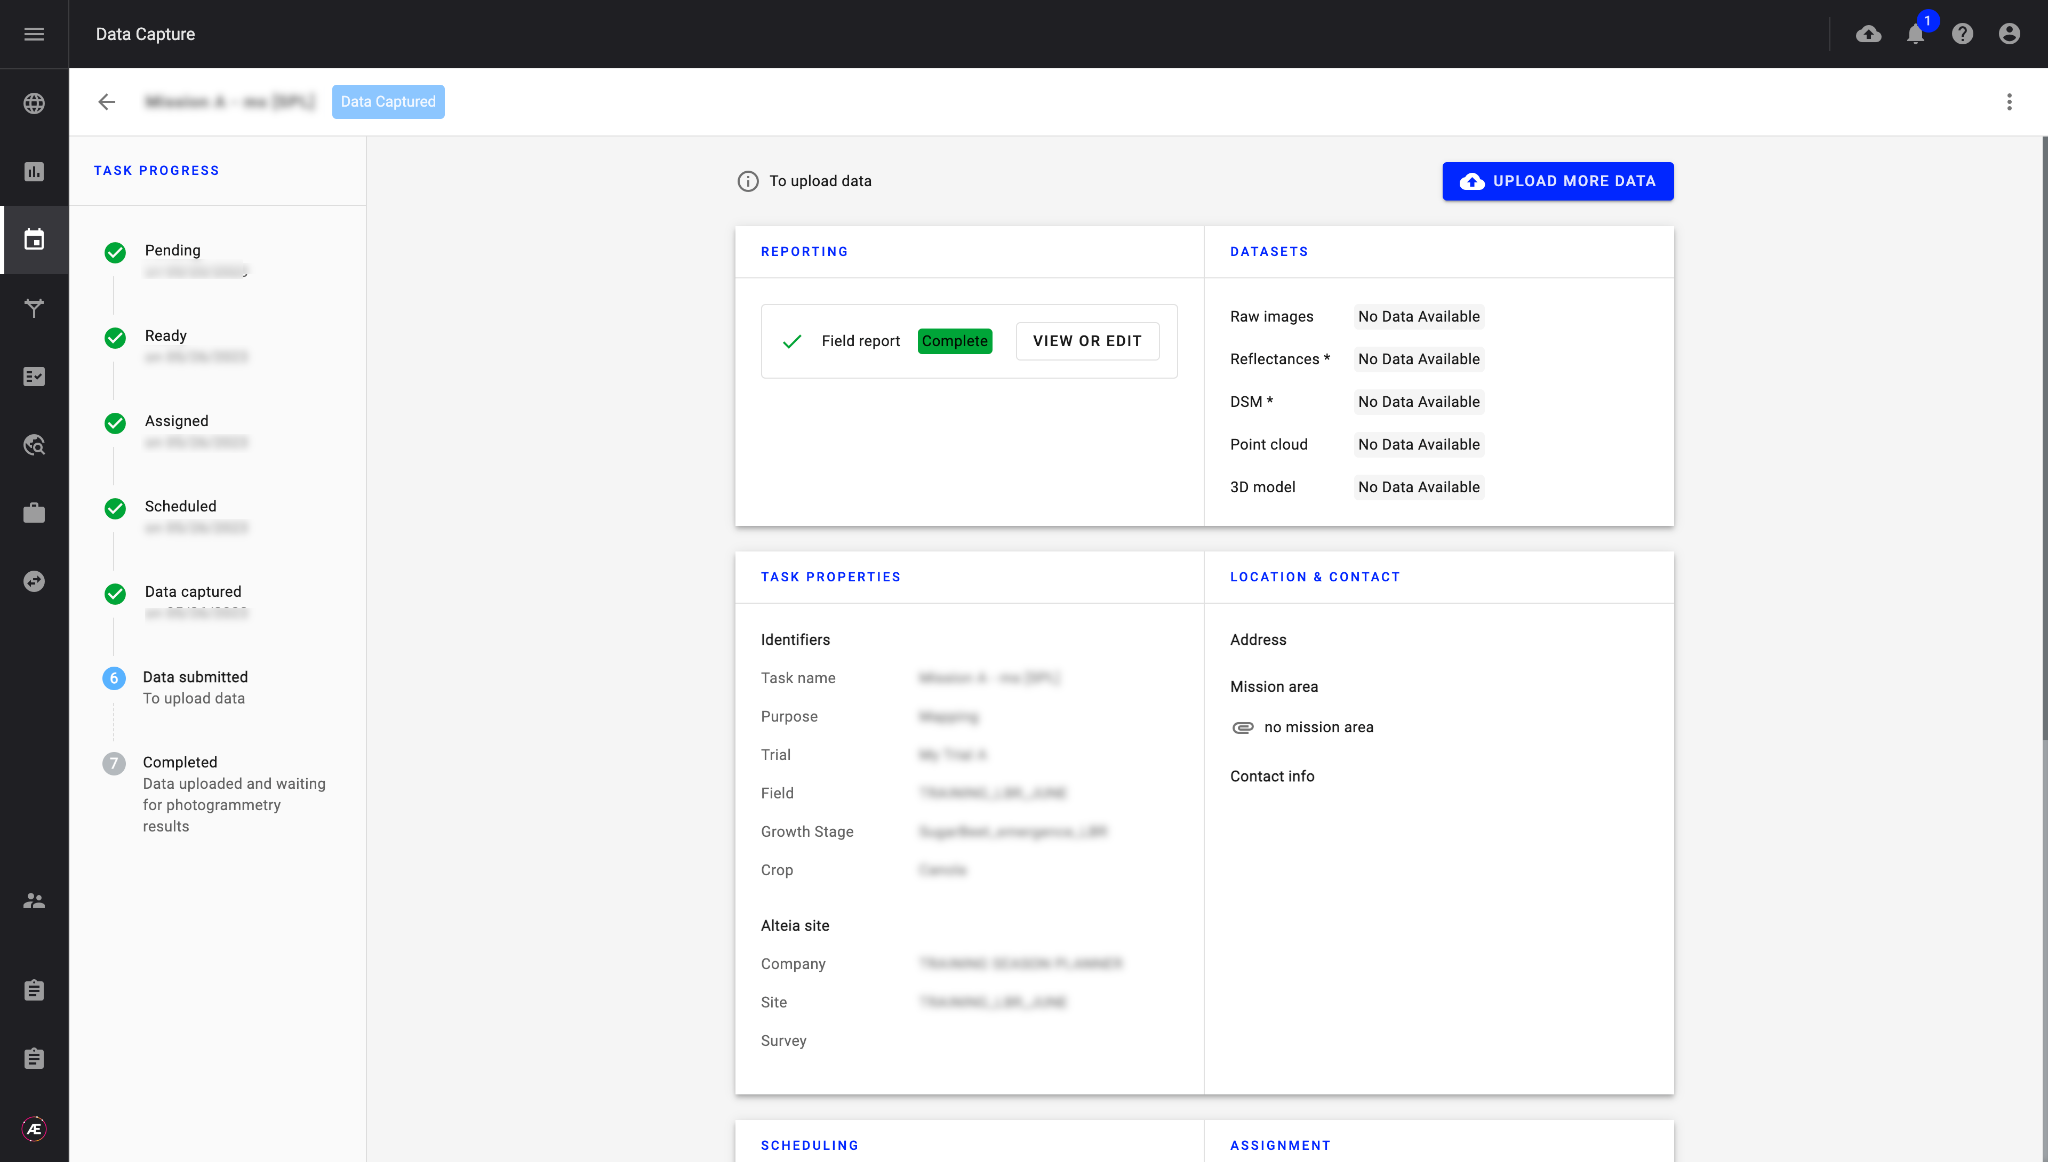
2.4 Collection Tasks Monitoring
Automatically generate data collection tasks and assign them to operators. A unique upload link is generated with each task in order to contextualize the acquired data to the correct mission. Data acquisition tasks can be monitored and their parameters refined at any time from the Data Acquisition module.
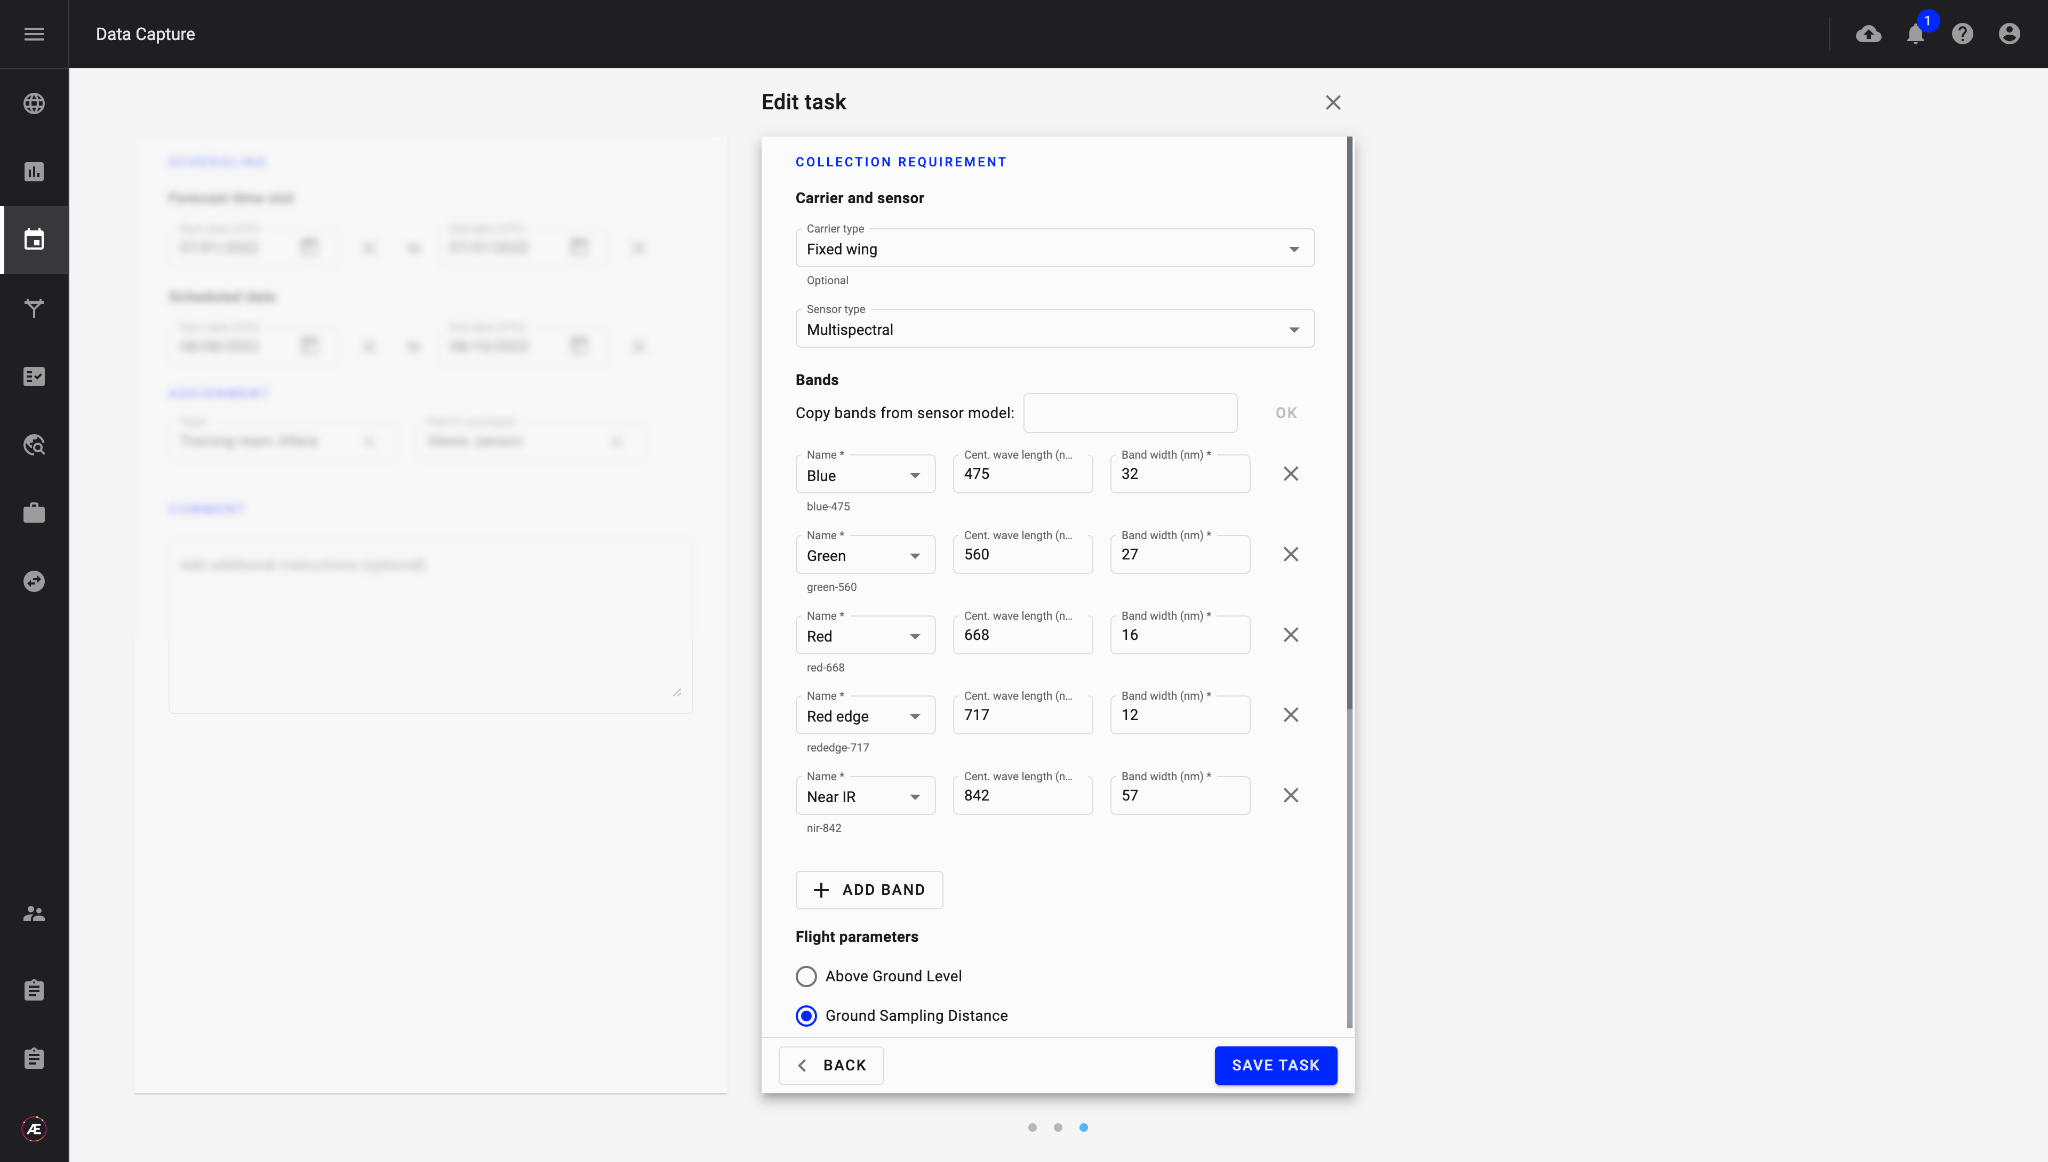
Operators can access their assigned Data Acquisition tasks to prepare their flight plans based on data collection parameters. Once the data has been collected, they complete the field report describing the actual flight conditions (carrier and sensor used, weather, actual growth stages, etc...).
2.5 Data upload and Quality Check
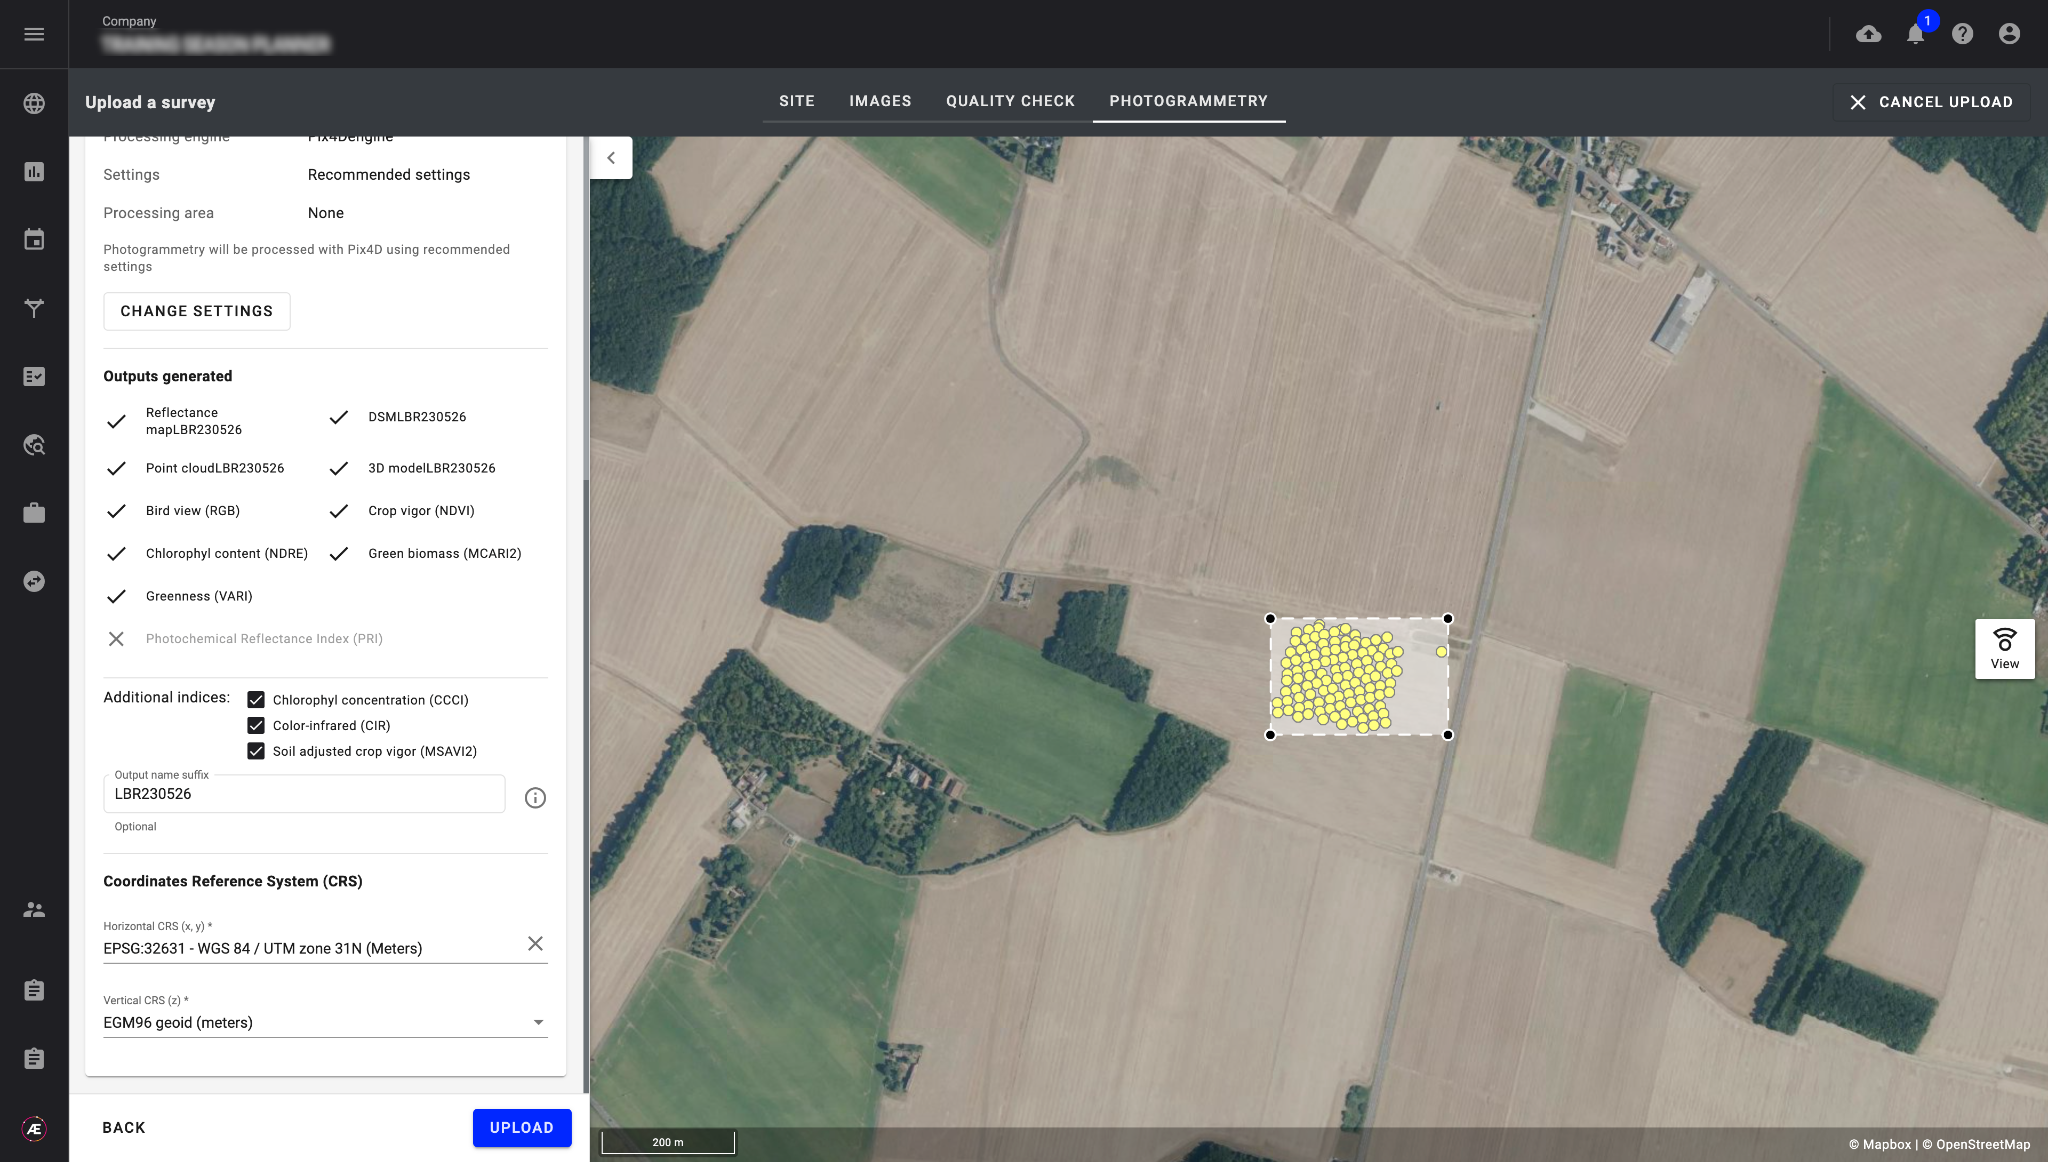
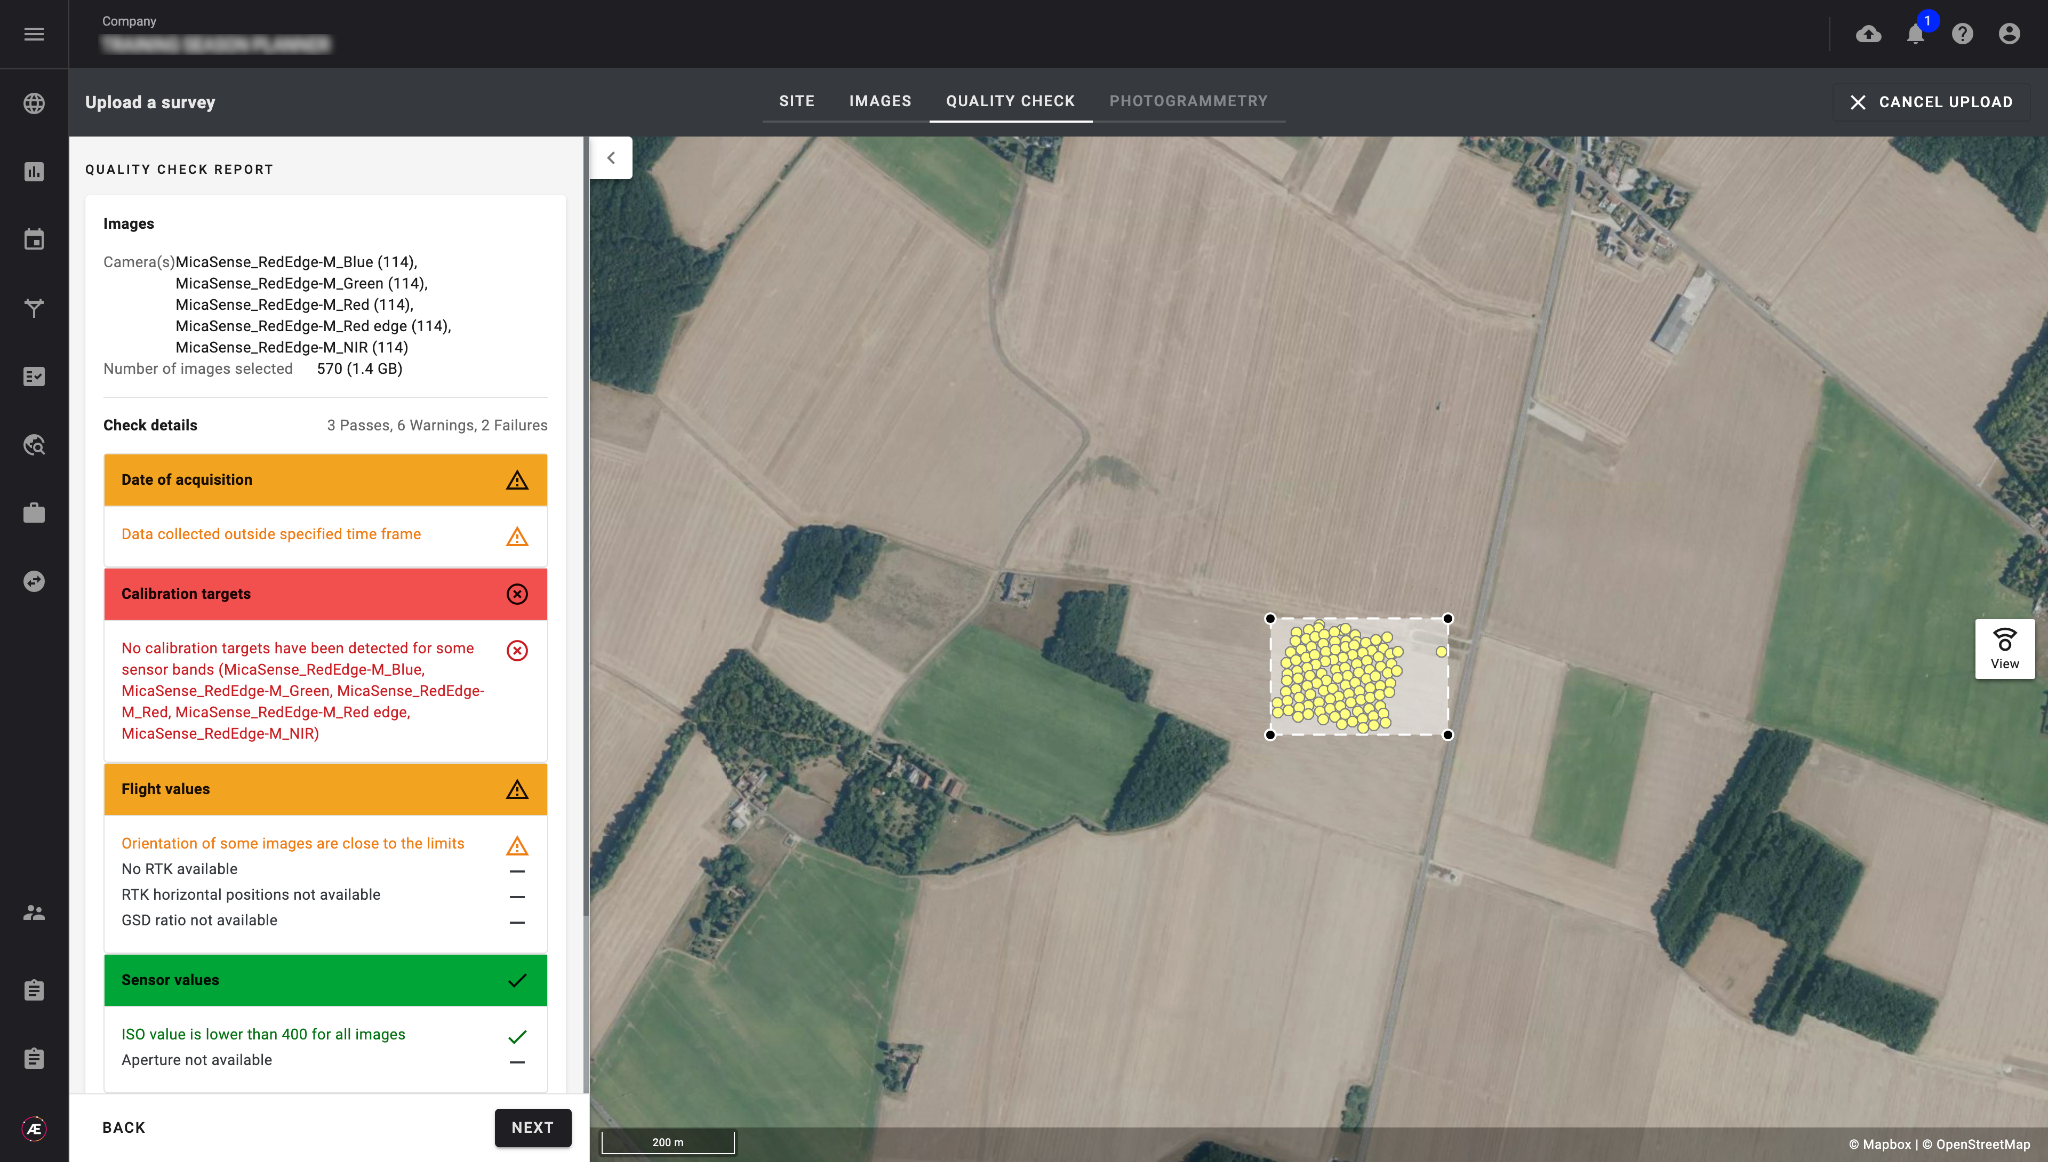
Operators upload data from their assigned tasks in the Data Acquisition module, data is automatically contextualised to the correct experiment using the unique upload link. A quality check is performed (available offline in the desktop app) to ensure that the data meets the specifications of the mission.

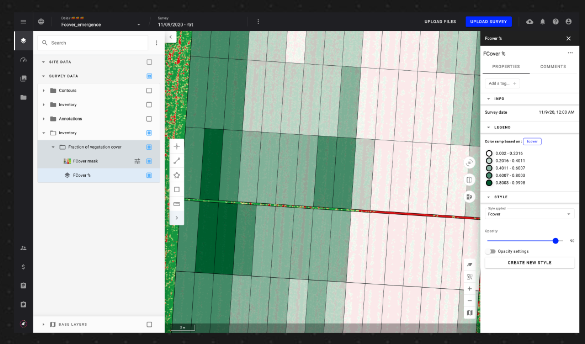
Leverage our photogrammetry pipelines as needed to generate various index maps and other files. Configure and run photogrammetry on collected data to generate index maps (RGB, NDVI, NDRE), DSM and 3D models. Analysis starts automatically when inputs are ready: configured models and report generation are triggered automatically.
3. Use Case Eample
Season Planner for Digital Phenotyping
3.1 Prerequisites
- Research station and field (company & project) created on the platform
- Stakeholders granted access
- Season Planner and Data Acquisition modules configured
- Custom or off-the-shelf analytics developed and uploaded to the Season Planner
3.2 Results
- Reduction of time spent on data management in the benefit of results analysis, high-value tasks
- Increase the statistical power of the trails database: the Season Planner allows to increase in the size of trials thanks to time and cost savings
- Standardization of traits: estimation methods frame all operations for each operator generating traits in the frame
3.3 Workflow
The experimenter defines the protocol to evaluate the performance of different corn varieties linking analyses and plant growth stages: plant count and fraction of vegetation cover (Fcover) at the 5-leaves stage, Fcover and NDVI statistics at the 10-leaves stage, plant height at the tassel stage and stay green at the senescence stage.
The experimenter assigns easily the collection tasks to the right operators and shares the collection protocols with them ensuring the quality of the images. It gives the experimenter an instant view of all the pending tasks and an easy way to interact with different service providers across projects.
The operator collects the data and then uploads it to the platform, where an automated quality check is performed. The experimenter can take advantage of the huge repeatability of the process, for different locations, scored in the same way and in a low amount of time.
The experimenter recovers the traits assessed to determine visually or by creating dashboards of the best-performing corn varieties. These outputs help prioritize the breeding pipe.