

Plant Height
1. Description
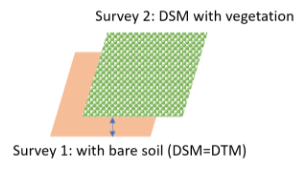
The "Plant Height" analytics automatically estimates plant height for field and microplot. The calculation can be done in two ways.
- The first is by subtracting a “survey 1 DSM with bare soil” from “survey 2 DSM with vegetation”.
- The second is by subtracting an “Estimated Terrain Elevation (DTM)” from a “survey DSM with vegetation”.
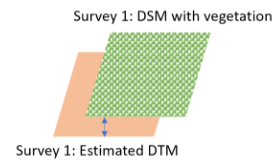
Both methods are explained below.
2. Inputs
- Required inputs for the "plant height for field trial" analytic are:
Required Inputs Description Digital Surface Model (DSM) Provided through the photogrammetry process DSM from bare soil survey (DTM) Can be an estimated DTM from the Bare Soil Model Estimation analytics. If the bare soil model estimation is used, areas of bare soil must be visible in the survey, such as alleys or tracks, to estimate the DTM. Microplots vector Can come from either the Microplot Digitization or can be imported into Aether. Optional Inputs Description Deliverables suffix Minimum height Minimum plant height to be used in the statistics computation (plants should be taller than 30cm) Maximum height Maximum plant height to be used in the statistics computation - Required inputs for the "plant height for production field and plantation/forestry" analytic are:
Required Inputs Description Digital Surface Model (DSM) Provided through the photogrammetry process DSM from bare soil survey (DTM) Can be an estimated DTM from the Bare Soil Model Estimation analytic. If the bare soil model estimation is used, areas of bare soil must be visible in the survey, such as alleys or tracks, to estimate the DTM. Field Boundaries Read more at Field Boundaries Creation. Optional Inputs Description Grid size Deliverables suffix Minimum height Minimum plant height to be used in the statistics computation (plants should be taller than 30cm) Maximum height Maximum plant height to be used in the statistics computation
3. Workflow
Step 1 - From the "Analytics" tab, search and select "Plant height for microplot" or "Plant height for field" in the "VEGETATION ASSESSMENT" section, and click on "LAUNCH".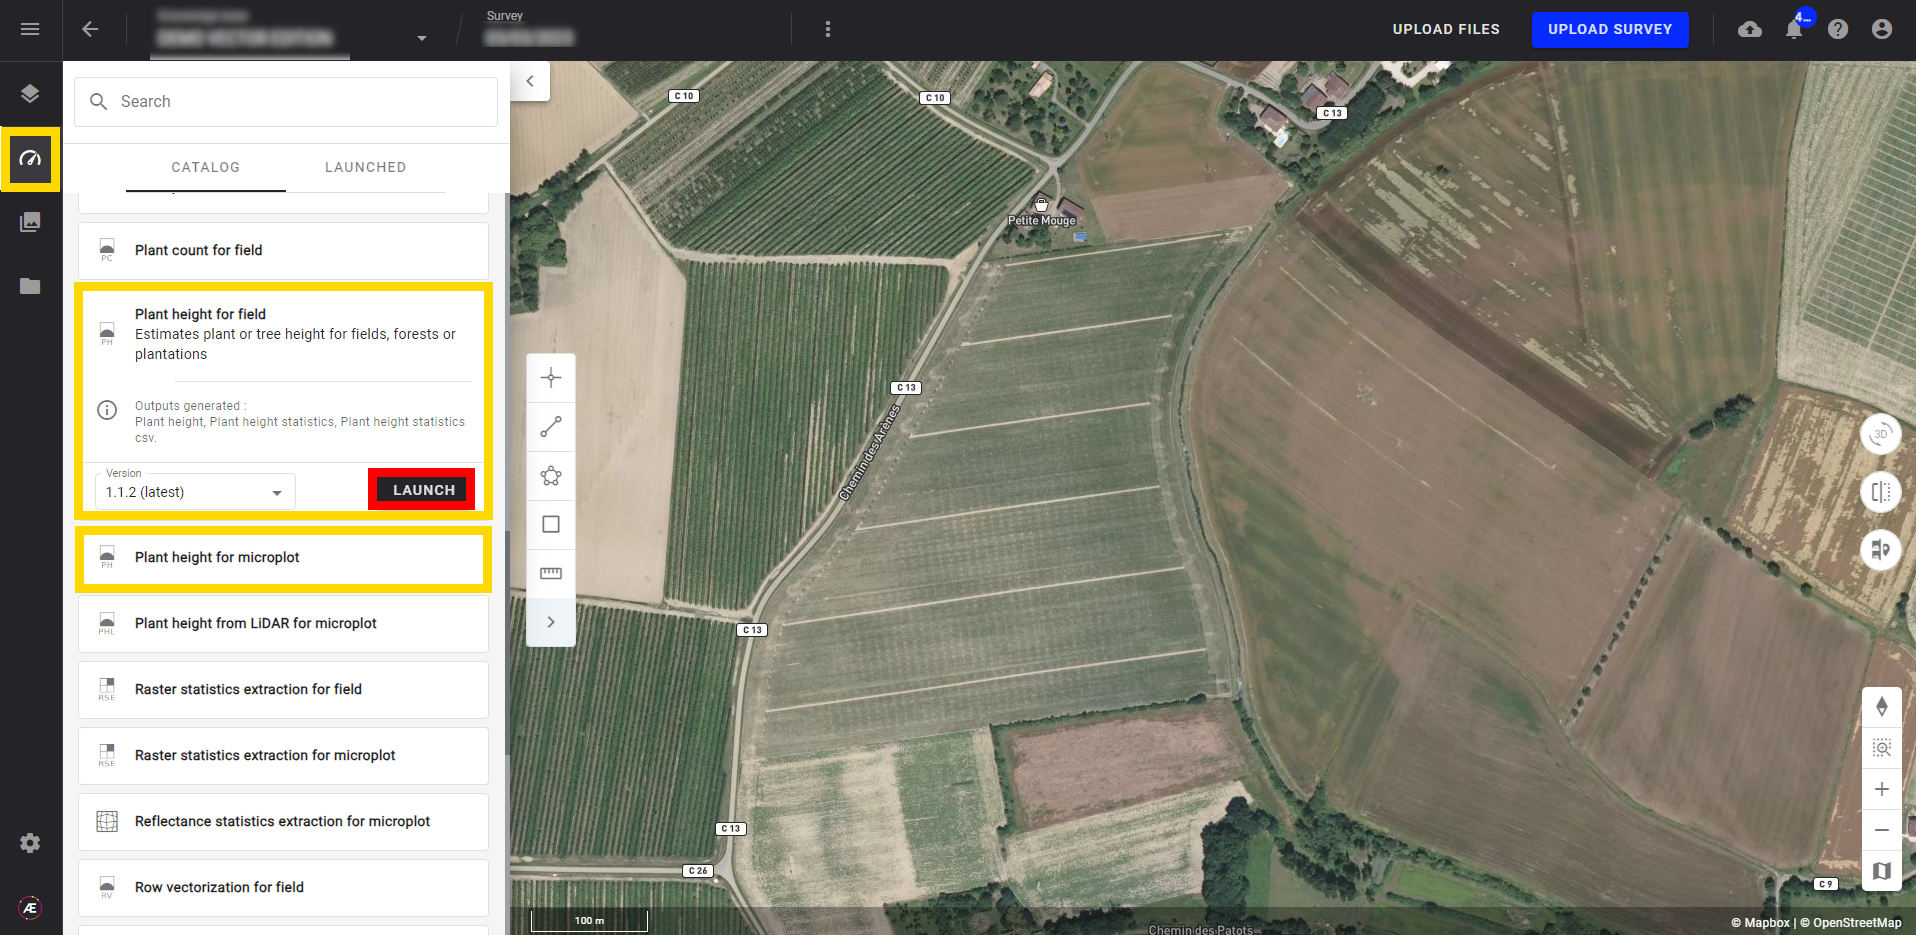
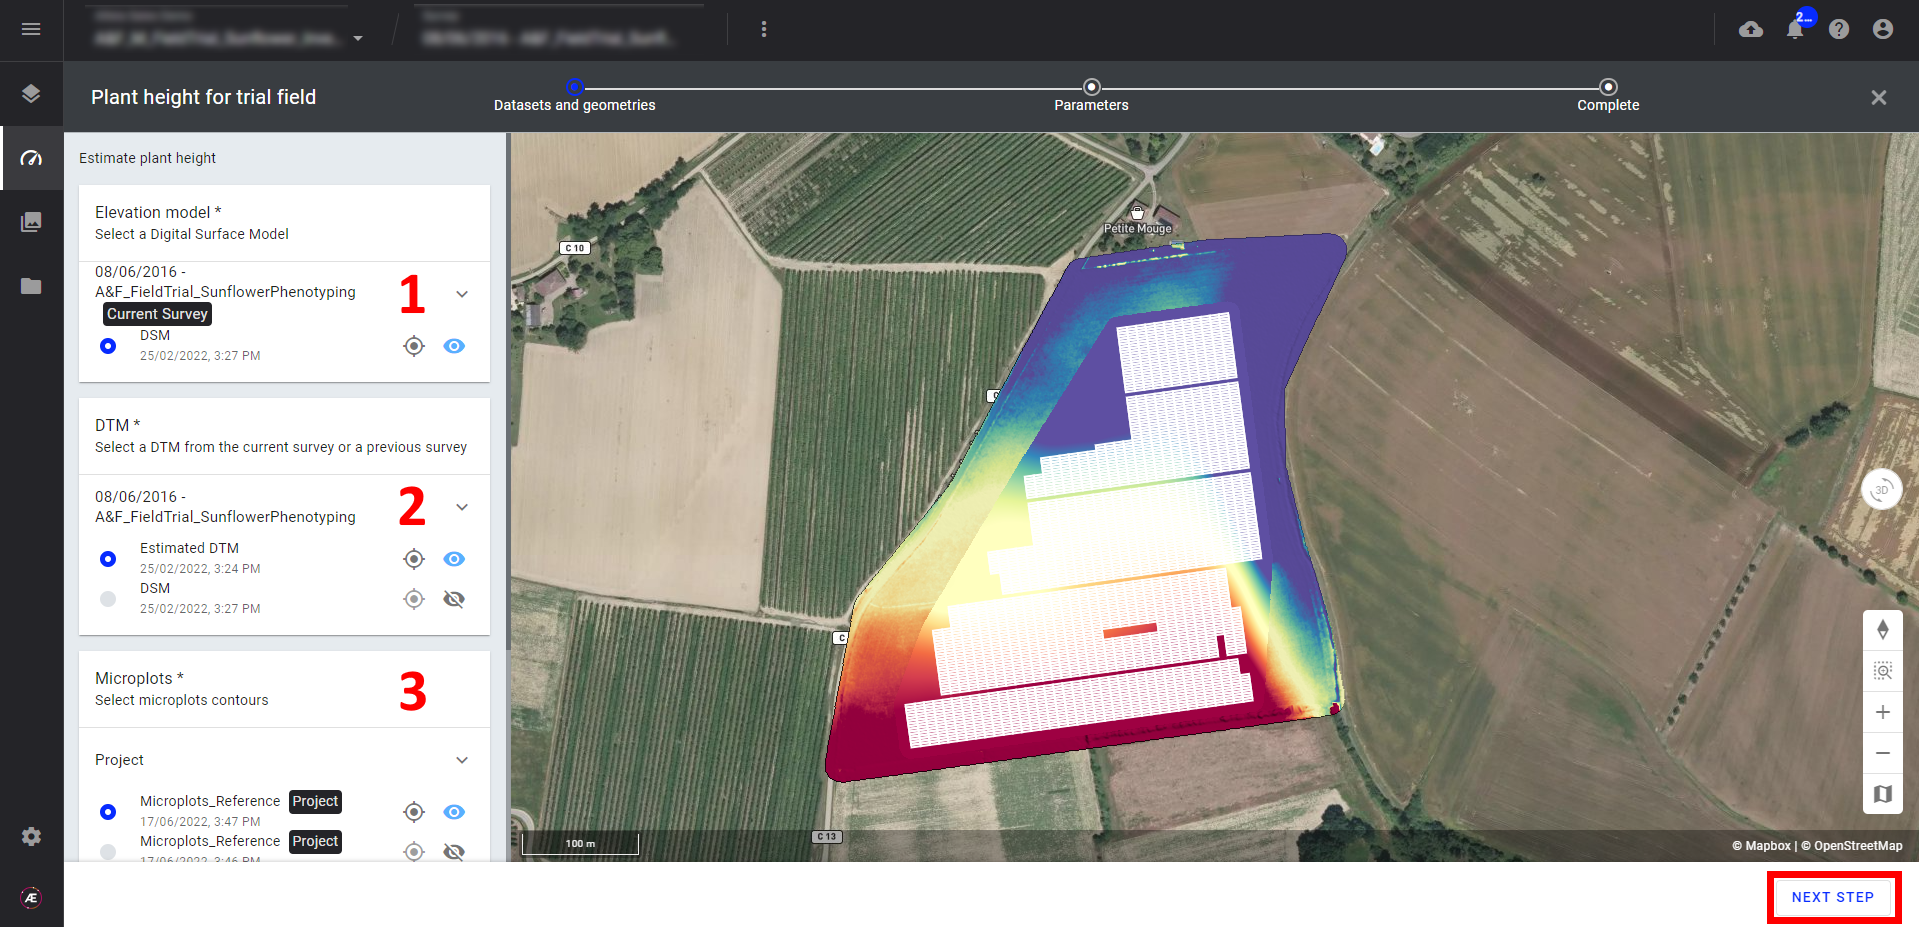
Step 2 - Select the DSM of the survey in which you want to measure the height (1).
Step 3 - Select the DTM (DSM) coming from a bare soil acquisition or generated by the Bare soil model estimation task (see Bare Soil Model Estimation) (2).
Step 4 - Depending on the type of field, select the “microplot” or “field boundaries” vector (3).
Step 5 - Click on "NEXT STEP".
Step 6 - Select a grid size (in meters) [For Field analytics only] (1).
Step 7 - Add a suffix for the deliverables (optional for microplot) (2).
Step 8 - Indicate the Minimum height and Maximum height to be used in the statistics computation (optional for microplot) (3) + (4).
Step 9 - Launch the analytics.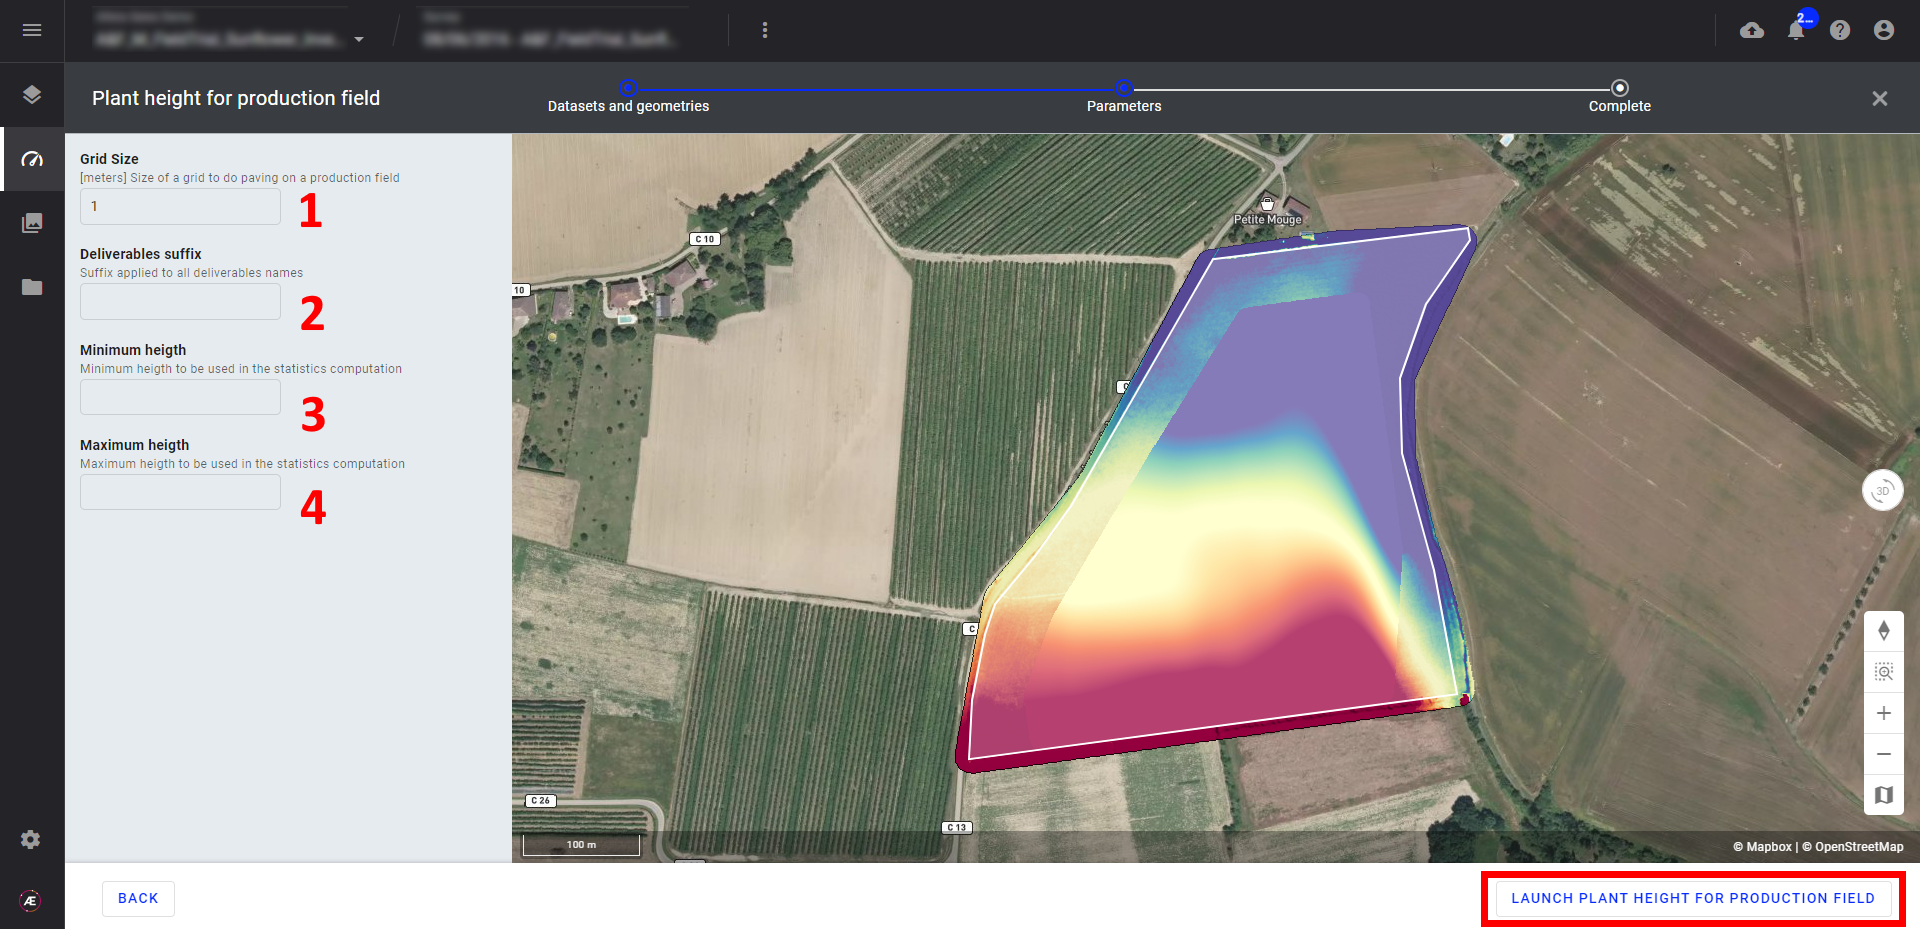
4. Results
The two main outputs for the plant height analytics are the “Plant height" map and “Plant height statistics”.
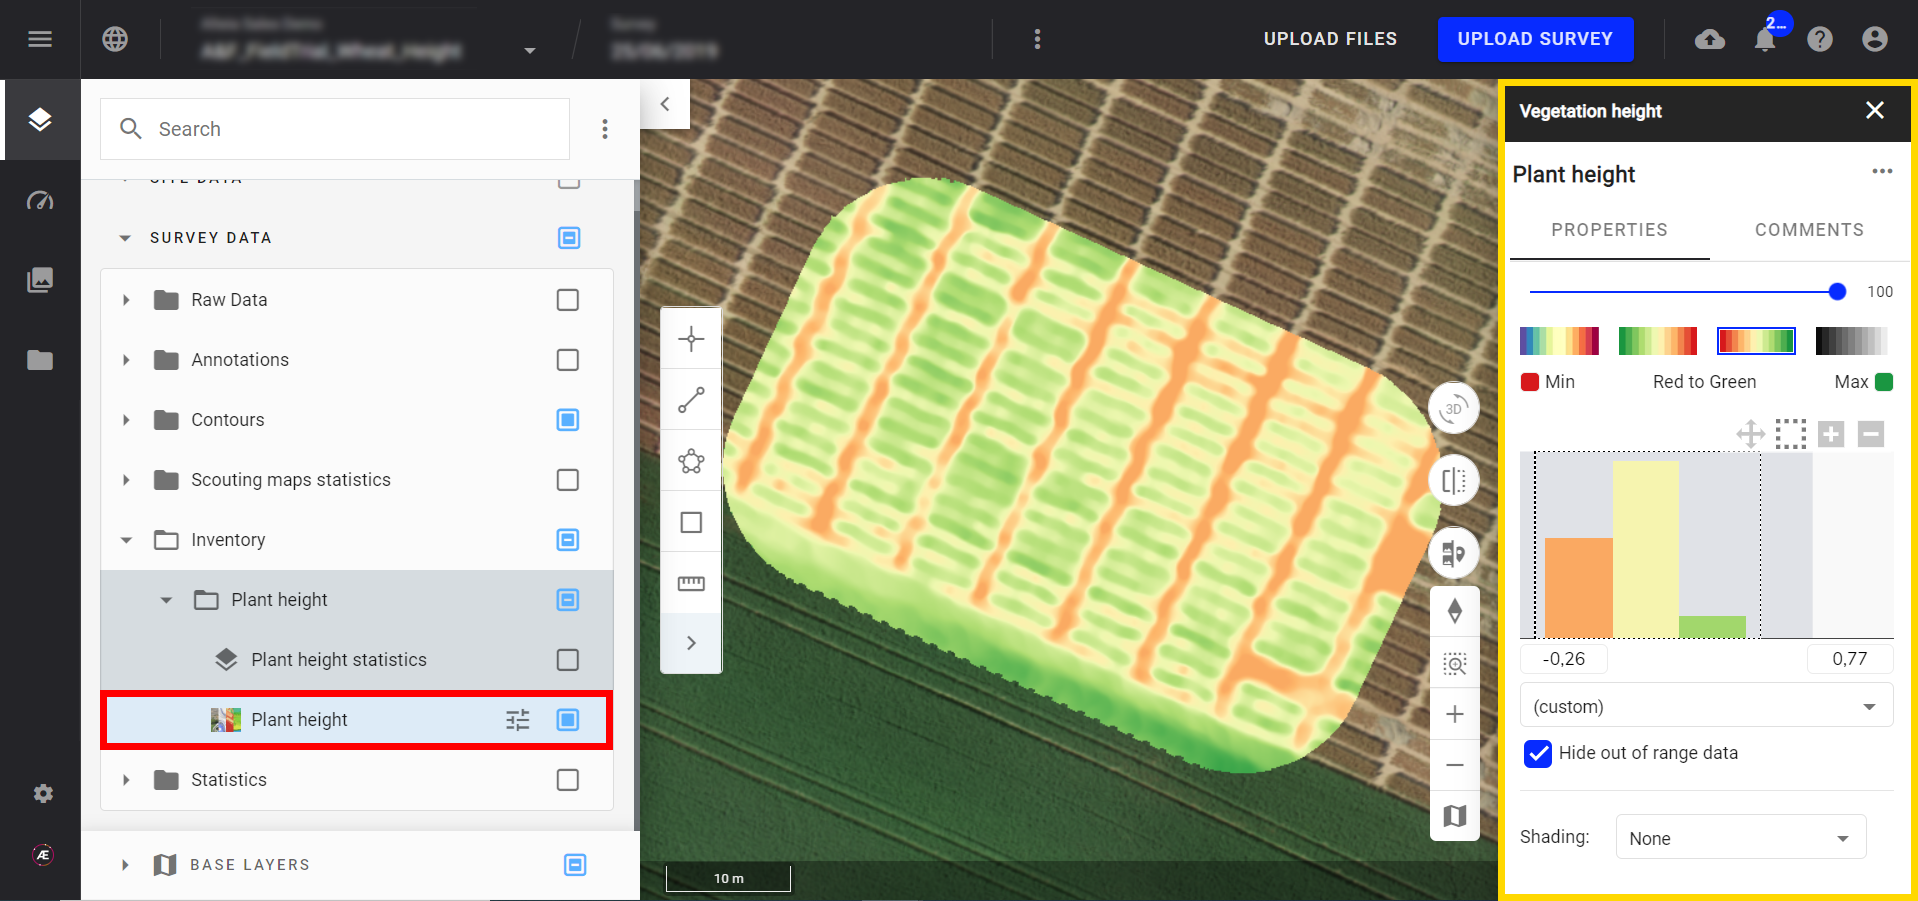
4.1 Plant Height Map
If the "Plant height" map is displayed, a map with a color scale appears: the highest vegetation is displayed in green. Low vegetation is represented as yellow or red.
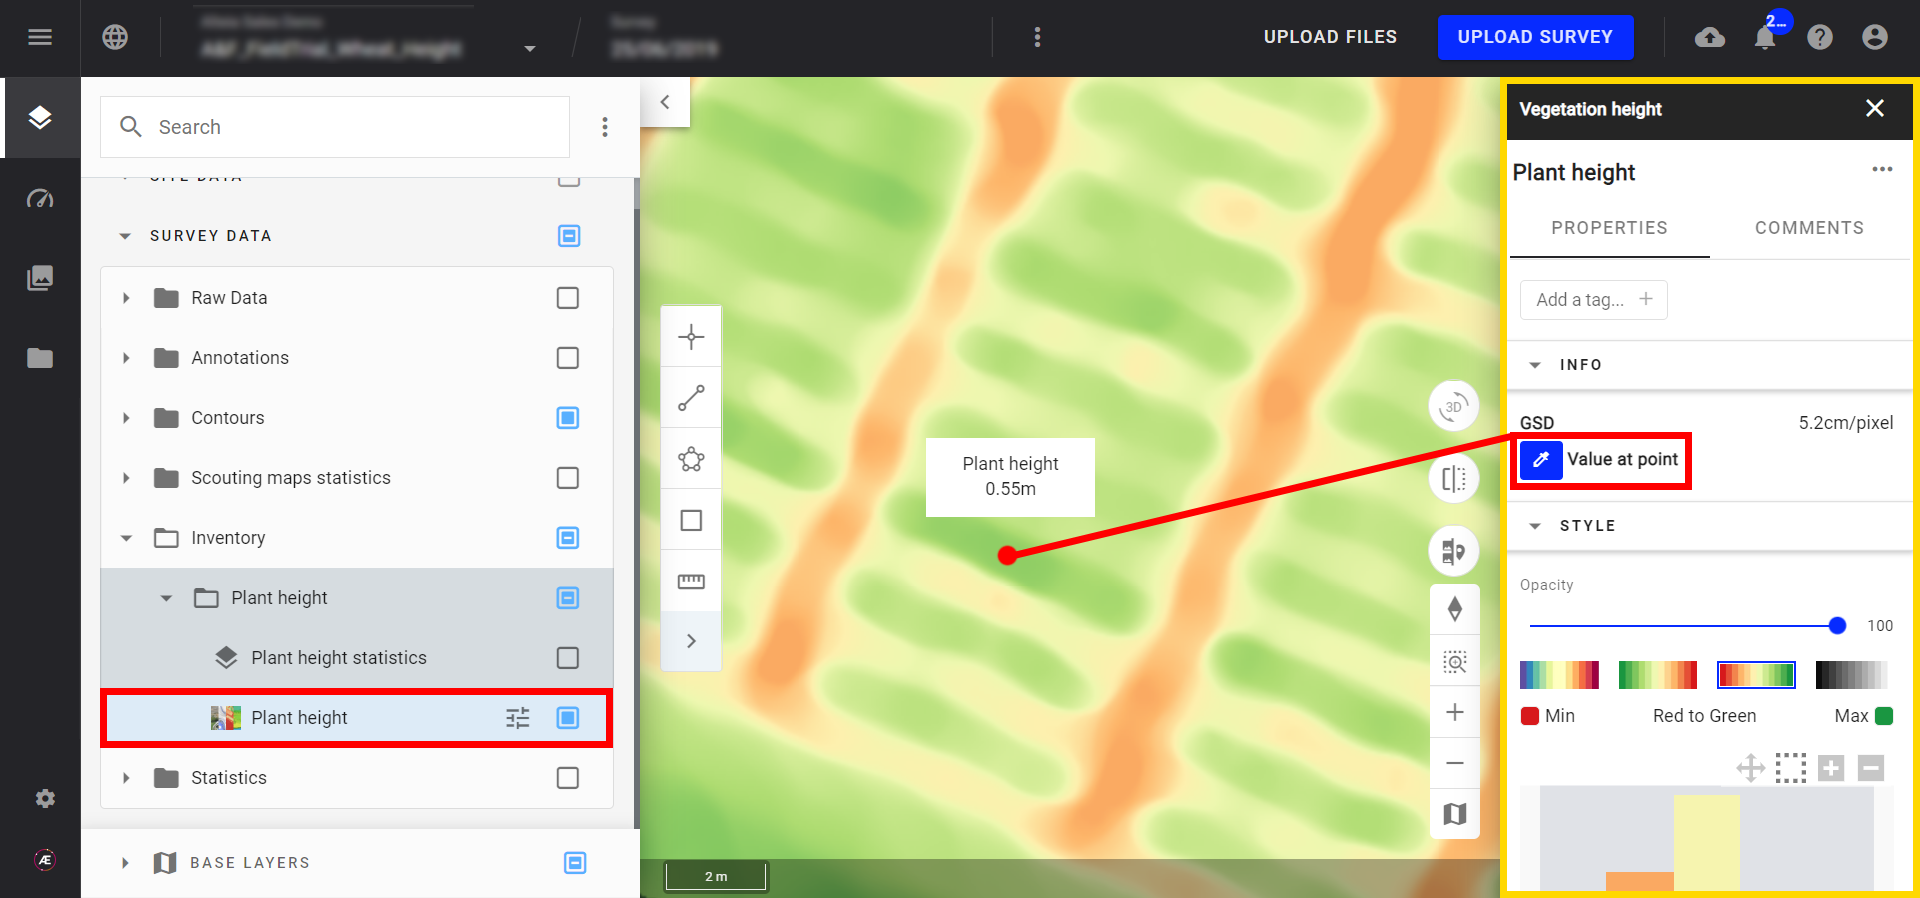
If you click on the name of the map, the right panel will appear with advanced visualization features:
- “Value at point”: gives the vegetation height in a specific location of the field.
- Color chart option
- Plant height distribution:
Height value distributions can be displayed with these modes.
| Mean and standard deviation | Values are centered on the mean with 1 standard deviation discarded at each extremity |
| Absolute | All values are displayed. |
| Cumulative % cut | Lower and upper values are discarded. You can set the % of value to discard (default is +/- 3%). |
| Custom |
Select the range on which you want to display the map:
|
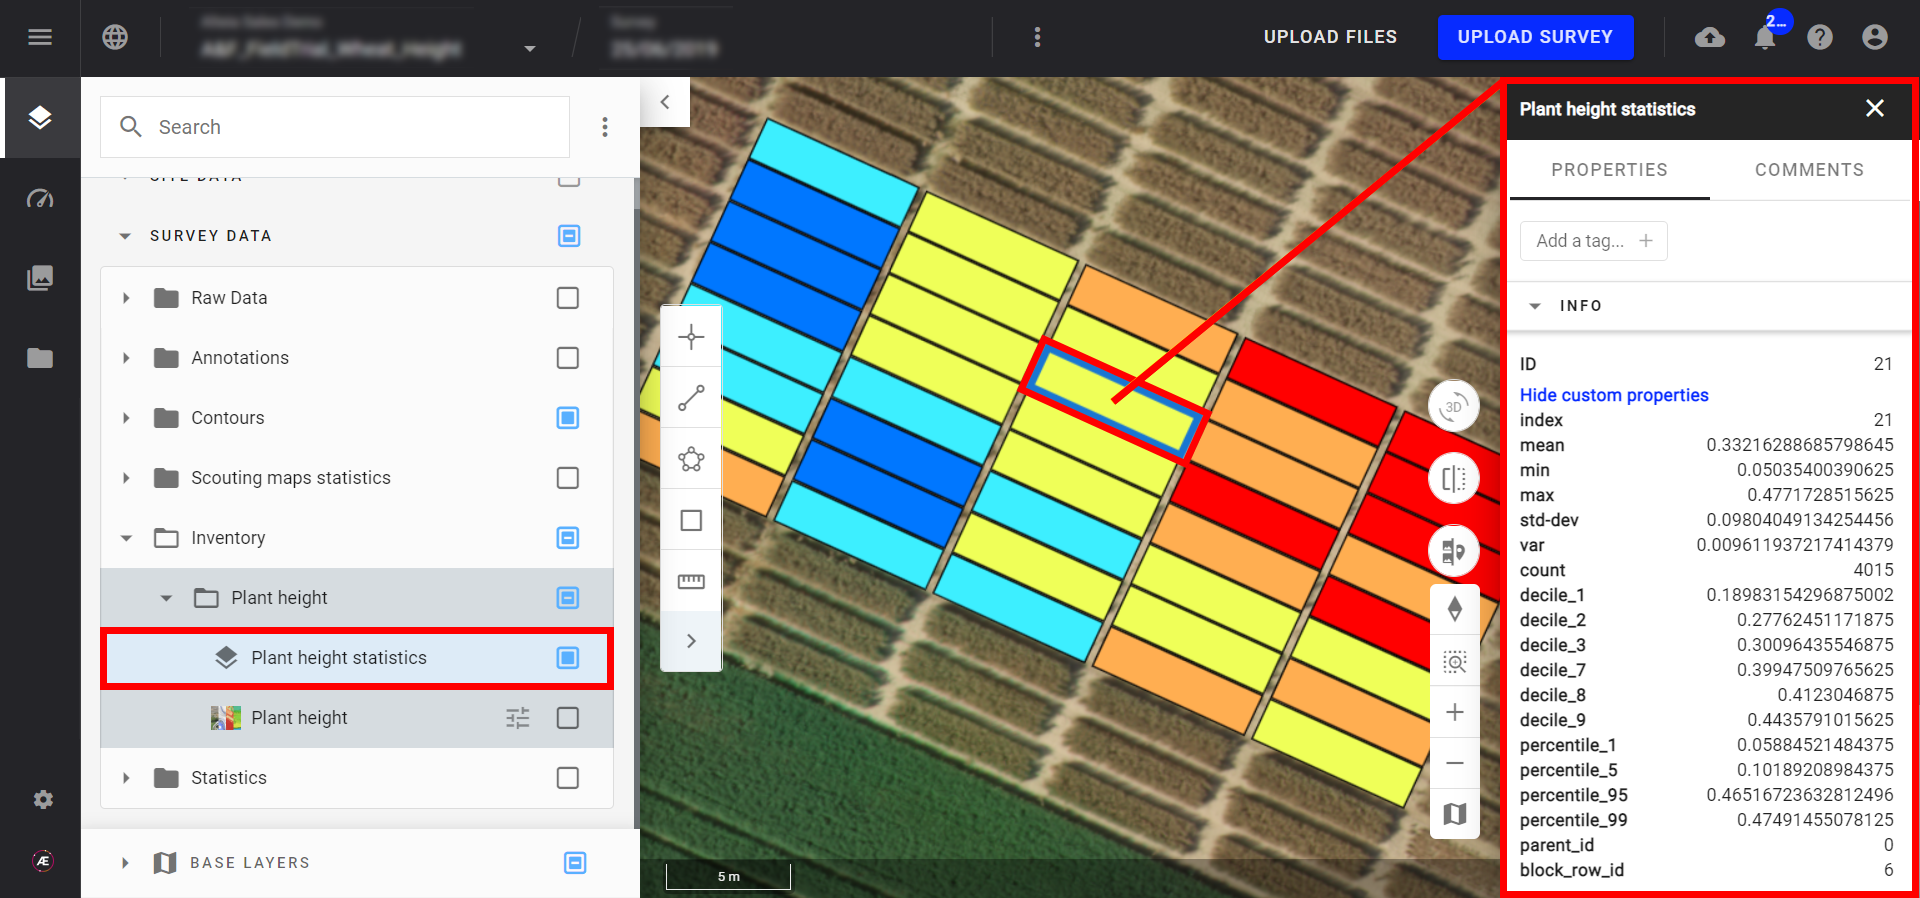
4.2 Plant Height Statistics
If the "Plant height statistics" map is displayed, the microplot or field vector appears.
- Different styles are available by default: mean, max...
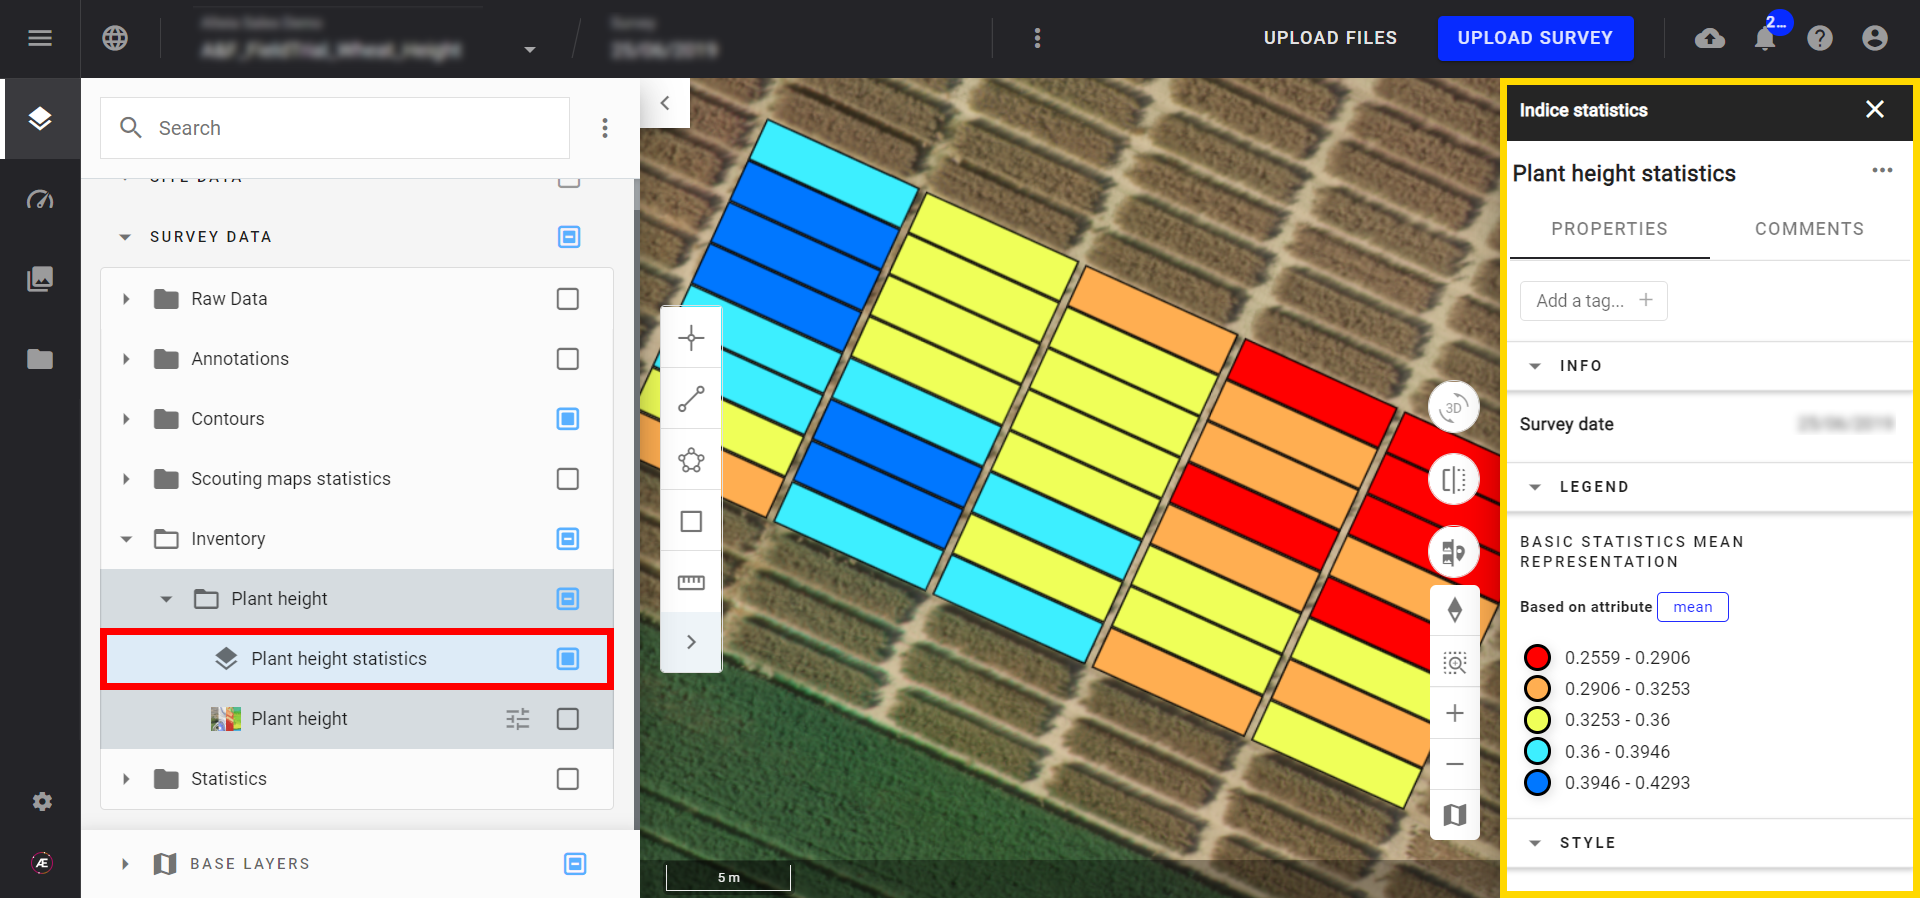
If needed you can customize the styles (see Vector Layers Styling).
- Click on a specific microplot or tile to view the statistics associated with this microplot or tile.
5. Deliverables
The deliverables are available in the below formats with their corresponding attributes. Note that for all attributes the unit of measurement is in meters.
5.1 For Field Trial
5.1.1 Plant height statistics + suffix .csv
This deliverable is a .csv file with plant height statistics at a microplot or tile level for a production field. Below are the attributes from the input vector file (parent_id, block_plot_id, etc.) if the vector file is generated from Aether.
- max-clipped_plant_height_[ID_PROJECT]-b1: Maximum plant height
- mean-clipped_plant_height_[ID_PROJECT]-b1: Average plant height
- median-clipped_plant_height_[ID_PROJECT]-b1: Median
- min-clipped_plant_height_[ID_PROJECT]-b1: Minimum plant height
- count-clipped_plant_height_[ID_PROJECT]-b1: Number of pixel in the polygon
- std-dev-clipped_plant_height_[ID_PROJECT]-b1: Standard deviation
- var-clipped_plant_height_[ID_PROJECT]-b1: Variance
- decile_1-clipped_plant_height_[ID_PROJECT]-b1: decile 1
- decile_2-clipped_plant_height_[ID_PROJECT]-b1: decile 2
- decile_3-clipped_plant_height_[ID_PROJECT]-b1: decile 3
- decile_7-clipped_plant_height_[ID_PROJECT]-b1: decile 7
- decile_8-clipped_plant_height_[ID_PROJECT]-b1: decile 8
- decile_9-clipped_plant_height_[ID_PROJECT]-b1: decile 9
- percentile_1-clipped_plant_height_[ID_PROJECT]-b1: percentile 1
- percentile_5-clipped_plant_height_[ID_PROJECT]-b1: percentile 5
- percentile_95-clipped_plant_height_[ID_PROJECT]-b1: percentile 95
- percentile_99-clipped_plant_height_[ID_PROJECT]-b1: percentile 99
5.1.2 Plant height statistics + suffix .geojson
This deliverable is a vector file with plant height statistics at a microplot or tile level for a production field. Below are the attributes from the input vector file (parent_id, block_plot_id, etc.) if the vector file is generated from Aether.
- max: Maximum plant height
- mean: Average plant height
- median: Median
- min: Minimum plant height
- count: Number of pixel in the polygon
- std-dev: Standard deviation
- var: Variance
- decile_1: decile 1
- decile_2: decile 2
- decile_3: decile 3
- decile_7: decile 7
- decile_8: decile 8
- decile_9: decile 9
- percentile_1: percentile 1
- percentile_5: percentile 5
- percentile_95: percentile 95
- percentile_99: percentile 99
5.1.3 Plant height + suffix .tiff
This deliverable is a raster file with plant height values at the pixel level.
5.2 For production field and plantation/forestry
For production field and plantation/forestry, the plant height statistics .csv or .geojson output has the same attributes as the above, plus the following:
- id_x: column number
- id_y: row number
The Plant Height + suffix .tiff is also identical to 5.1.3.
