• Contact Us close
  • Home
  • Welcome to Alteia keyboard_arrow_right
    Getting Started keyboard_arrow_right
    Quick Guide to the Alteia Software Interface Notification Center Alteia Glossary
    Platform Administration keyboard_arrow_right
    System Requirements and Supported Browsers Account and User Roles Management Company Information Edition User Profile Edition Alteia's Terms of Use - October 2021
    Release Notes keyboard_arrow_right
    Release Note R2022.35 - August 30th, 2022 Release Note R2022.43 - October 25th, 2022 Release Note R2022.47 - November 22th, 2022
    Get Support keyboard_arrow_right
    Contact Support Platform Status
  • The Alteia Platform keyboard_arrow_right
    Fuse
    Build
    Deploy
  • Applications by Industry keyboard_arrow_right
    Worksite Management keyboard_arrow_right
    Site Settings for Mines & Aggregates Material Management Safety and High Walls Analytics Building Information Modeling (BIM) Solar Plant Thermal Inspection Change Map Advanced Stockpile Analytics and Stockpile Module Haul Roads Analytics
    Field Trial Analysis keyboard_arrow_right
    Microplot Designer Plant Height from RGB and Multispectral Plant Count and Emergence for Trial Field Scouting Maps Generic and Custom Scouting Maps Custom Composition Map Supported Crops for Trial Fields & Production Fields Row Vectorization Microplot Boundaries Adjustment Task Fraction of Vegetation Cover (FCover) Flowering Characterization Stay Green Plant Height from LiDAR Statistics for Trial Fields and Production Fields Agriculture and Forestry Analytics Description
    Mine Productivity Analysis keyboard_arrow_right
    Haul Roads Analytics Site Settings for Mines & Aggregates Material Management Safety and High Walls Analytics Change Map Advanced Stockpile Analytics and Stockpile Module
    Plantation and Forestry Management keyboard_arrow_right
    Supported Plantations and Forests Advanced Tree Analysis Tree Detection Grid Designer Tree Density Indicators Agriculture and Forestry Analytics Description
    Precision Agriculture keyboard_arrow_right
    Scouting Maps Generic and Custom Scouting Maps Custom Composition Map Field Boundaries Creation Supported Crops for Trial Fields & Production Fields Fraction of Vegetation Cover (FCover) Stay Green Statistics for Trial Fields and Production Fields Grid Designer Weed Management Plant Count for Production Field Emergence Characterization for Production Field Agriculture and Forestry Analytics Description
  • For Developers keyboard_arrow_right
    SDK and APIs keyboard_arrow_right
    SDK Introduction SDK Use Case Examples Custom Analytics Creation with CLI API Calls Using Alteia and YOLO to Train and Run Detection Models
US
FR
Contact Us
  • Home
  • Welcome to Alteia keyboard_arrow_right
    Getting Started keyboard_arrow_right
    Quick Guide to the Alteia Software Interface Notification Center Alteia Glossary
    Platform Administration keyboard_arrow_right
    System Requirements and Supported Browsers Account and User Roles Management Company Information Edition User Profile Edition Alteia's Terms of Use - October 2021
    Release Notes keyboard_arrow_right
    Release Note R2022.35 - August 30th, 2022 Release Note R2022.43 - October 25th, 2022 Release Note R2022.47 - November 22th, 2022
    Get Support keyboard_arrow_right
    Contact Support Platform Status
  • The Alteia Platform keyboard_arrow_right
    Fuse
    Build
    Deploy
  • Applications by Industry keyboard_arrow_right
    Worksite Management keyboard_arrow_right
    Site Settings for Mines & Aggregates Material Management Safety and High Walls Analytics Building Information Modeling (BIM) Solar Plant Thermal Inspection Change Map Advanced Stockpile Analytics and Stockpile Module Haul Roads Analytics
    Field Trial Analysis keyboard_arrow_right
    Microplot Designer Plant Height from RGB and Multispectral Plant Count and Emergence for Trial Field Scouting Maps Generic and Custom Scouting Maps Custom Composition Map Supported Crops for Trial Fields & Production Fields Row Vectorization Microplot Boundaries Adjustment Task Fraction of Vegetation Cover (FCover) Flowering Characterization Stay Green Plant Height from LiDAR Statistics for Trial Fields and Production Fields Agriculture and Forestry Analytics Description
    Mine Productivity Analysis keyboard_arrow_right
    Haul Roads Analytics Site Settings for Mines & Aggregates Material Management Safety and High Walls Analytics Change Map Advanced Stockpile Analytics and Stockpile Module
    Plantation and Forestry Management keyboard_arrow_right
    Supported Plantations and Forests Advanced Tree Analysis Tree Detection Grid Designer Tree Density Indicators Agriculture and Forestry Analytics Description
    Precision Agriculture keyboard_arrow_right
    Scouting Maps Generic and Custom Scouting Maps Custom Composition Map Field Boundaries Creation Supported Crops for Trial Fields & Production Fields Fraction of Vegetation Cover (FCover) Stay Green Statistics for Trial Fields and Production Fields Grid Designer Weed Management Plant Count for Production Field Emergence Characterization for Production Field Agriculture and Forestry Analytics Description
  • For Developers keyboard_arrow_right
    SDK and APIs keyboard_arrow_right
    SDK Introduction SDK Use Case Examples Custom Analytics Creation with CLI API Calls Using Alteia and YOLO to Train and Run Detection Models
  • Home
  • keyboard_arrow_right Applications by Industry
  • keyboard_arrow_right Worksite Management

Solar Plant Thermal Inspection

This analytic serves for the successive steps of :

  1. Automatic photovoltaic arrays boundaries detection (array vectorization)
  2. Automat hot spot detection within these arrays, assessing for abnormal condition (high temperature) from an automatically-computed threshold.

1. Required Input

A thermal map must first have be processed or imported into Alteia, for the algorithms to be run onto.

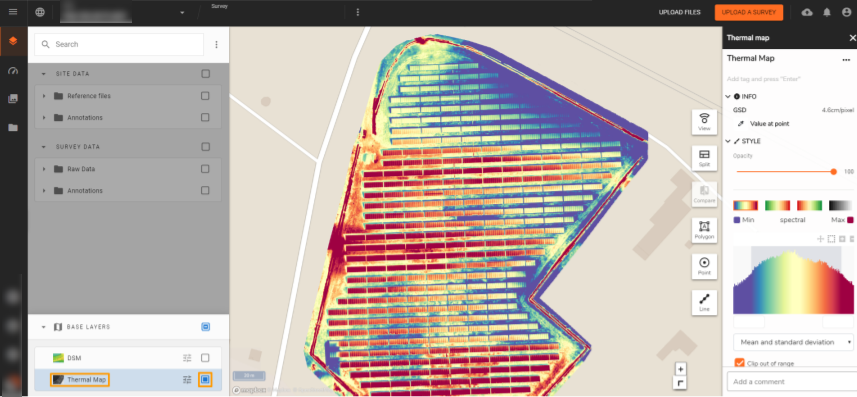
2. Viewing Vectorized Arrays

From a 2D View, enable the Layer that contains the vectorized arrays. In the example below, the Digitized Arrays layer will display them as white rectangles overlaid to Thermal Map layer.

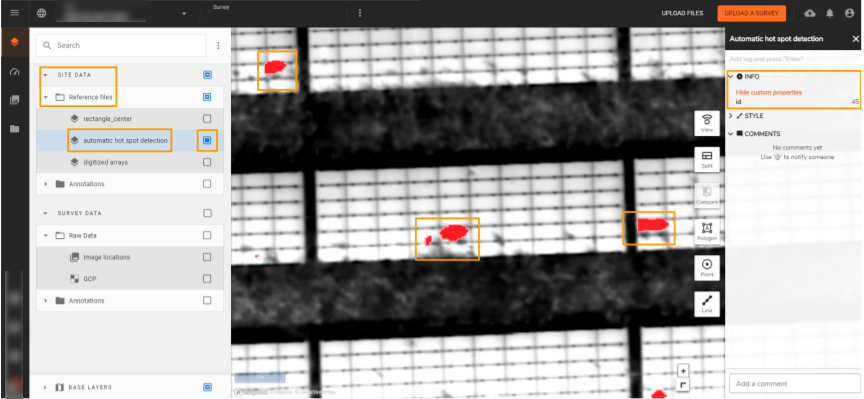
3. Viewing Detected Hot Spots

From a 2D view, enable the layer that contains the hot spot detections:

4. Deliverables

Go to Downloads section to export digitized arrays and automatic hot spot detections:

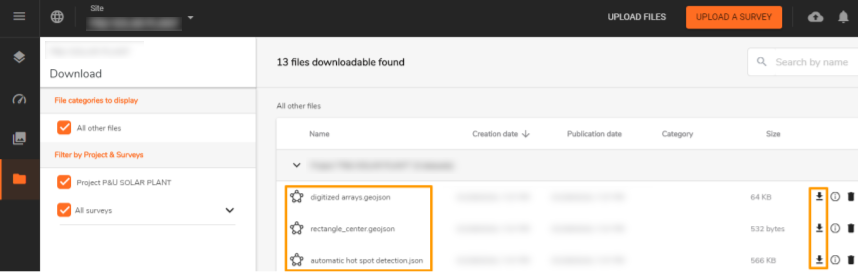
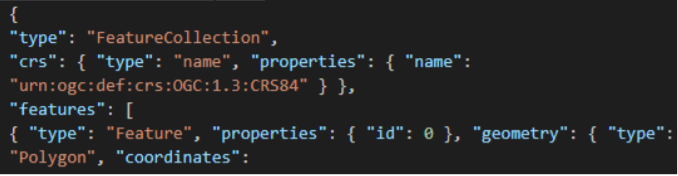
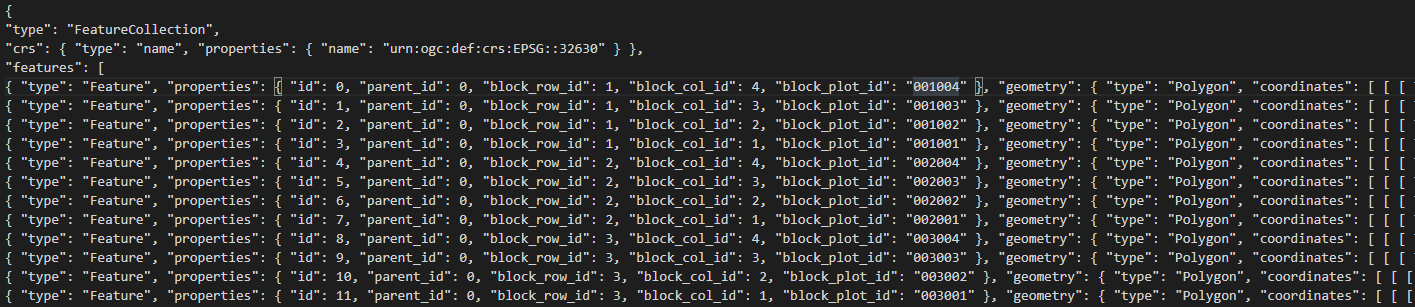
A unique geo-referenced layer for each plant is provided in geojson format:

Hot Spots detections are provided in geojson format as well:

Was this article helpful?

sentiment_satisfied

Yes

sentiment_dissatisfied

No

  • search icon
  • hot spots
  • thermal inspection
  • solar plants

RELATED QUESTIONS

  • Automatic Defect Detection and Analysis arrow_forward
  • Automatic LiDAR Point Cloud Classification arrow_forward
  • Power Lines Conductors Vectorization arrow_forward

Was this article helpful?

sentiment_satisfied

Yes

sentiment_dissatisfied

No

RELATED QUESTIONS

  • Automatic Defect Detection and Analysis arrow_forward
  • Automatic LiDAR Point Cloud Classification arrow_forward
  • Power Lines Conductors Vectorization arrow_forward

Sorry, we didn't find any relevant articles for you.

Please fill out the contact form below and we will reply as soon as possible.


Take the next step.

Request a demo or schedule a meeting to discuss your digital transformation ambitions.

Contact Us

Connect with us.

The world of Ai changes fast. Keep up to date with the Alteia platform by signing up to our newsletter :

Thank you for your message.

© 2021 Alteia. All rights reserved

LEGAL NOTICE
PRIVACY POLICY

© 2021 Alteia. All rights reserved

facebook logo
twitter logo
linkedin logo