

Insight - Introduction
Learn about basis of asset viewer module and the information it provides.
1. Description
The Insight module allows users to:
- Seamlessly aggregate and visualize data in 2D or 3D from the assets perspective, regardless of the multiple data collection sources and surveys
- Explore assets through interactive and contextual views, from simple to highly contextual, by selecting layers to overlay on the map, depending on business needs
- Easily navigate through the assets using custom asset properties
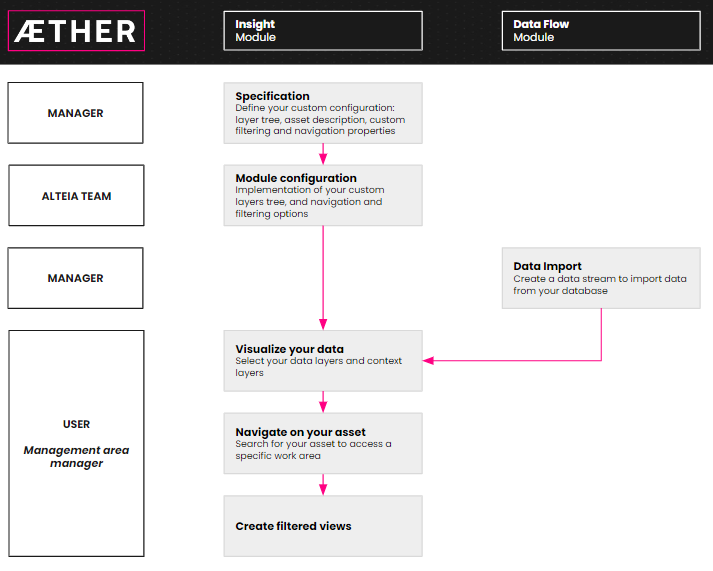
4-step workflow:
- Customize the workspace: describe the assets, layer tree, custom navigation, and filtering options.
Define the assets and their properties, set the contextual and asset layers to visualize on the map and configure customized navigation and filtering options to efficiently explore the datasets.
- Explore the assets in simplified or highly contextualized views, depending on the business needs.
Select the layers to visualize on the map, the corresponding data will be displayed according to the zoom level defined in your configuration. This allows users to view the asset in simplified or highly contextualized views, depending on the business needs.
- Experience easy and comprehensive data navigation within the assets.
Access a specific area of interest or asset using the navigation bar by searching for an asset ID, geographical coordinates or address: the map will zoom to the area or specific asset location. Use the GPS location tools to center the map on your current position.
- Focus on what matters by creating filtered views of the asset data.
Define a scope of observation: Set up your work unit and its specific attribute to observe, and filter the assets to be displayed on the map based on their properties.
2. Workflow Overview
2.1 Configure your environment
Define your organization's assets: describe the assets and their properties and define the different layers (along with their hierarchy) to visualize on Insight in the layer tree.

Set the navigable attributes to easily navigate to specific areas of interest.
Set the filtering options: define your work units - the scale at which you want to make observations, such as sections of a network, microplots, mine sites, etc... and define the attribute to observe - encroachment level, vegetation volumes, plant count, production, number of safety hazards, etc...

2.2 Explore your data on the map
As with any GIS software, easily select the layers to visualize on the map from the layer panel: the corresponding data will be displayed according to the zoom level defined in the configuration.
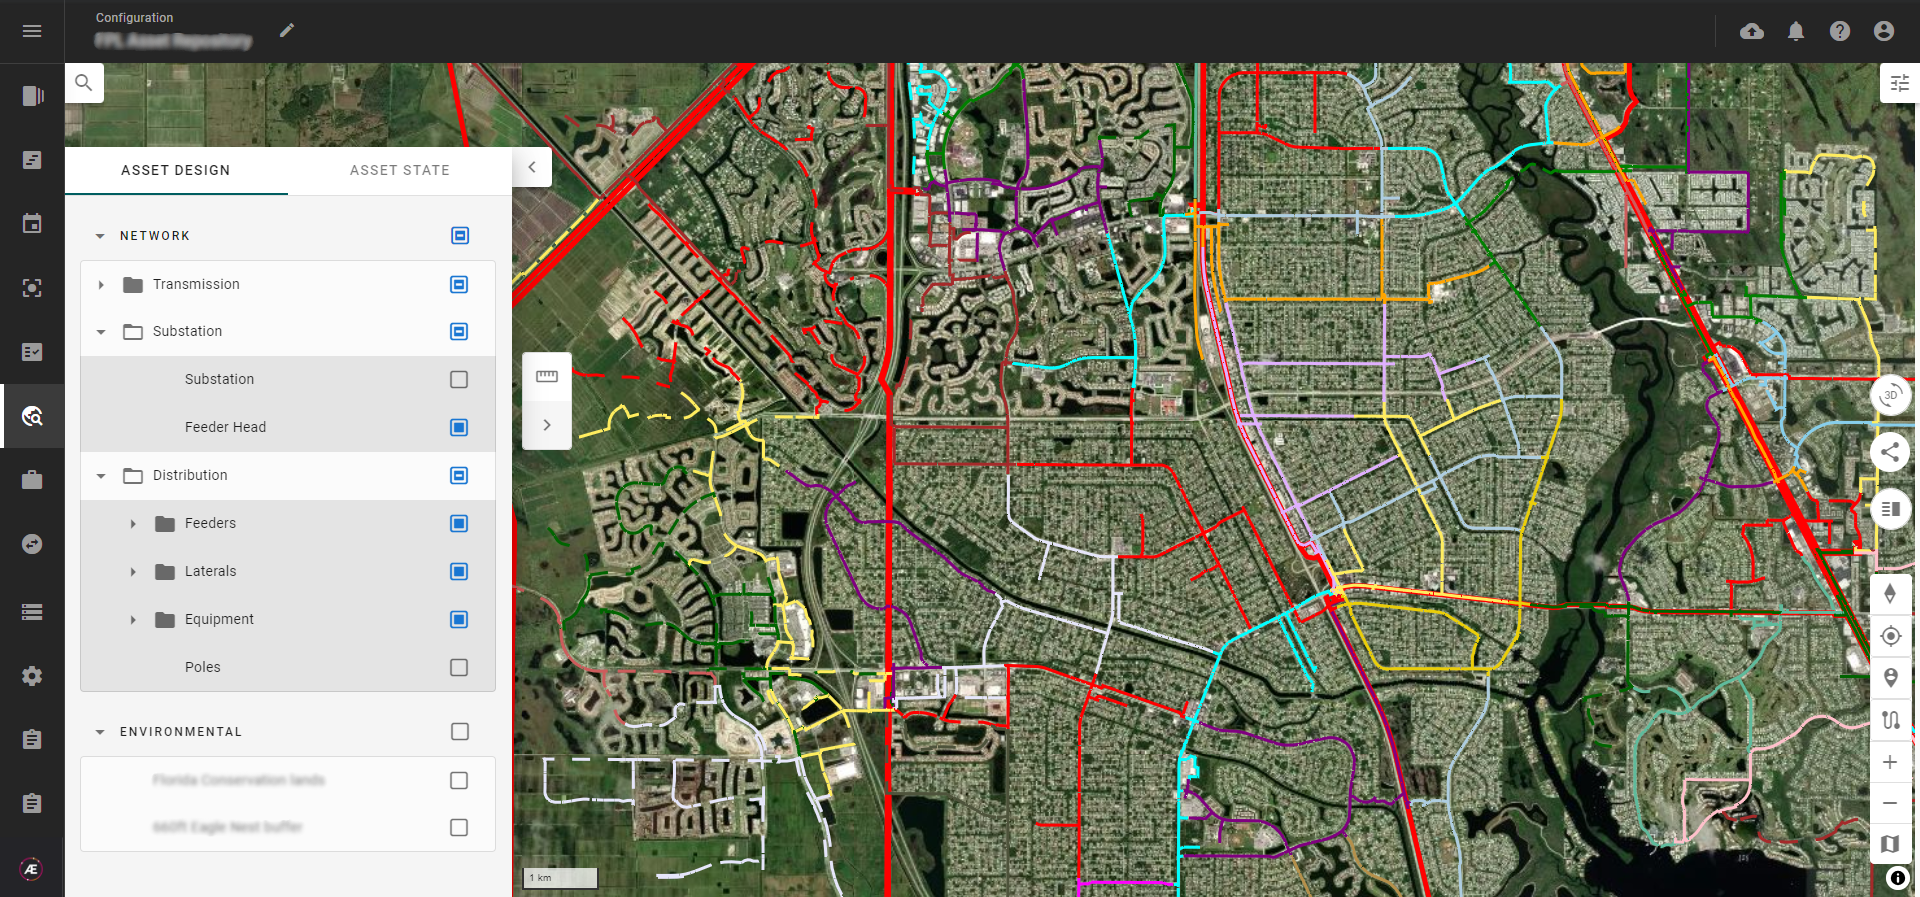
The asset data is contextualized in 2D and 3D with geospatial data and custom context layers.
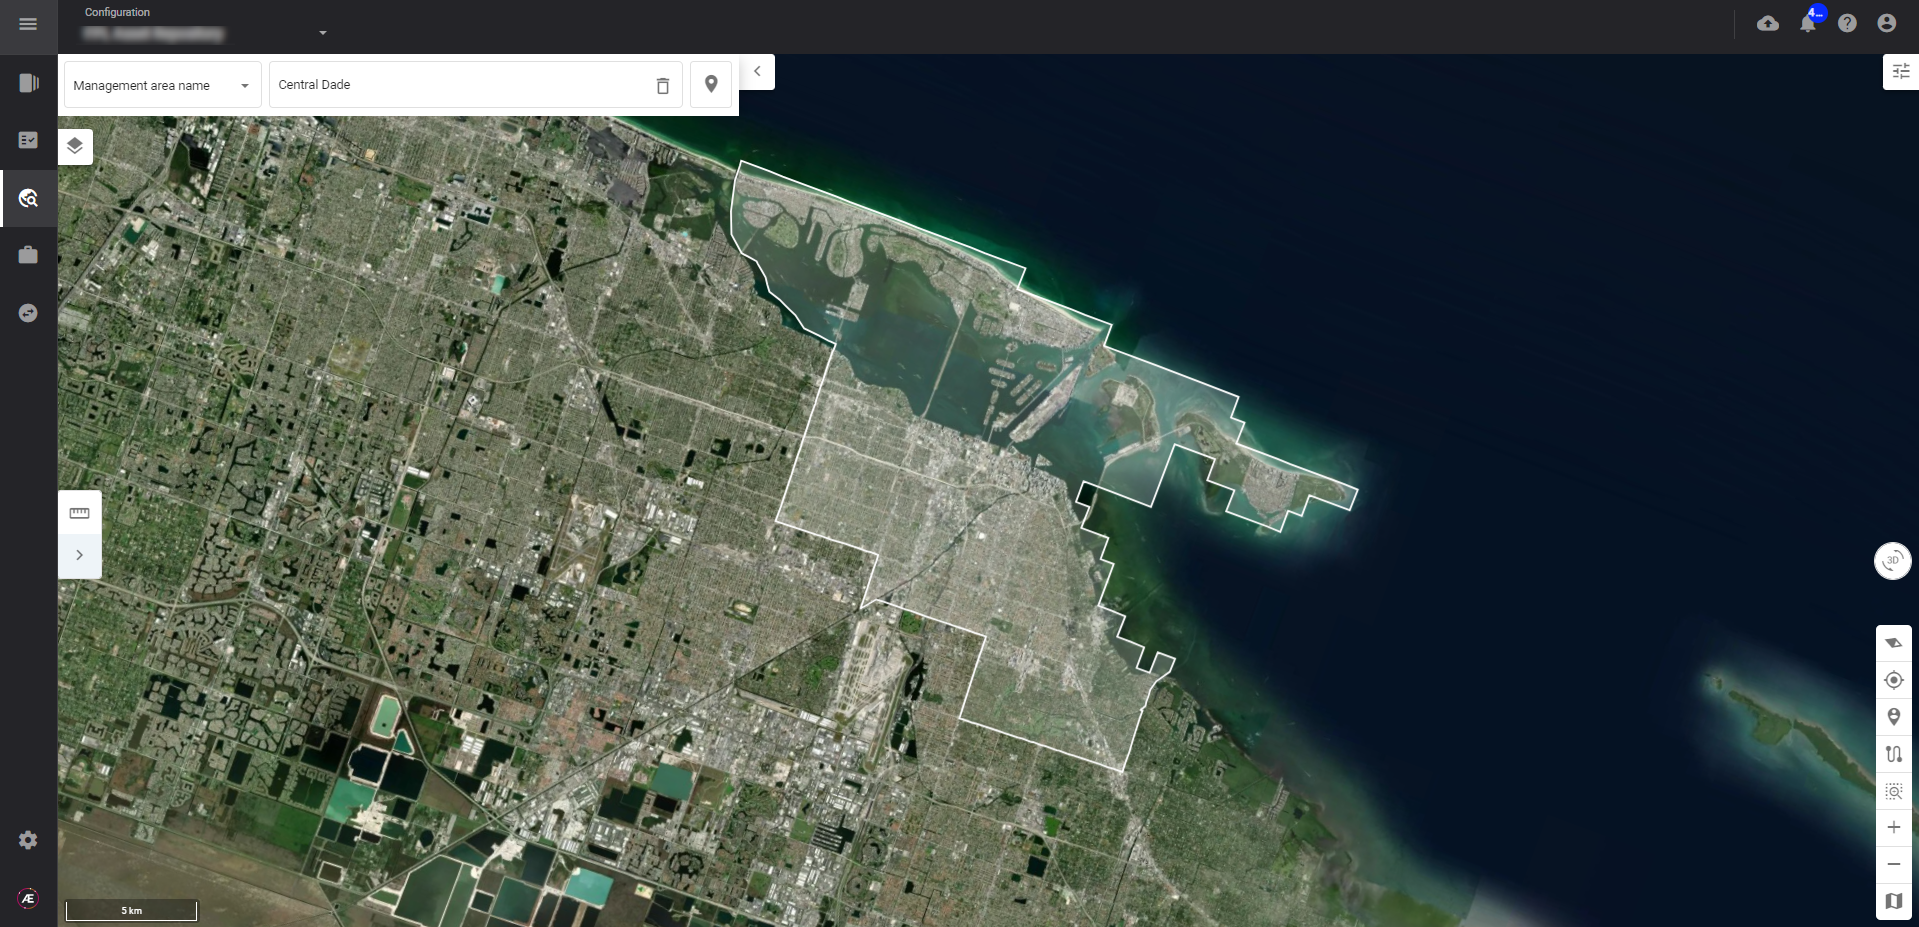
2.3 Navigate on address, coordinates and asset
Navigate to a specific area: use the navigation bar to search for an address or geographical coordinates, and the map will zoom in automatically on the searched area.
In the field, use the GPS location tools to center the map on your current location.
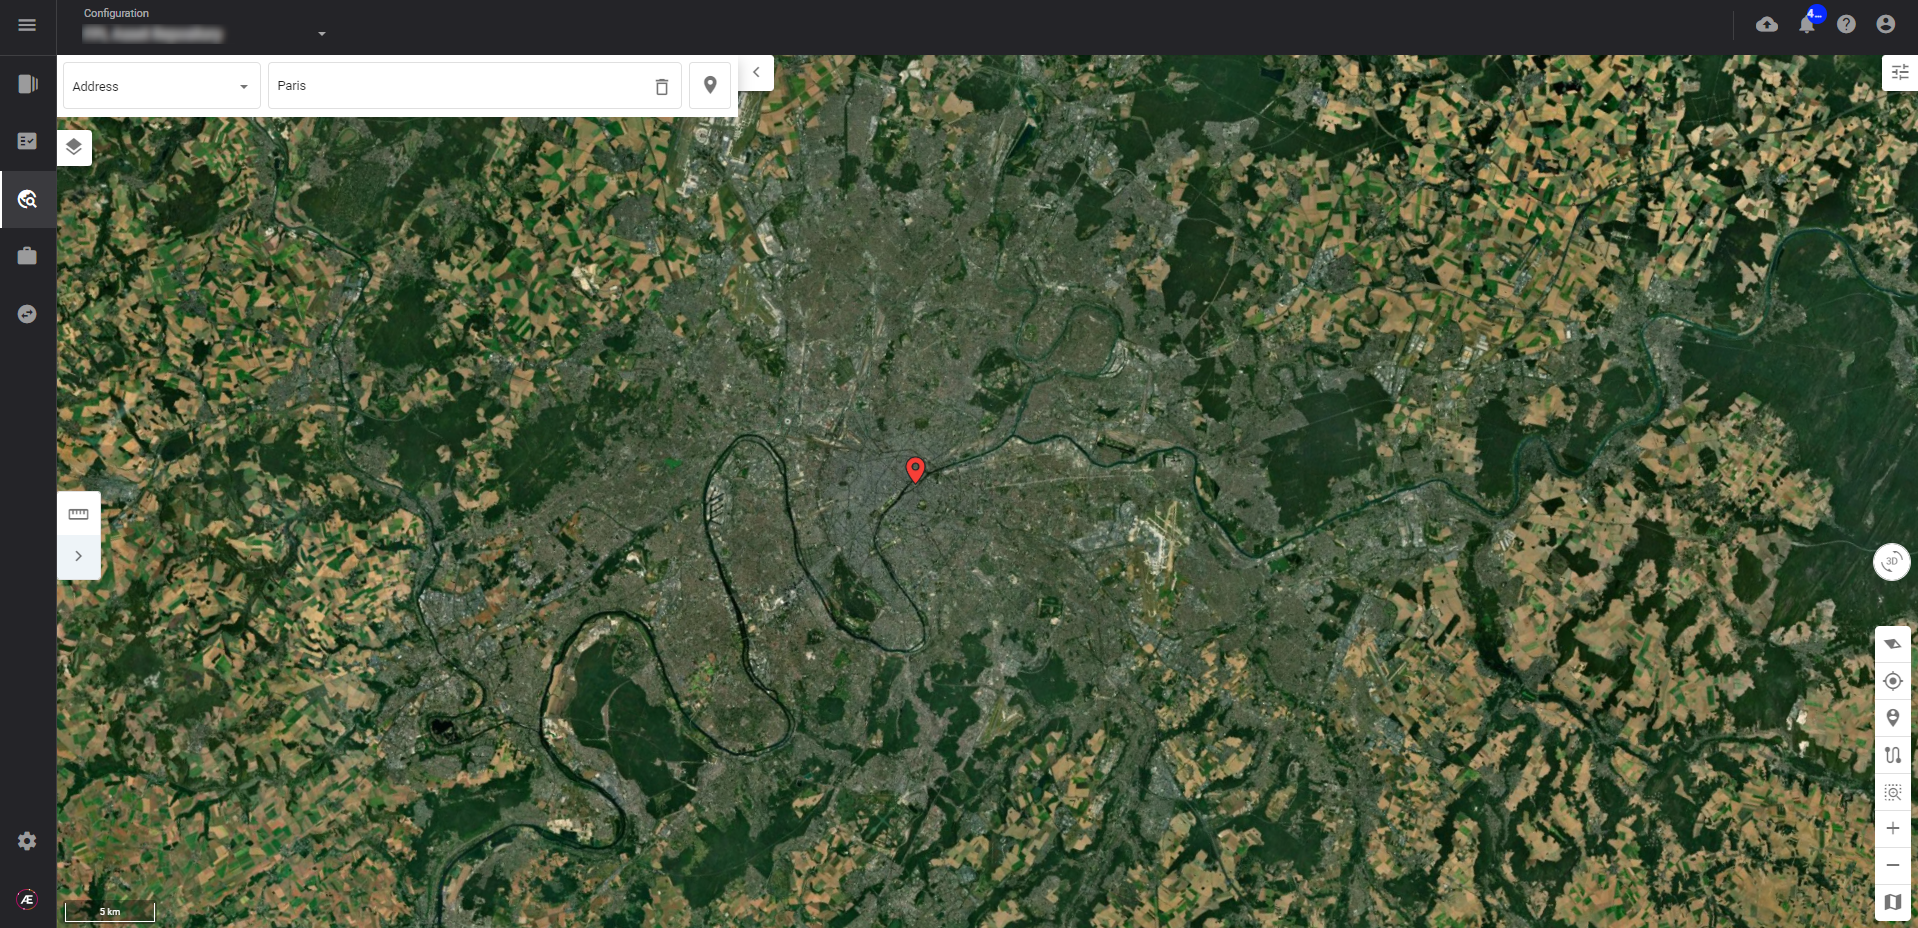
Navigate through your assets: center the map on a specific asset by searching for custom properties thanks to the allowed configuration.
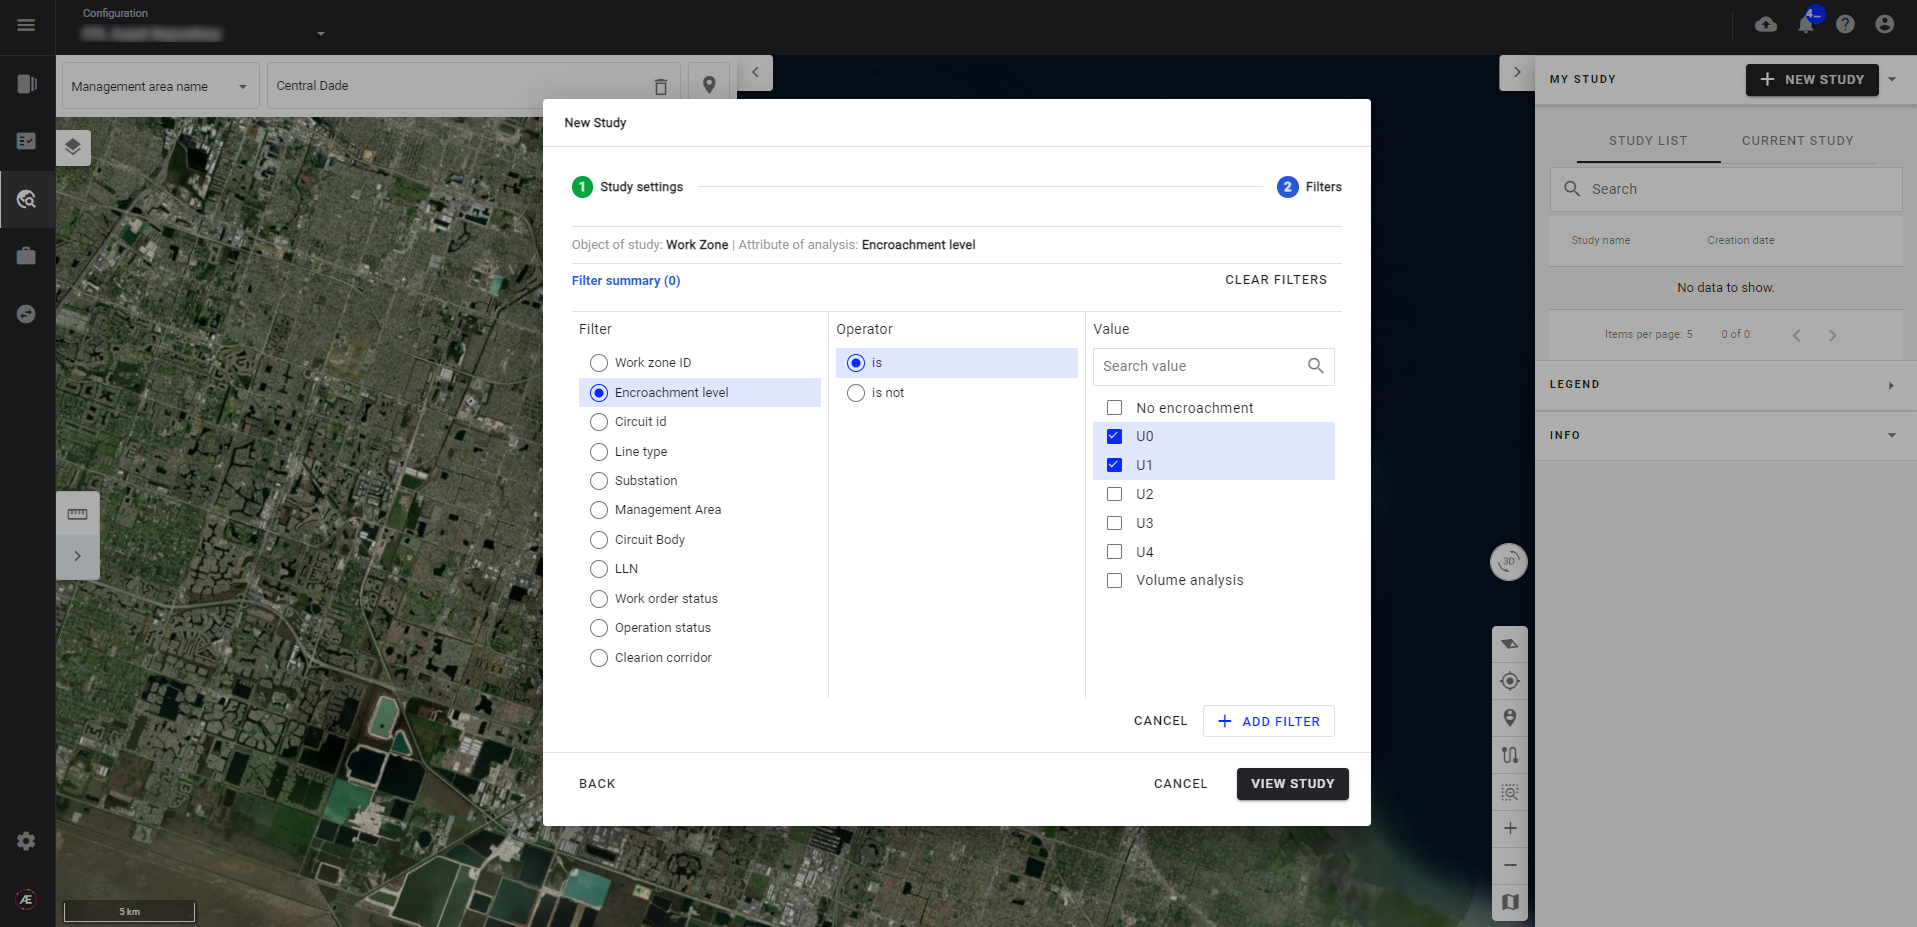
2.4 Filter your views and export your assets of interest
Take data exploration one step further by creating filtered views of the asset data: filter the assets to be displayed on the map based on their properties - Select the work unit and its specific attribute to observe (configured in Paragraph 2.1): such as work zone and encroachment level for example, and configure the view by filtering by asset type or asset properties.
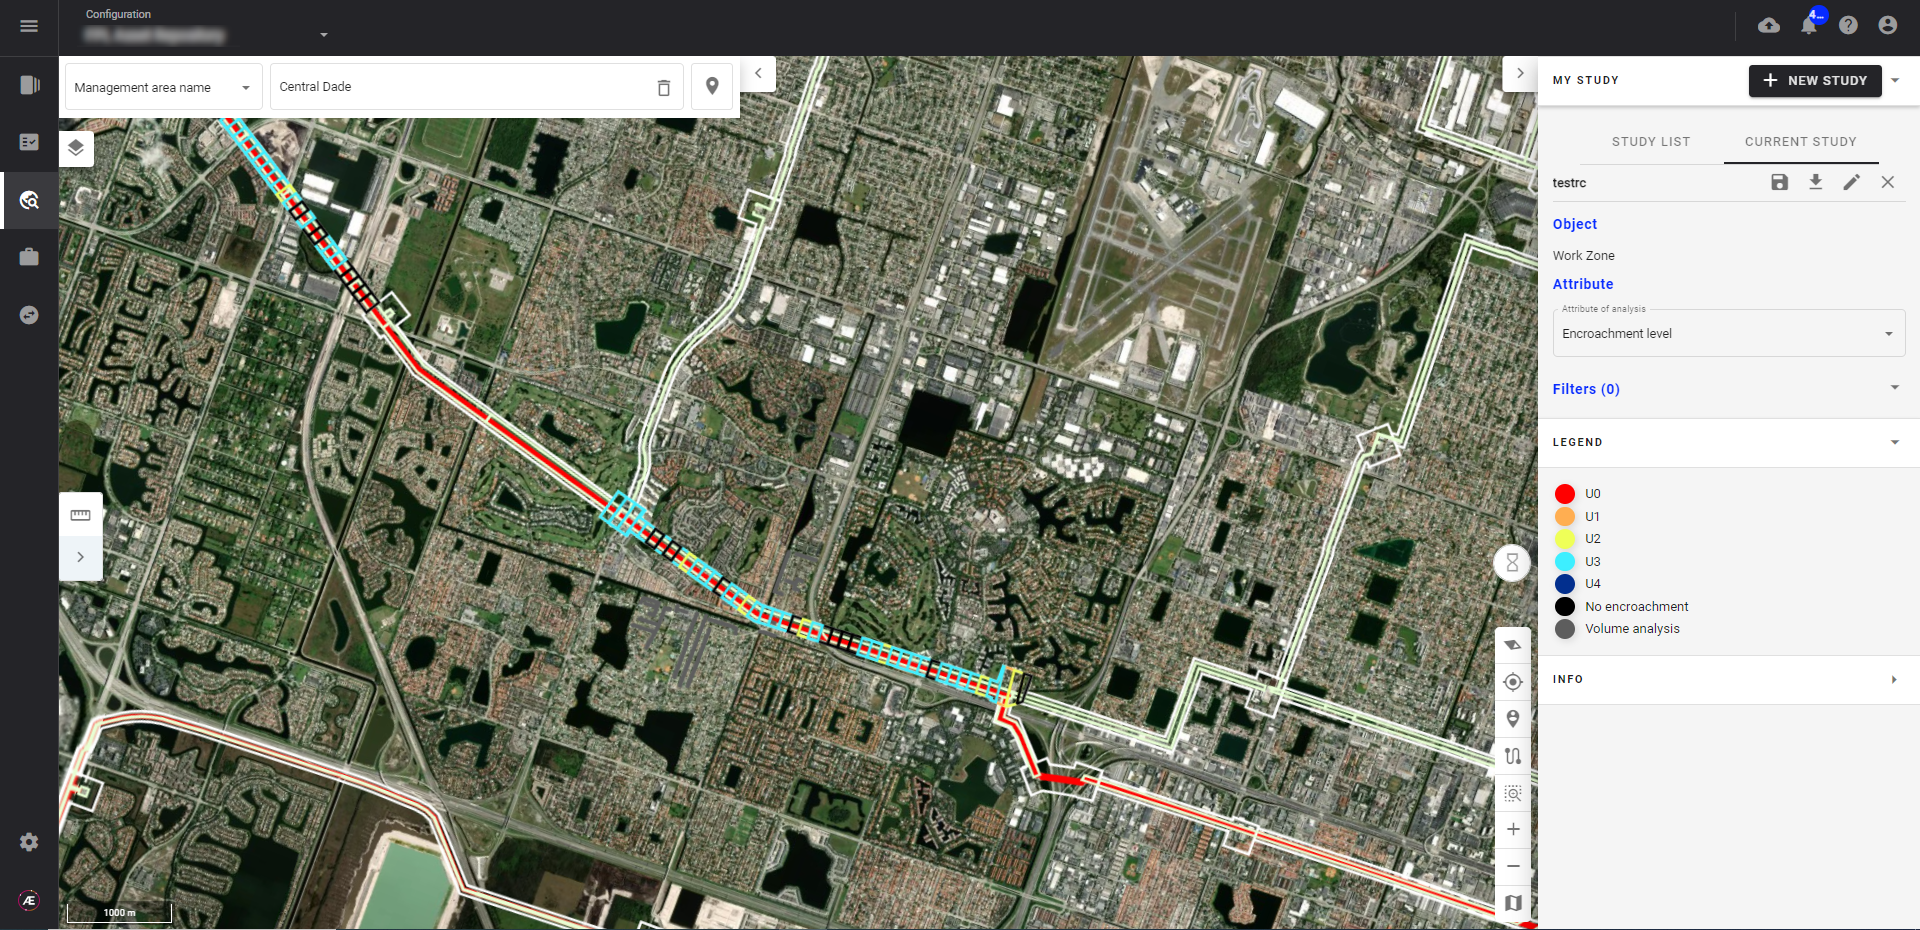
On the map, the selected work unit, e.g. work zone, is colored according to the legend of the selected attribute of study, e.g. encroachment level.
Export the results of your study as a CSV file: the CSV contains the filtered features and their properties.
3. Scope
Today, the Insight Module handles the following use cases:
- Grid vegetation management
- Mine safety and efficiency analysis
- Field trial analysis
4. Use case example
Insight for grid vegetation management
4.1 Prerequisites
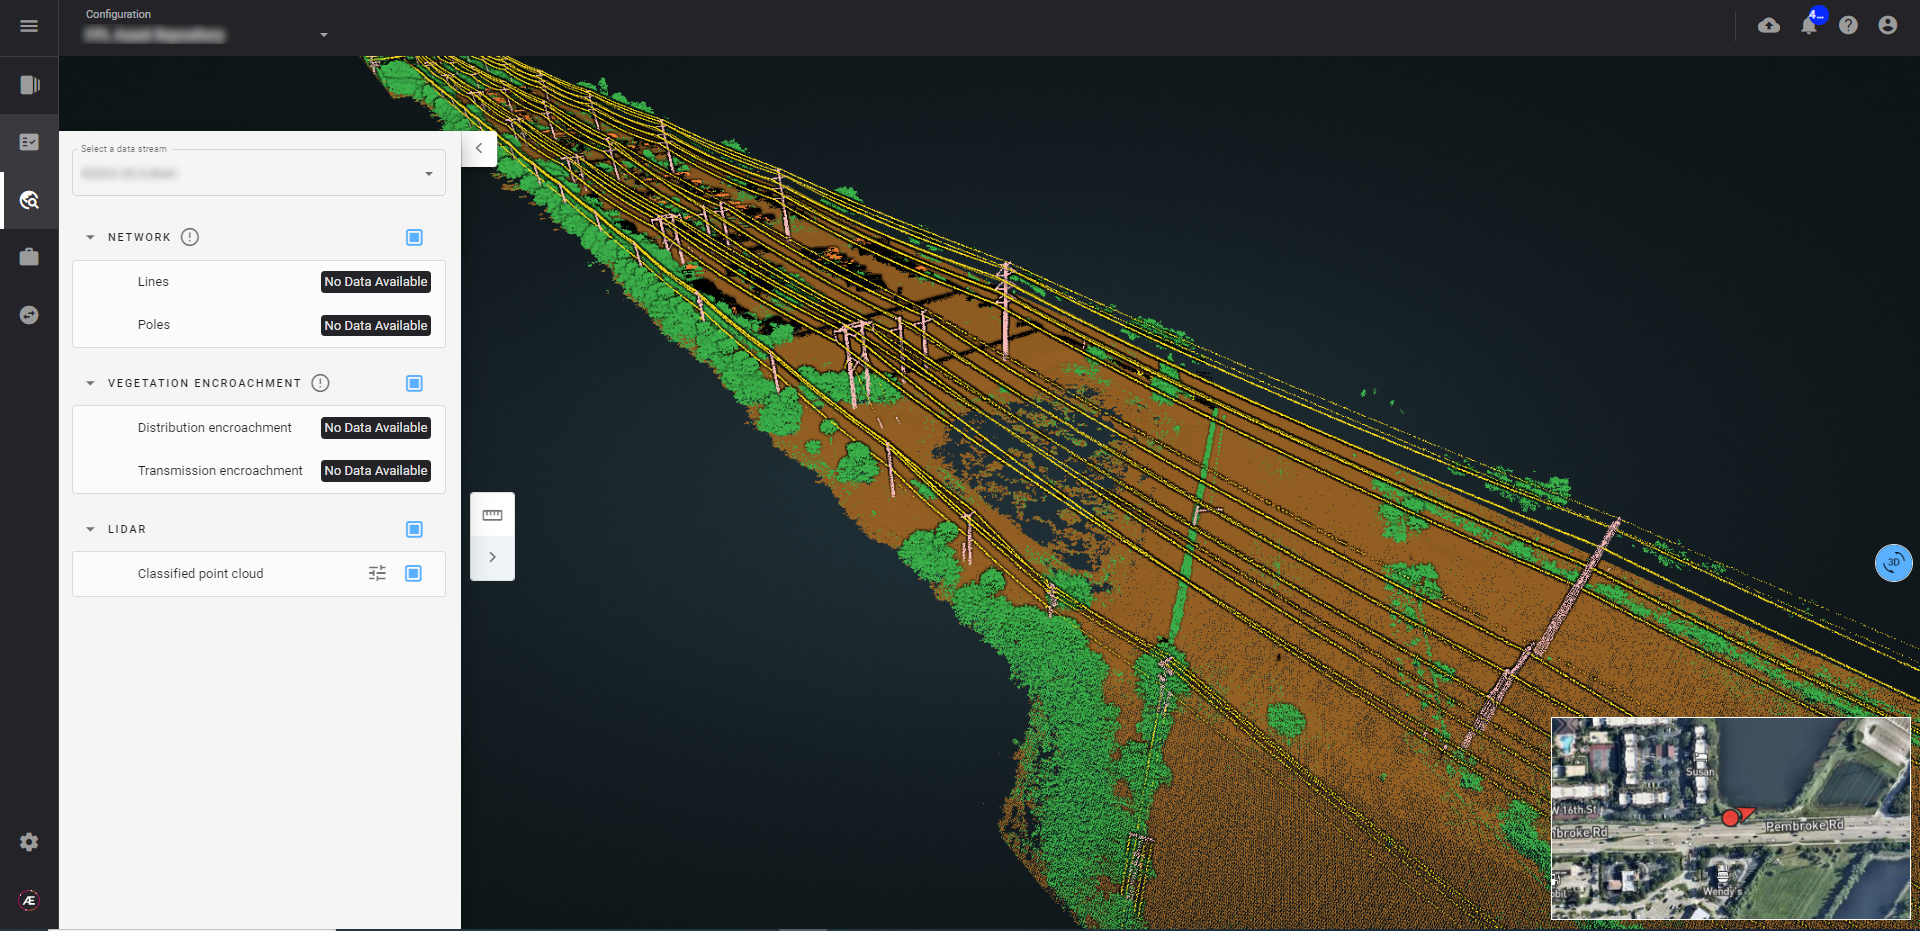
Data is collected and imported on Aether thanks to the Data Flow module: a Data Stream has been created to import the LiDAR tiles of the Florida Grid Network.
Vegetation management analysis has been performed with the Analysis module.
4.2 Results
On-site scoping operations are planned with precision: areas at risk of vegetation damage are quickly identified and actual encroachment zones can be validated using 3D visualization.
4.3 Workflow
The team configures Insight to be linked to the network data stream, allowing users to select layers from this data stream for visualization: lines, poles, equipment, etc...
Custom properties are defined, allowing users to navigate to management areas or line sections using custom IDs and filter the views by relevant properties.
The manager of a particular management area selects the GIS network layers and the vegetation encroachment results in layers to be visualized on the map.
He can also contextualize these layers with environmental or OSM layers.
The management area manager navigates to the zone for which he is responsible for exploring the data of interest.
He can navigate to the management area for a global view or to a specific line section to monitor the vegetation volume and the identified encroachment zones in 2D or 3D.
The management area manager filters the data to easily visualize the work zones with high levels of encroachment that need to be scoped
The manager can extract this list of work zones to plan operations.
5. Benefits
The implementation of such a module designed for effortless data exploration and aggregation yields a host of invaluable advantages.
Foremost, this module empowers users to effortlessly sift through vast and complex datasets, unlocking insights that might otherwise remain hidden.
By offering intuitive tools for filtering and visualizing data, it enables users to identify patterns, trends, and outliers with unprecedented ease.
Moreover, the module's ability to aggregate data from multiple sources simplifies the process of synthesizing information, providing a comprehensive overview that aids strategic planning and decision-making.
This streamlined approach not only enhances efficiency but also encourages cross-functional collaboration, as teams can quickly align their analyses and draw actionable conclusions.
Additionally, the module's interactive visualizations and user-friendly interface democratize data access, allowing individuals across the organization to engage with and comprehend the data, regardless of their technical expertise.
In essence, this module serves as a catalyst for innovation, fostering a data-driven culture and empowering organizations to harness the full potential of their information assets.
