

Weed Detection For Field
Aether Weed Detection for field analytics help drive Precision Agriculture practices, by delivering maps to be used for herbicide sprayer control in field.
This tutorial explains how to run and use the results of these analytics.
This analytic detects weeds on bare soil or row crops and generates a prescription map, that can be exported to the sprayer.
1. Compatible sensors
- Micasense RedEdge 3, mini and MX, P4PM
2. Required Inputs
In order to run this analytic, the following ones shall have been preliminary processed:
- Spectral Index and Custom Spectral Index Map
- Field Boundaries
- Row Vectorization (for row crops) (Row vectorization)
3. Output File Formats
- .shp
- .geojson
- Weed mask: tif
Attributes of the output vector file:
- id: identifier of the area (weed zone or no weed zone)
- area: surface of the area (m²)
- rate: dosis selected in input
- density: density of weeds per area in %
- mean: average NDVI into the area (between 0 and 1)
4. Running the analytic
Step 0 - Launch the row vectorization if you need to detect the weeds in a cultivated field (see the following article Row vectorization)
Step 1 - Open the project, go first to the Analytics panel then to "Weed detection for field" section and press Run button.
Step 2 - Select a Scouting map (NDVI is recommended).
Step 3 - Select the Field Boundaries.
NB: If the message “No Datasets Satisfy the criterion” appears, that means you should first upload the field boundaries in the project (selecting category: Field Boundaries)
Step 4 - Select the Rows vector file (for weed detection within the cultivated field)
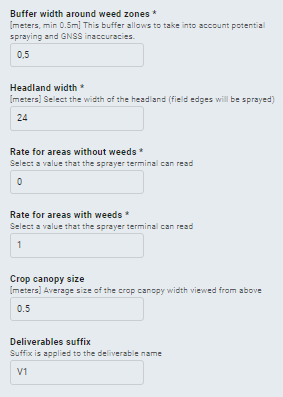
Step 5 - Fill in information about the field and sprayer:
Step 6 - Press "Launch weed detection for field" button.
5. Exploring Results
Weed zone layer
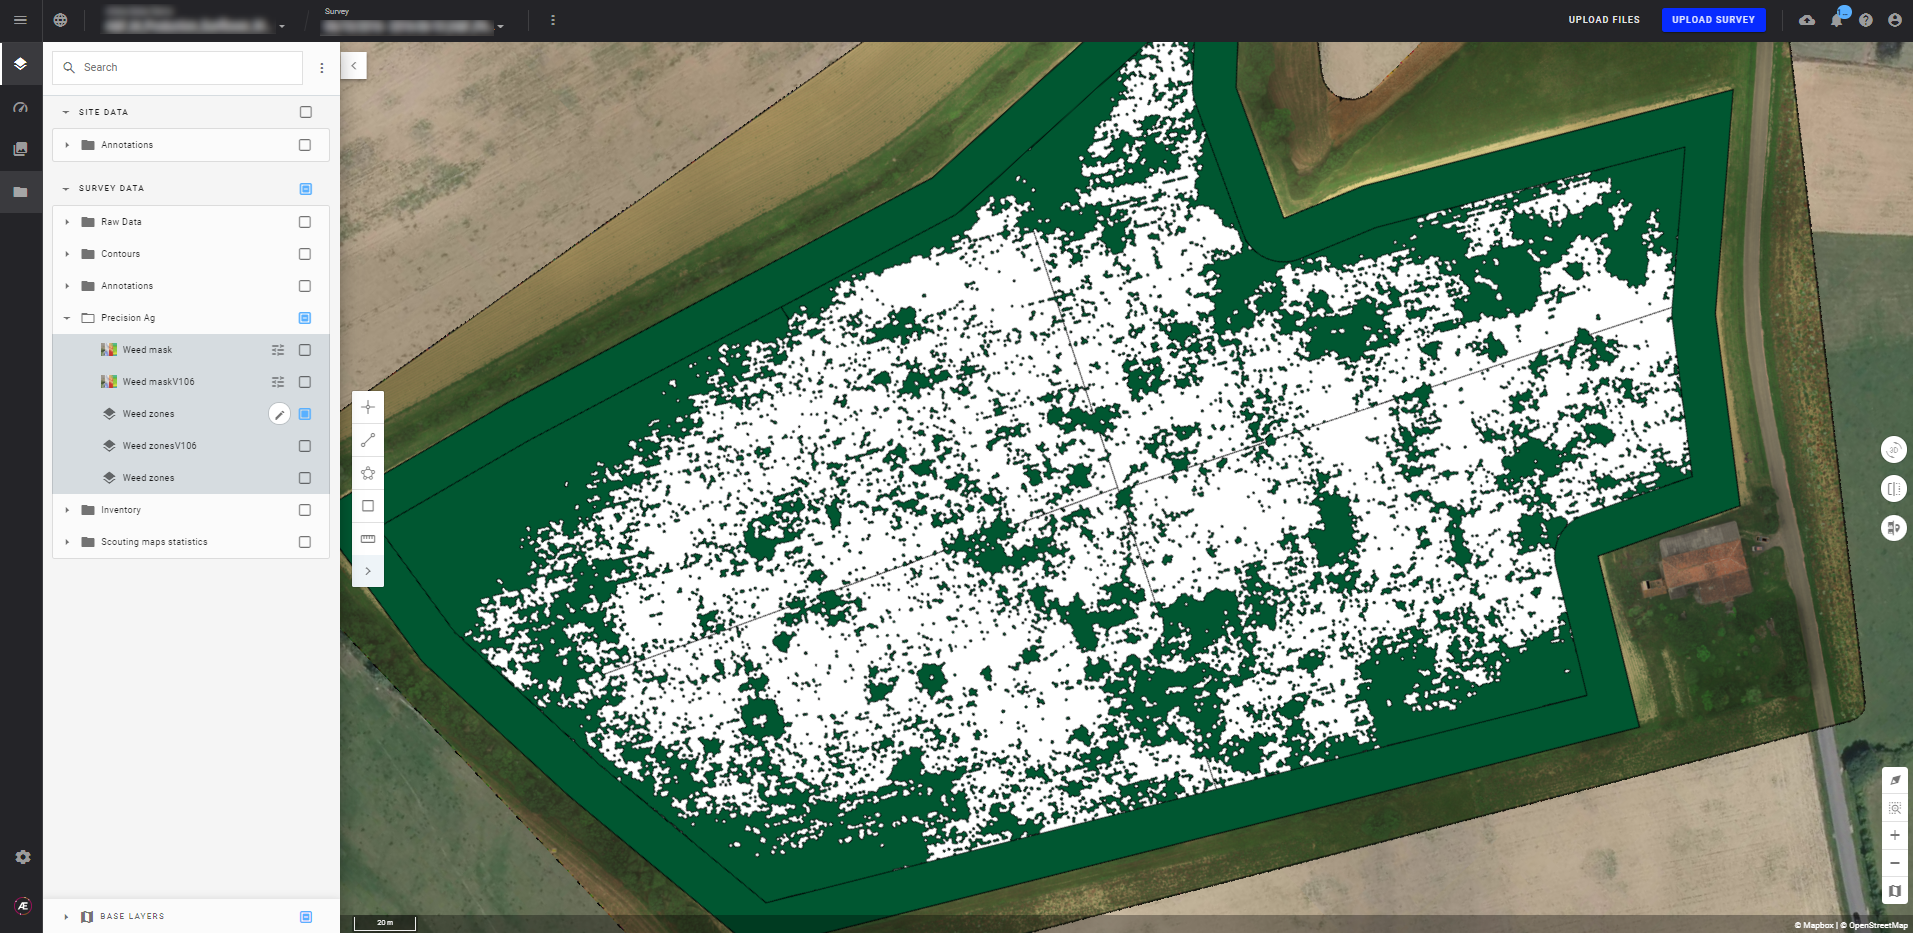
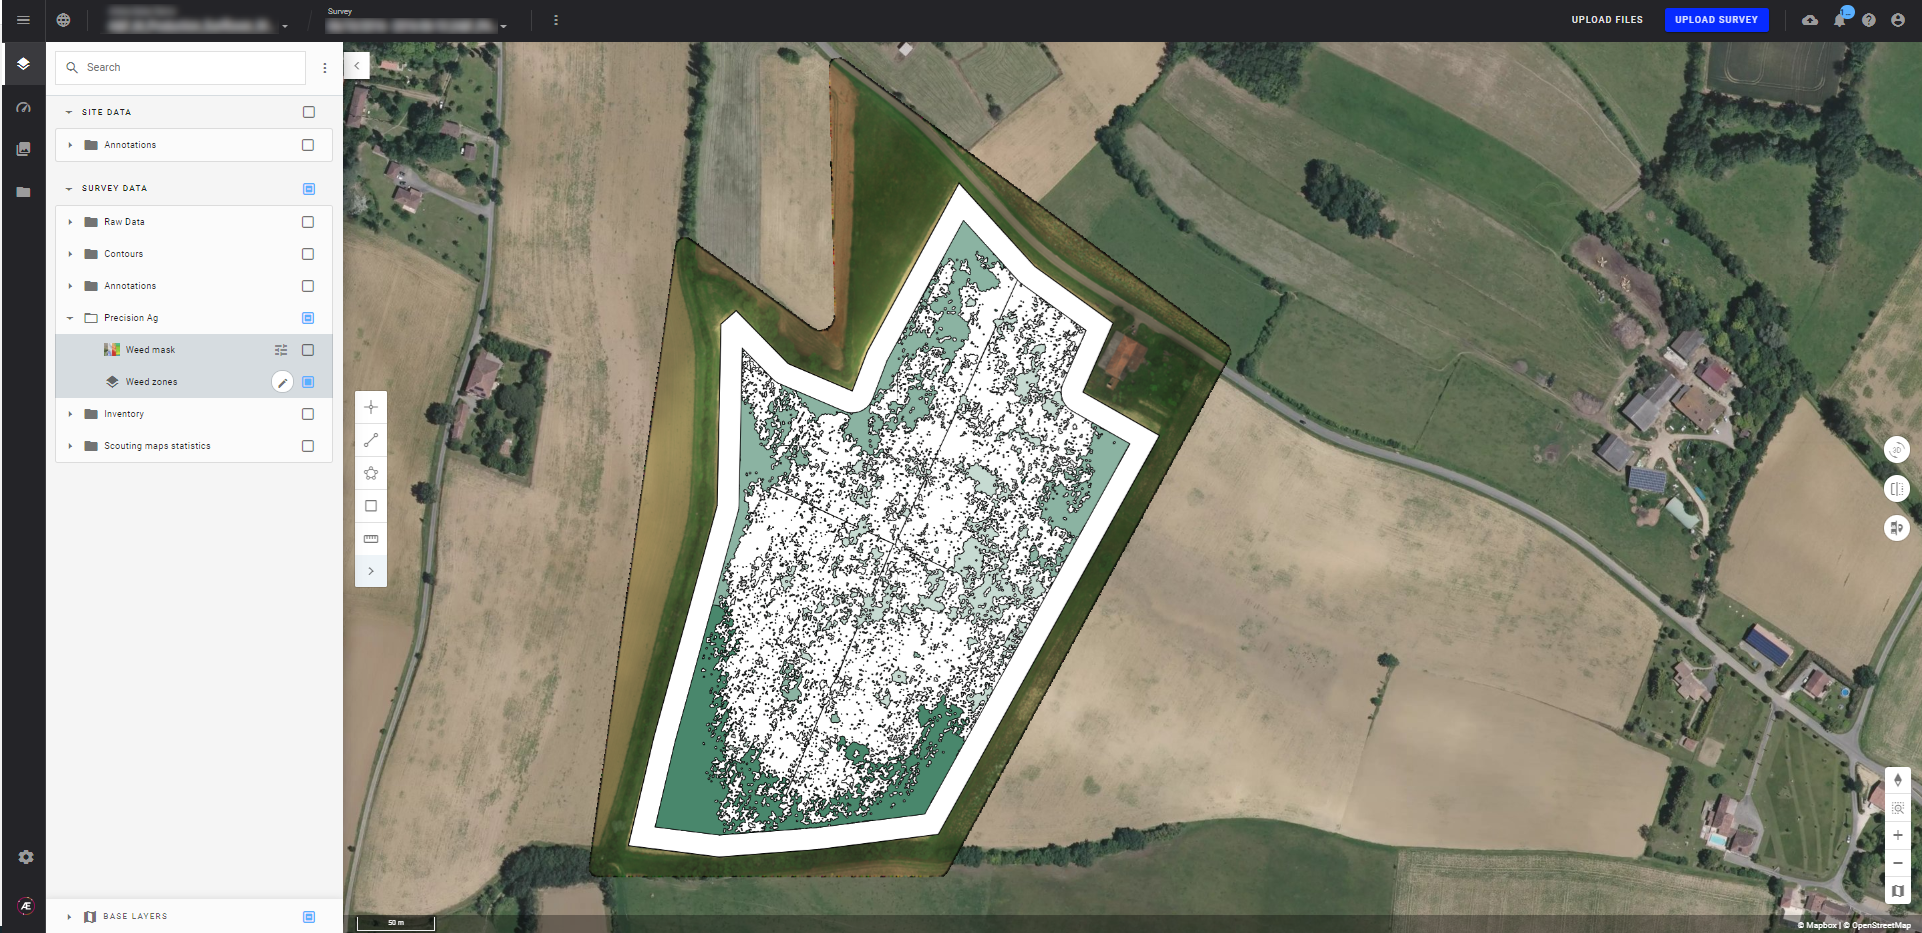
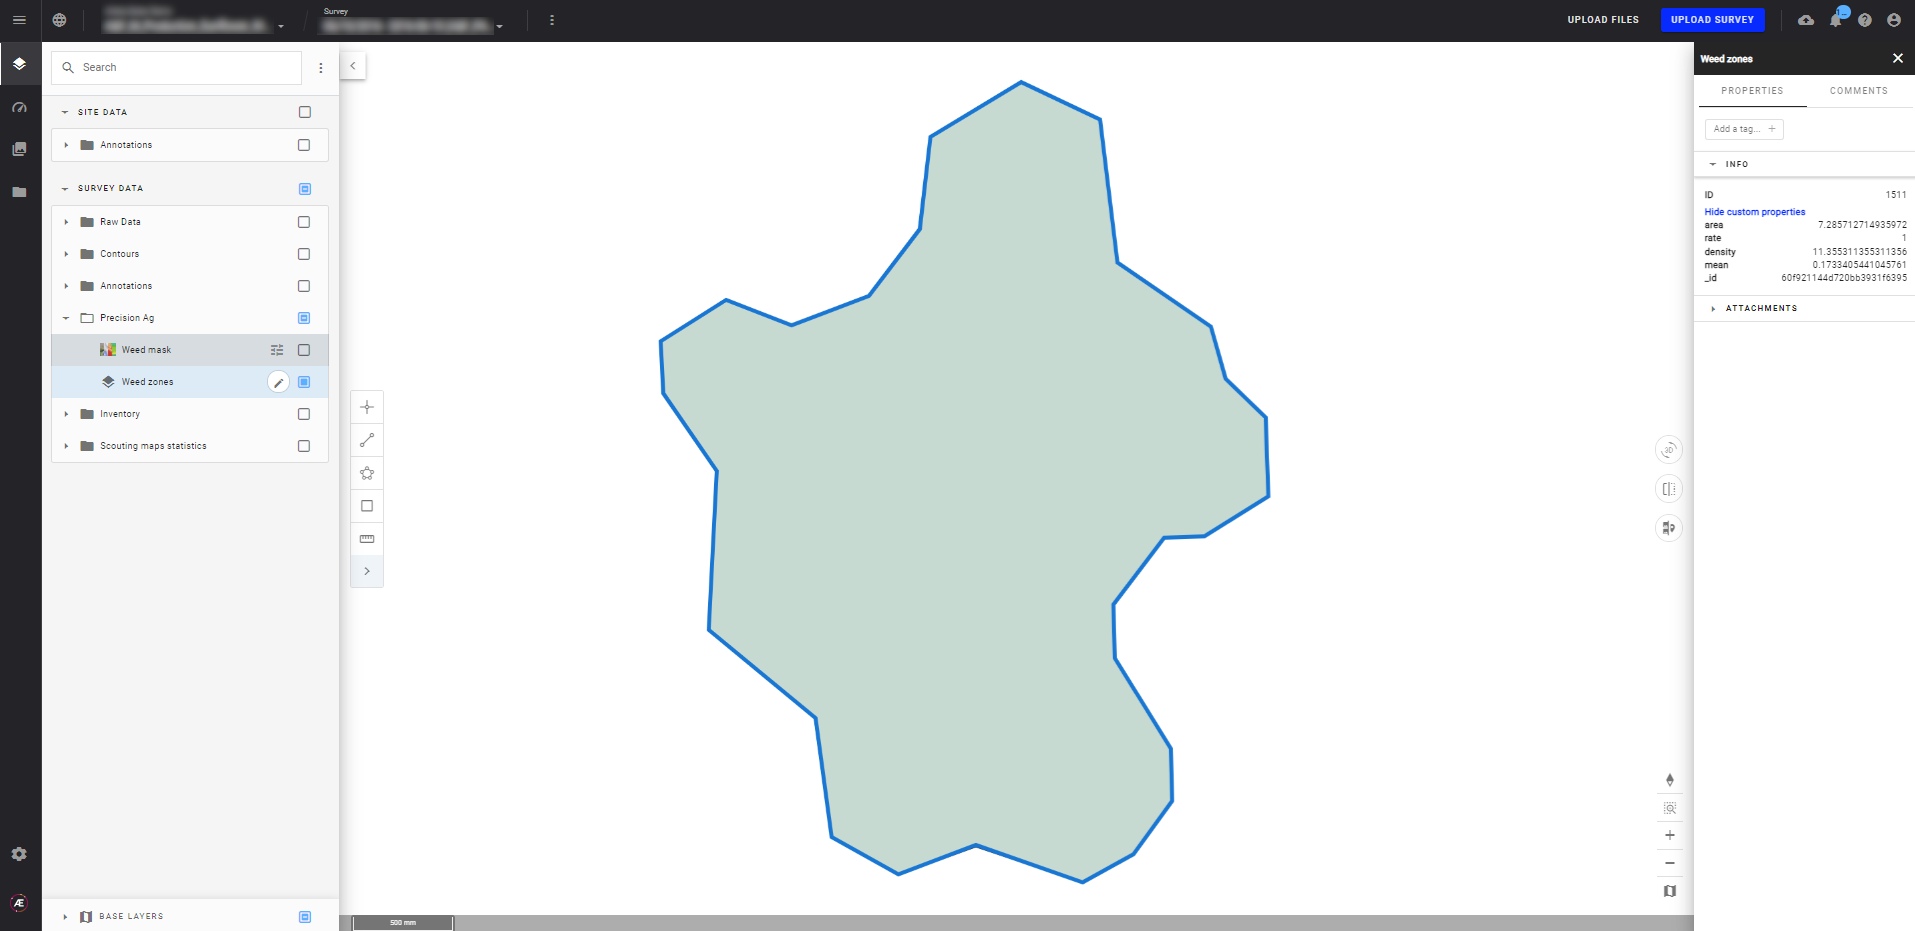
Go to Layers panel, to SURVEY DATA section, and tick the Weed zones layer from Precision Ag (you can rearrange layers organization if needed):
Click on the layer to open its information panel on right side:
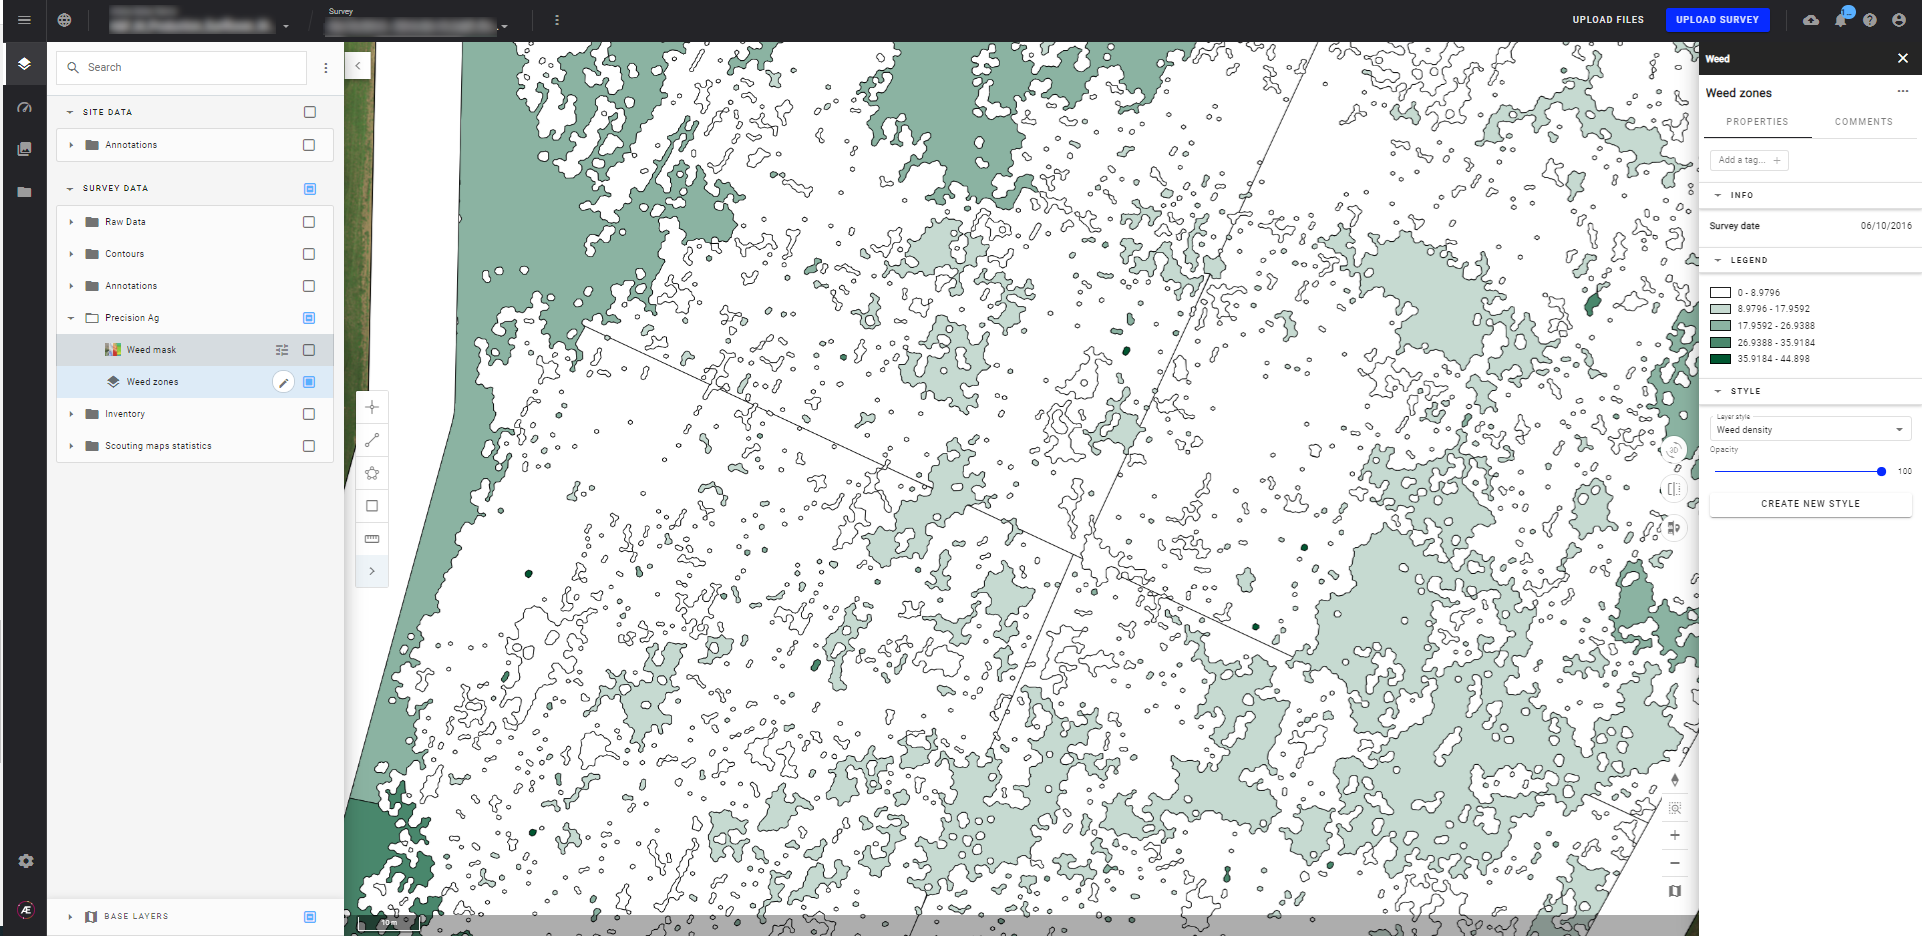
Weed zones are displayed in green in the example above. Click on one of these zones to read its results:
- Weed density, expressed as a percentage
- Area
- Mean NDVI (between 0 and 1)
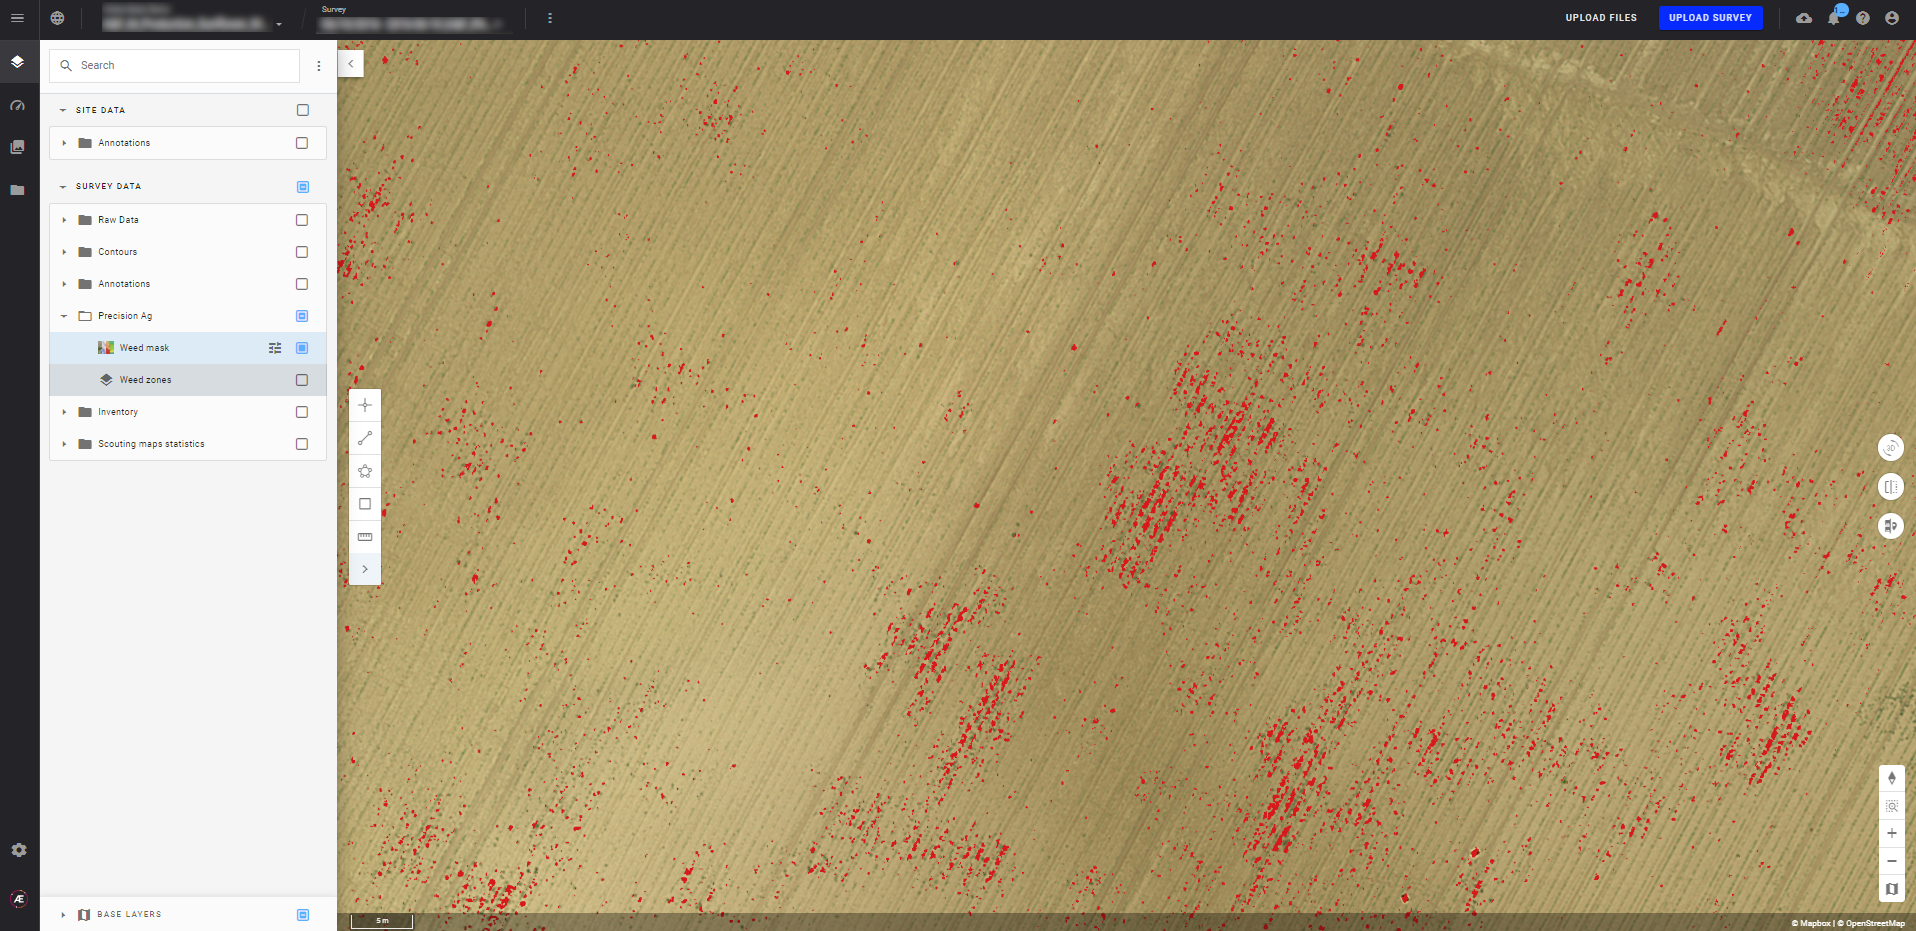
Weed mask:
If you display the weed mask layer, you can visualize the detected weeds in red.
See the following article to export the data: Download and Export Data.
