

Download and Export Data
1. Description
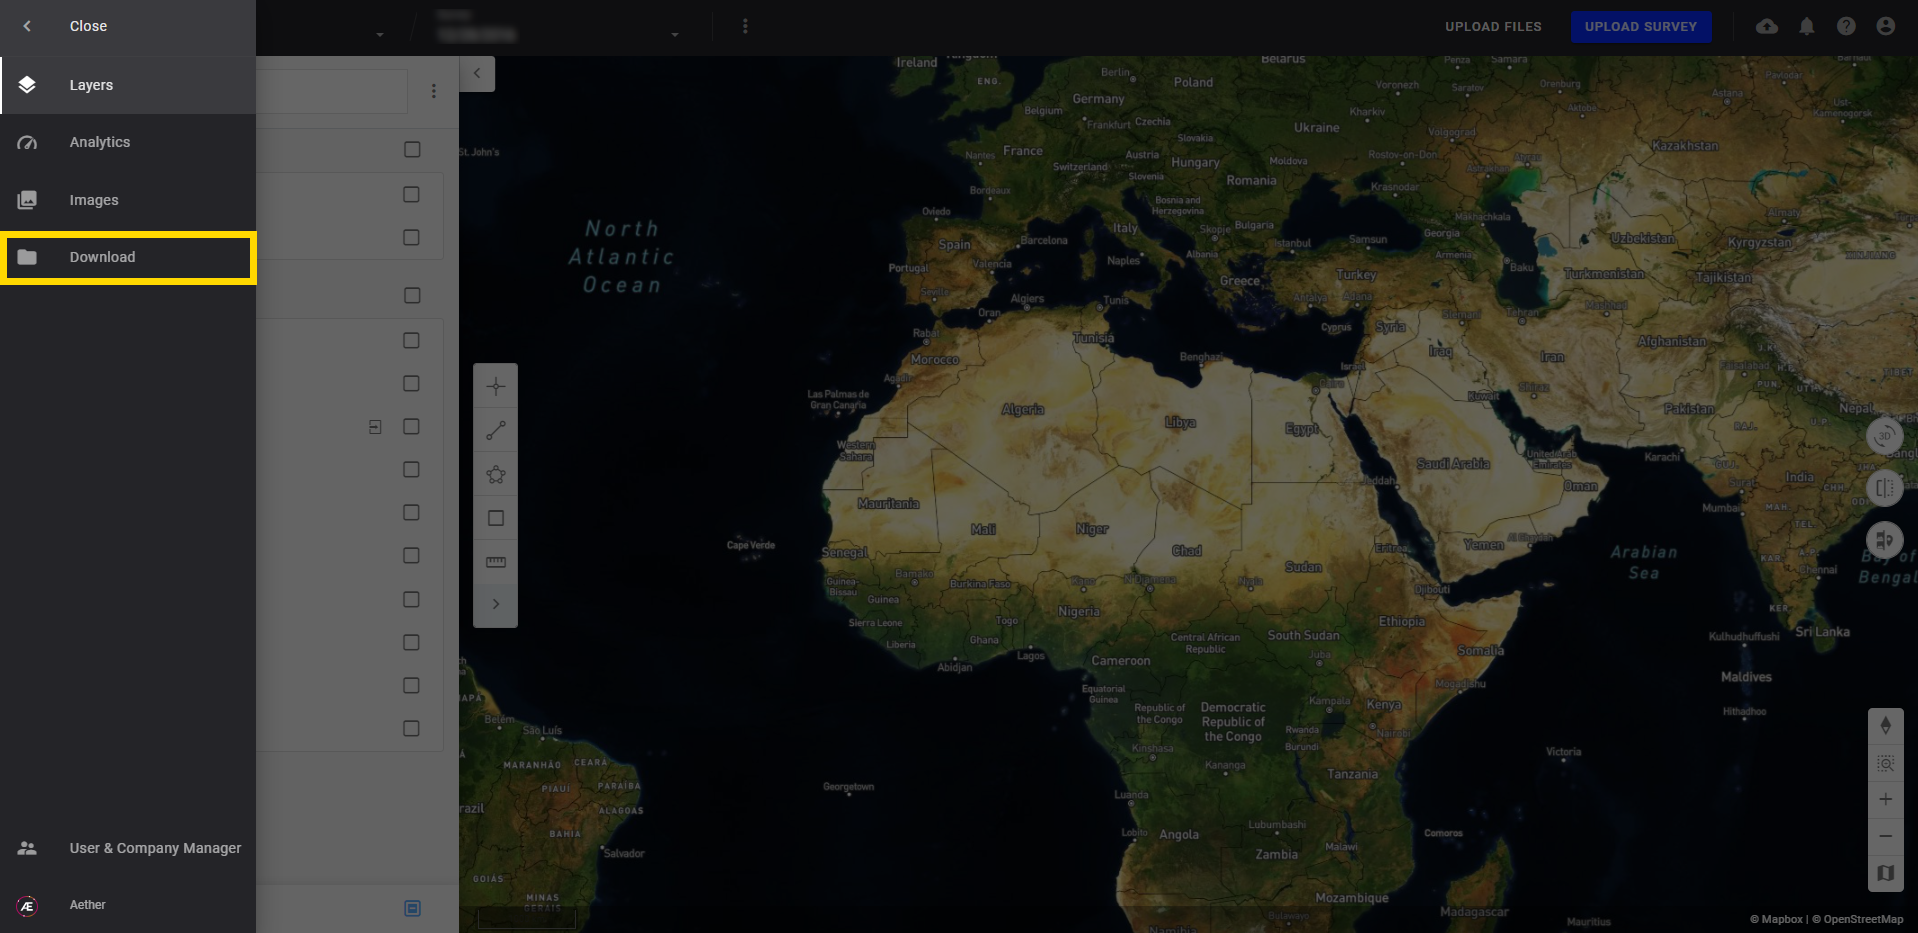
Find on the Downloads tab on the left menu, all downloadable and exportable items on a project.
2. Download View
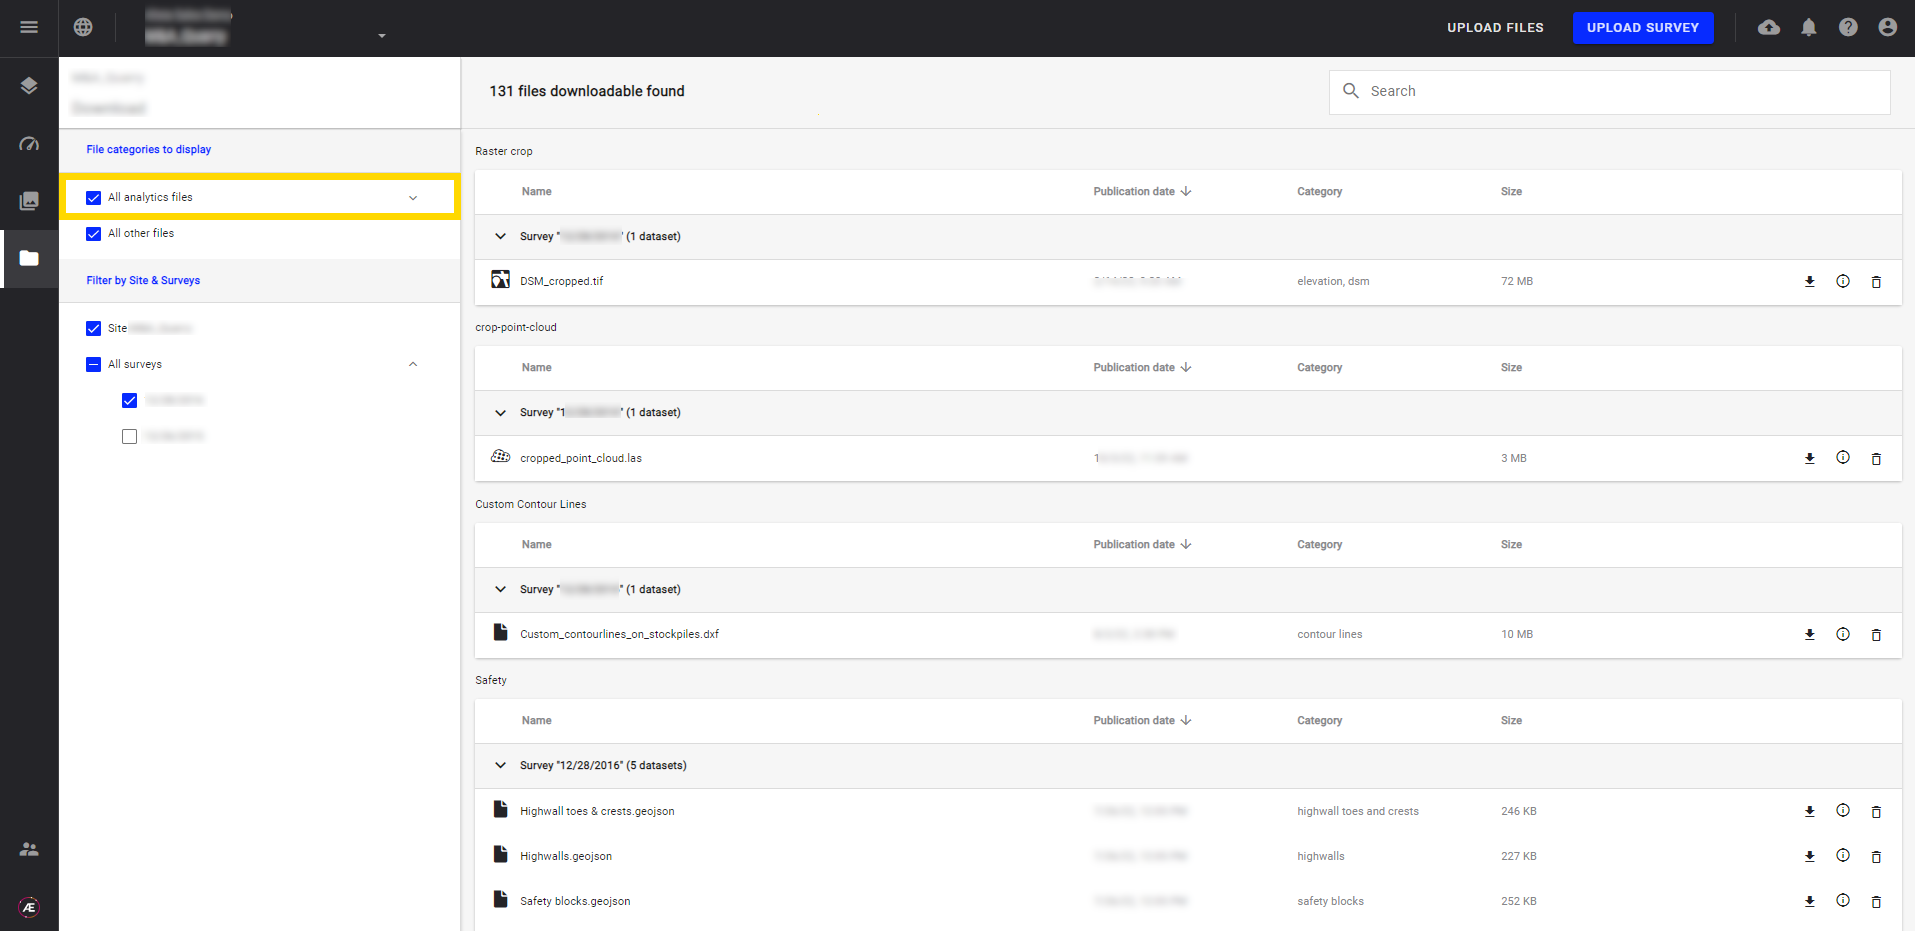
- All the files are organized and displayed by category on the left side. Generated Files by Aether Analytics are listed in the section "All Analytics files".
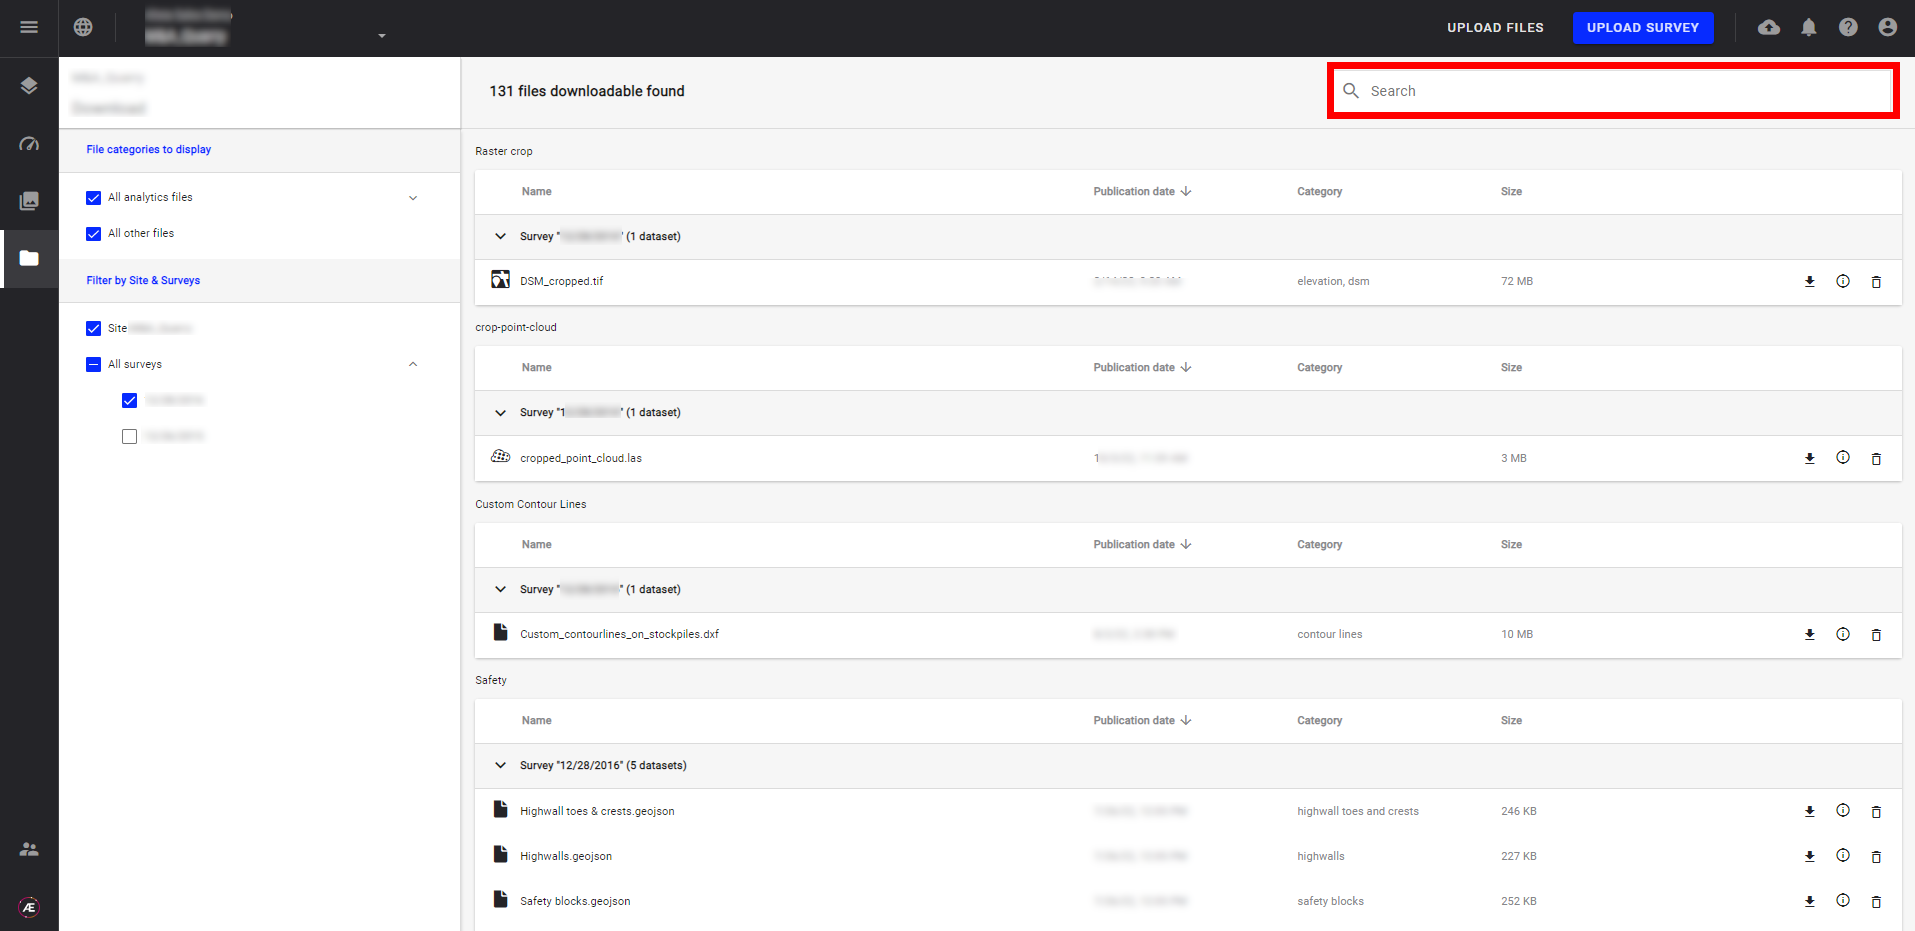
- Use the Search bar on the right top corner to look for a specific file.
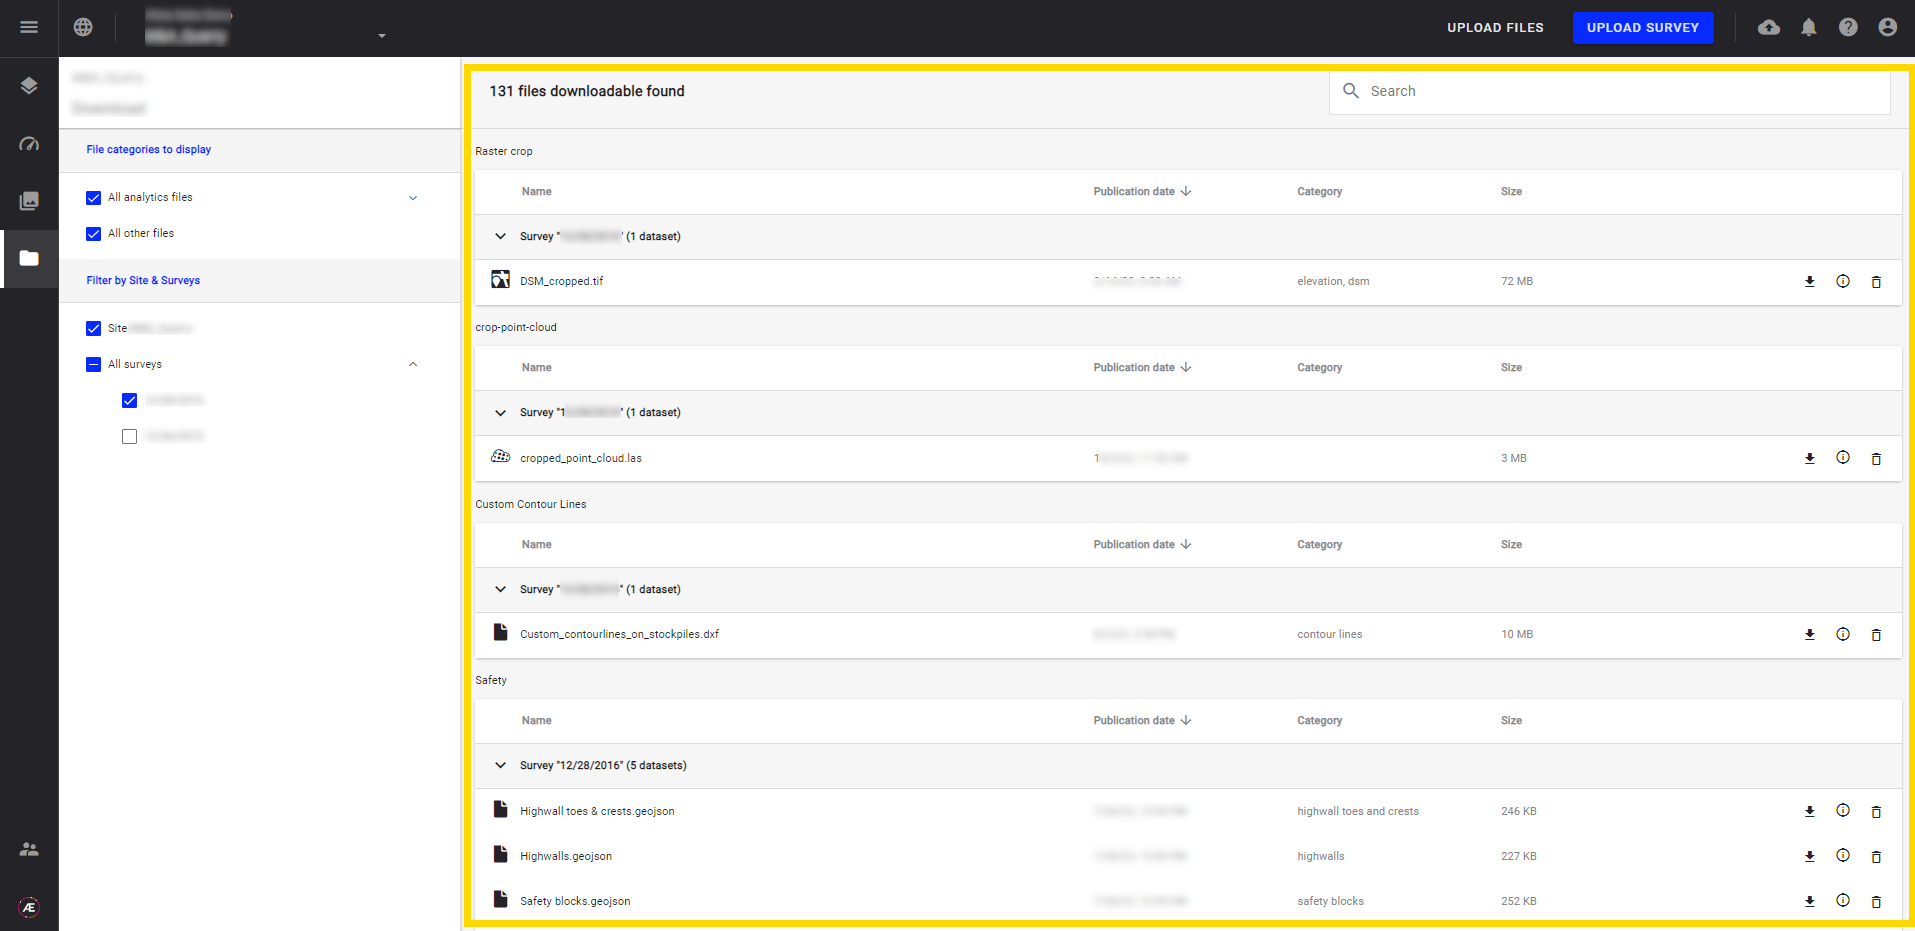
- According to the nature of the file, Export or Download it.
Info
Files that are not exportable don't have the option “Export”.
- Export: choose the format of the downloadable file as well as the CRS.
- Download: download the original file without any transformation.
3. Export/Download the data
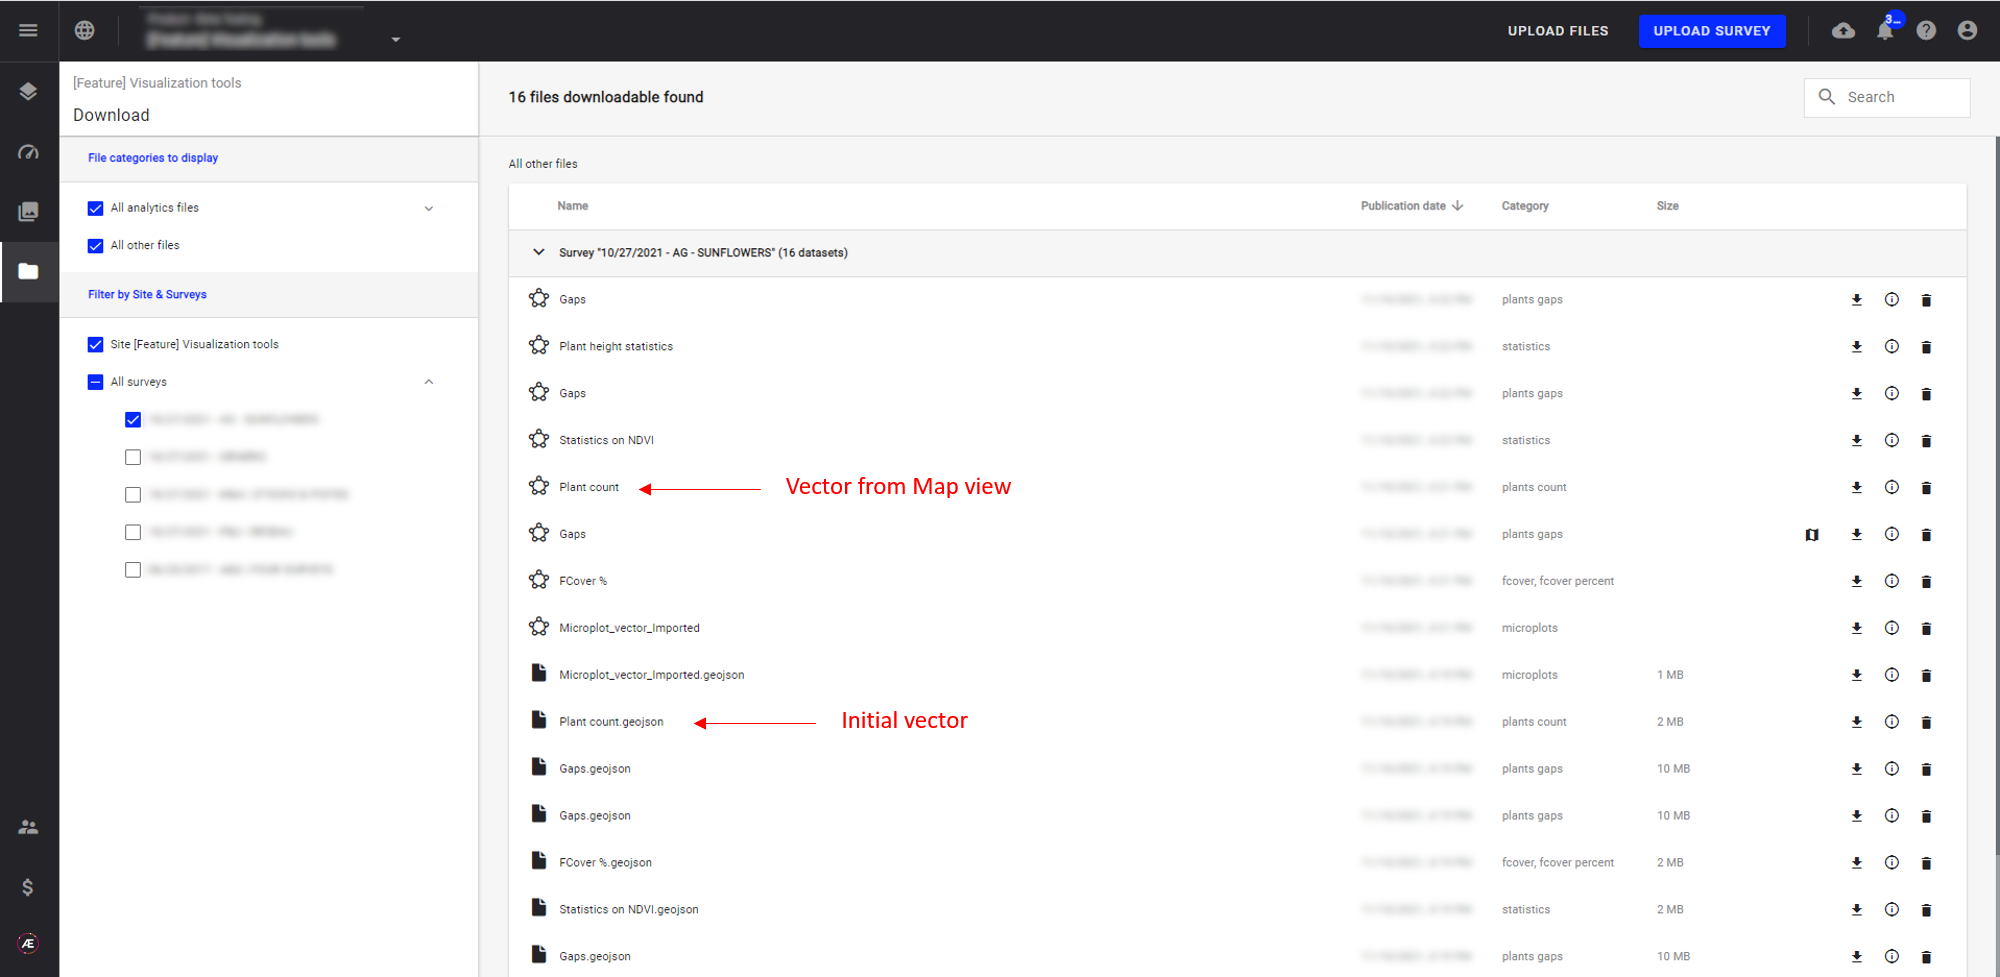
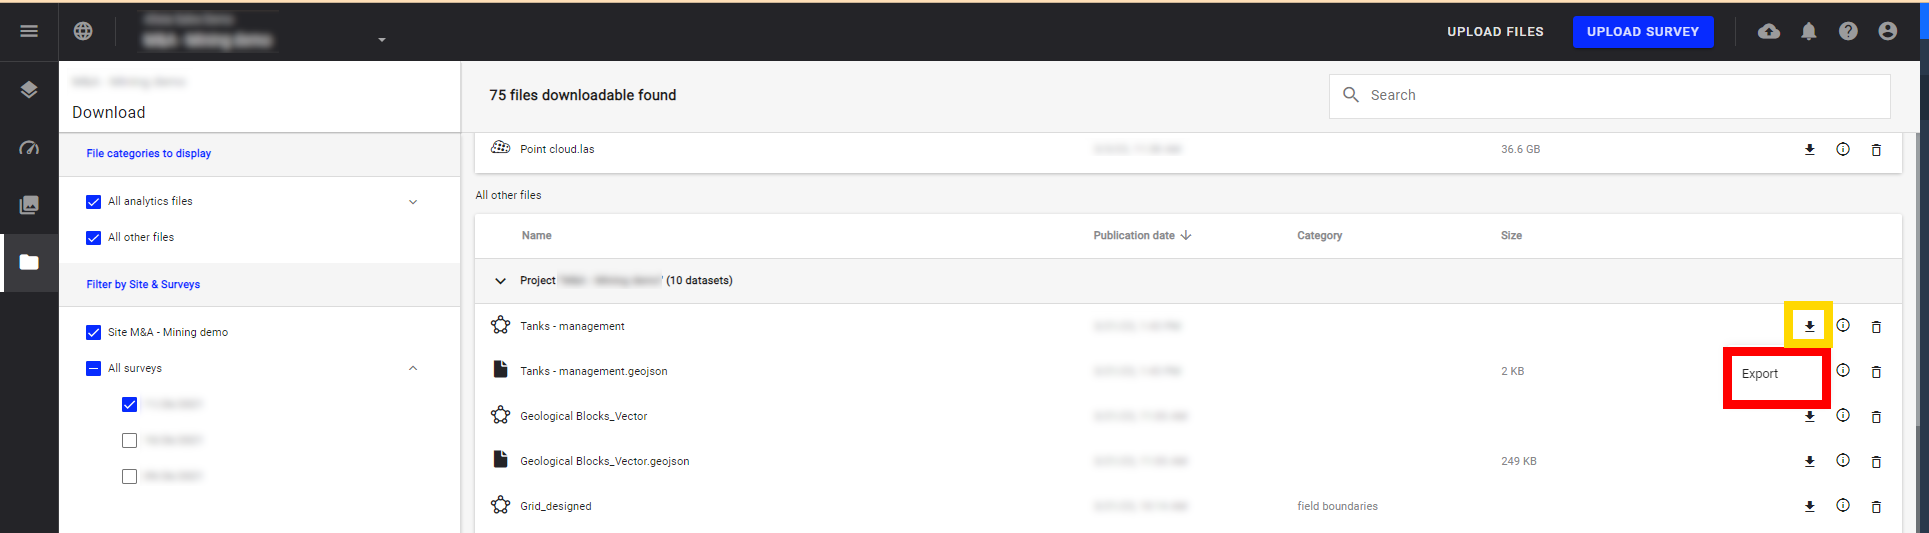
3.1 Export Vector files
ALL the vectors display on the Map view are available on the Download view.
For reliability purposes, these vectors have to be first “exported” before downloading. However, the Download option remains available on the information panel on the Map view.
Step 1 - In order to customize the file to download, click on the arrow icon and then on Export to choose a specific format and CRS.
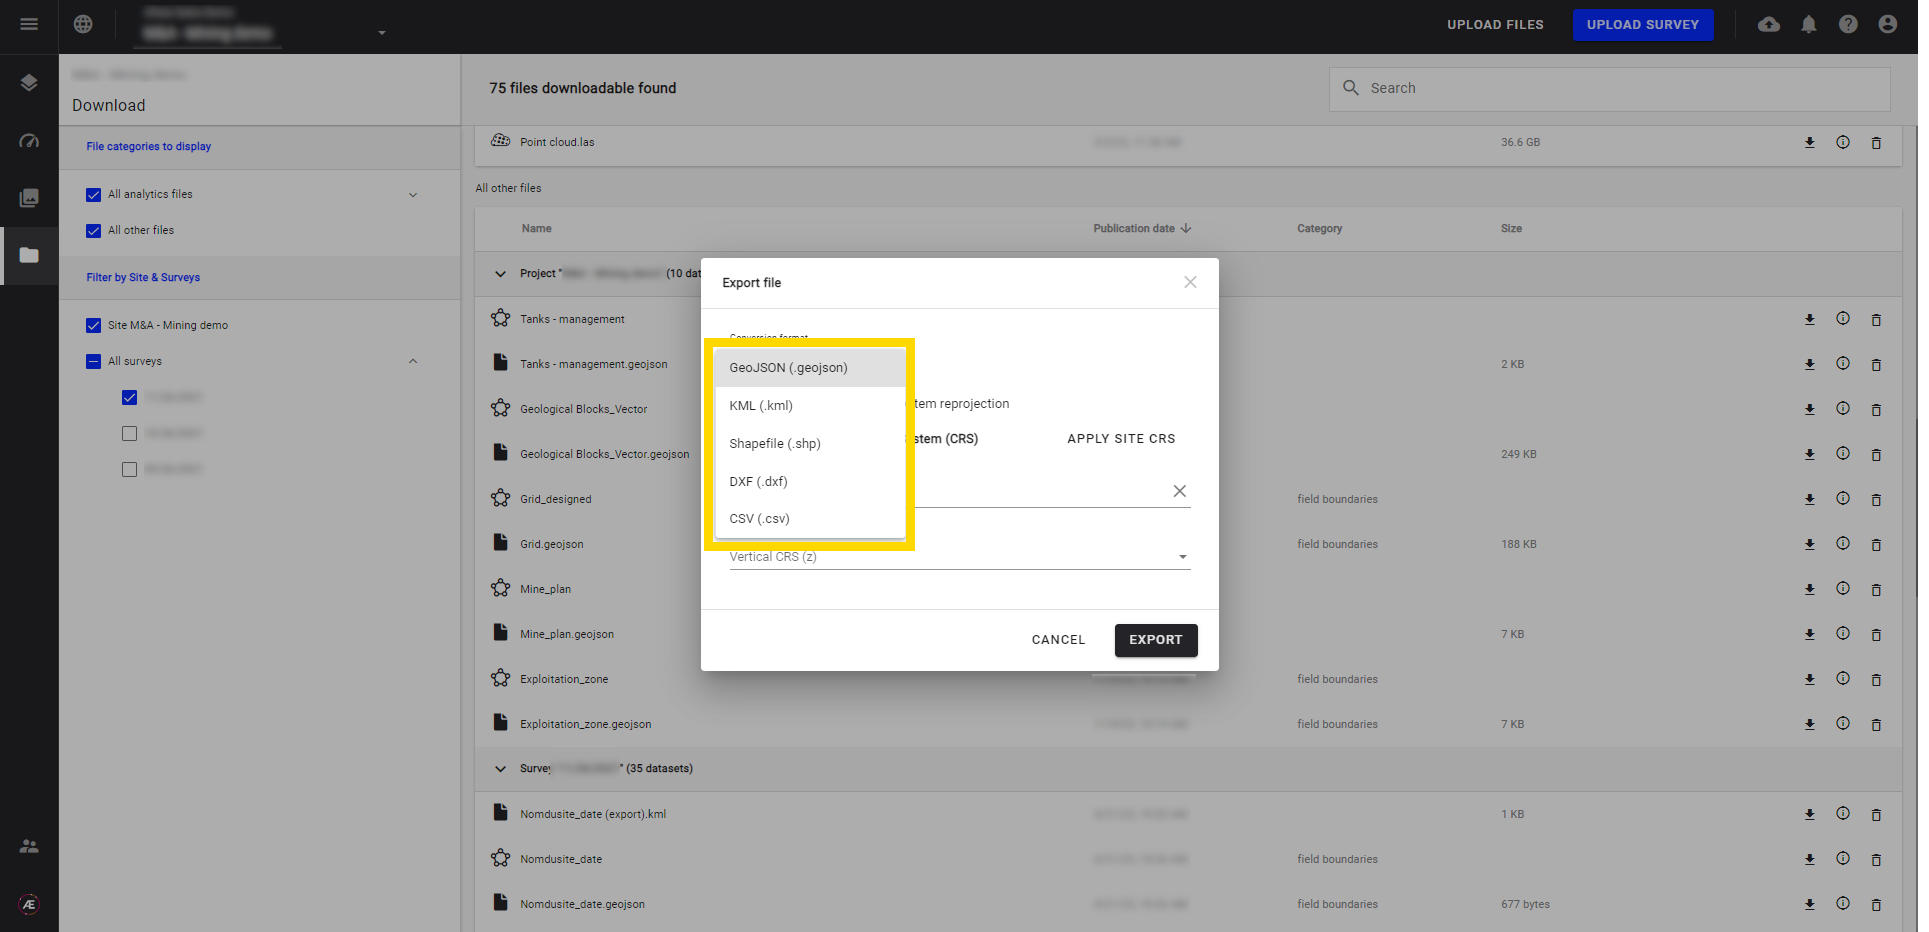
Step 2 - Choose a specific format in the list.
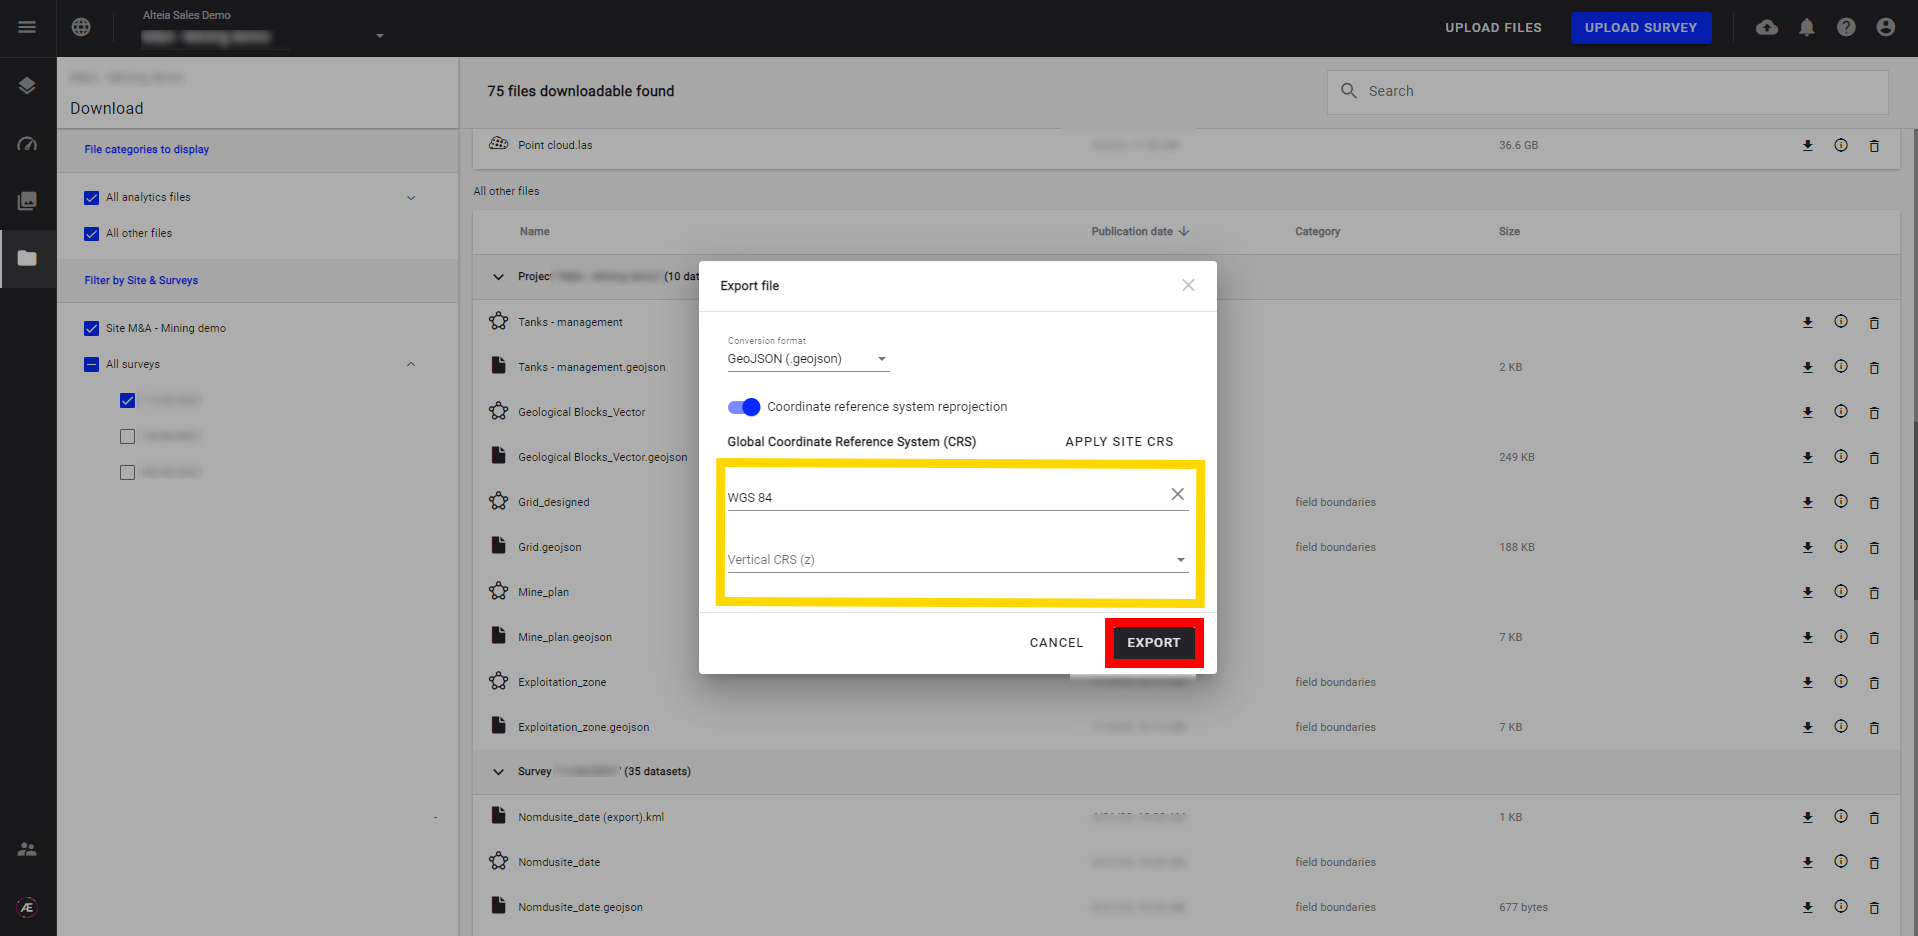
Step 3 - Choose the CRS and click on "EXPORT".
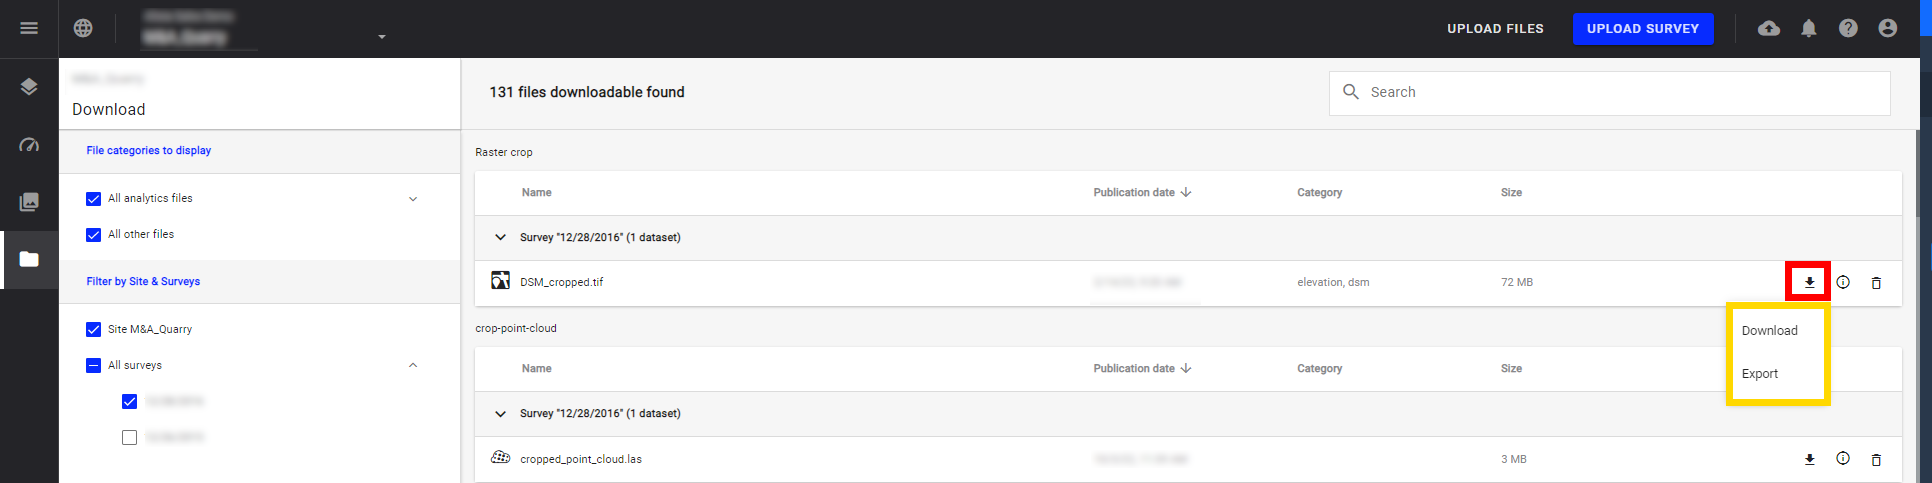
3.2 Export Raster files
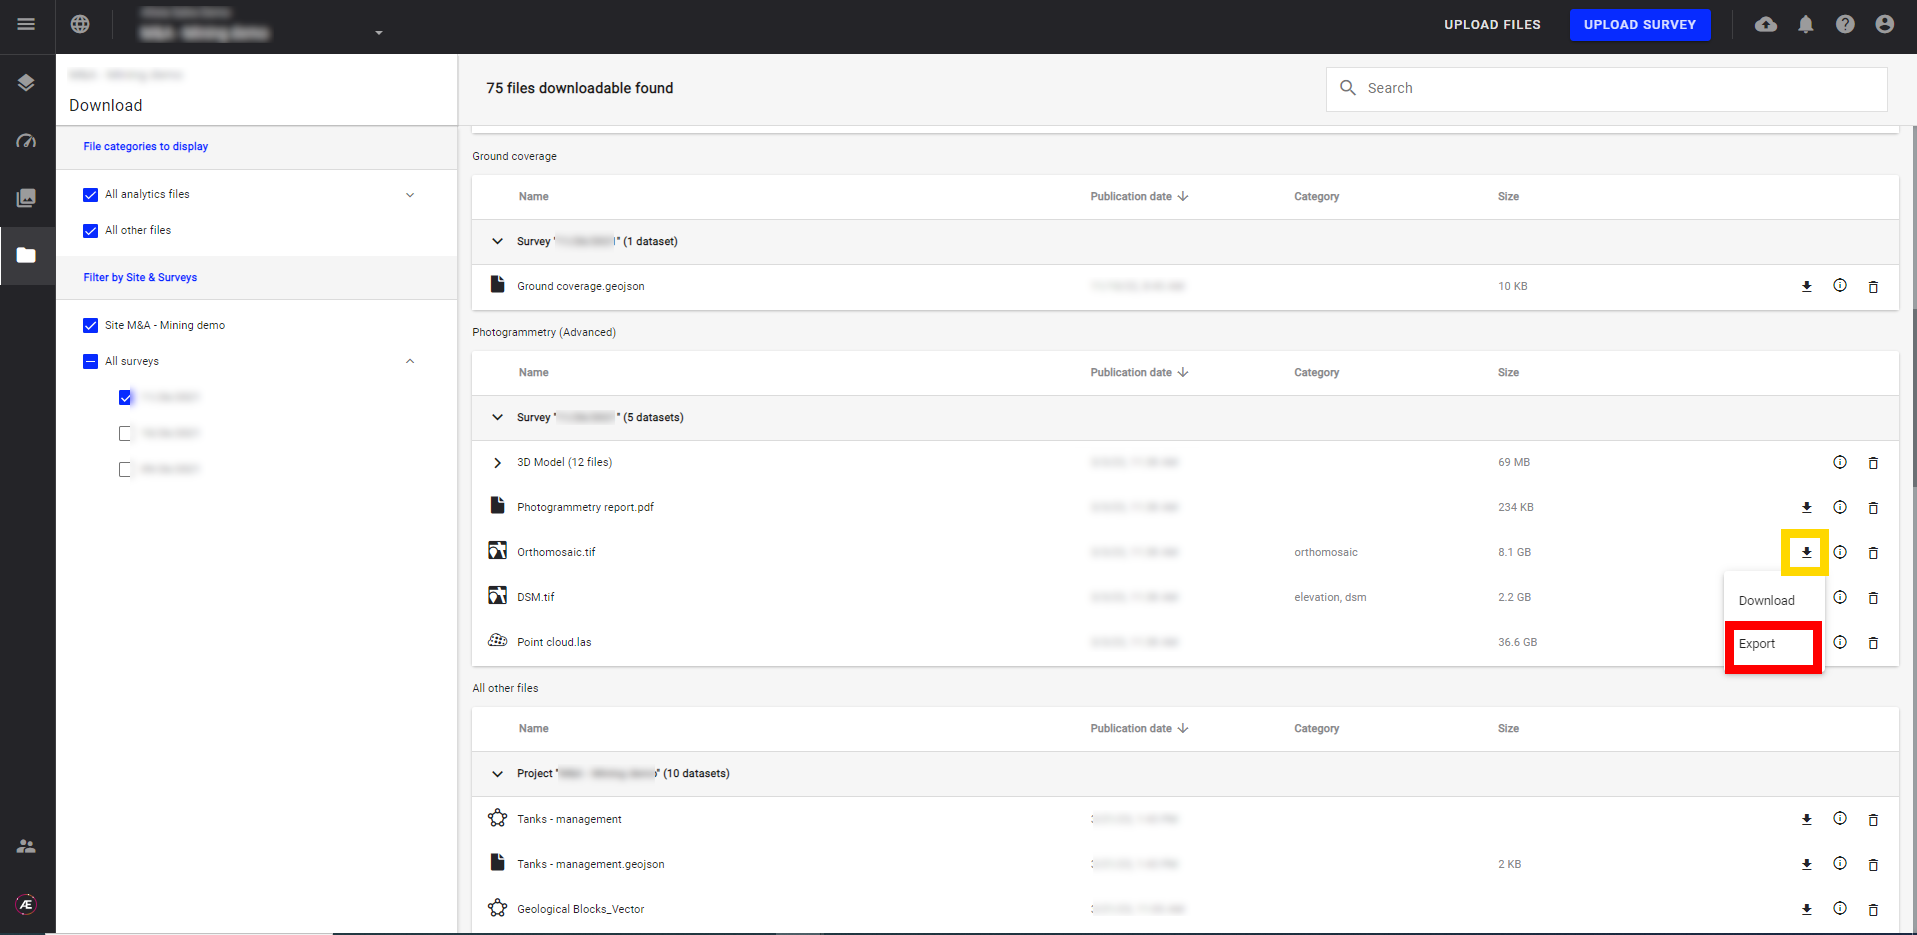
Step 1 - Click on the arrow icon and then on “Export”.
Step 2 - Choose a specific format in the list.
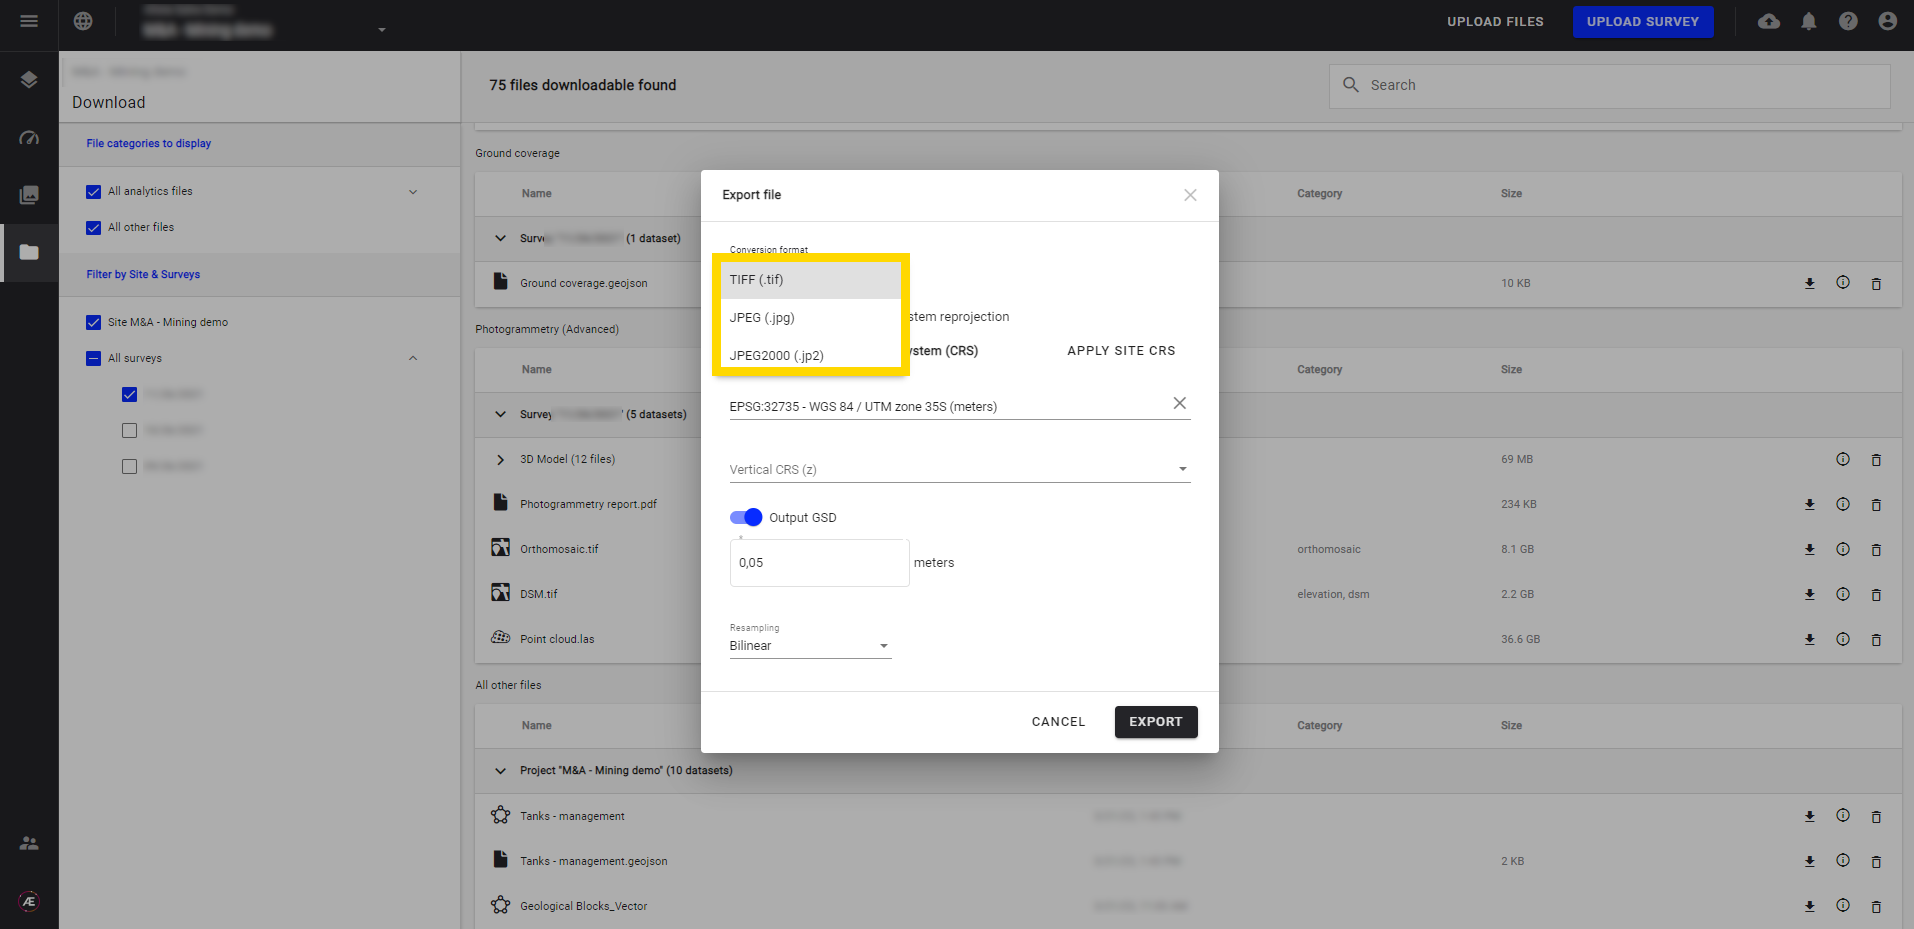
Step 3 - Choose the CRS, change the GSD* and resampling method**, and click on "EXPORT".
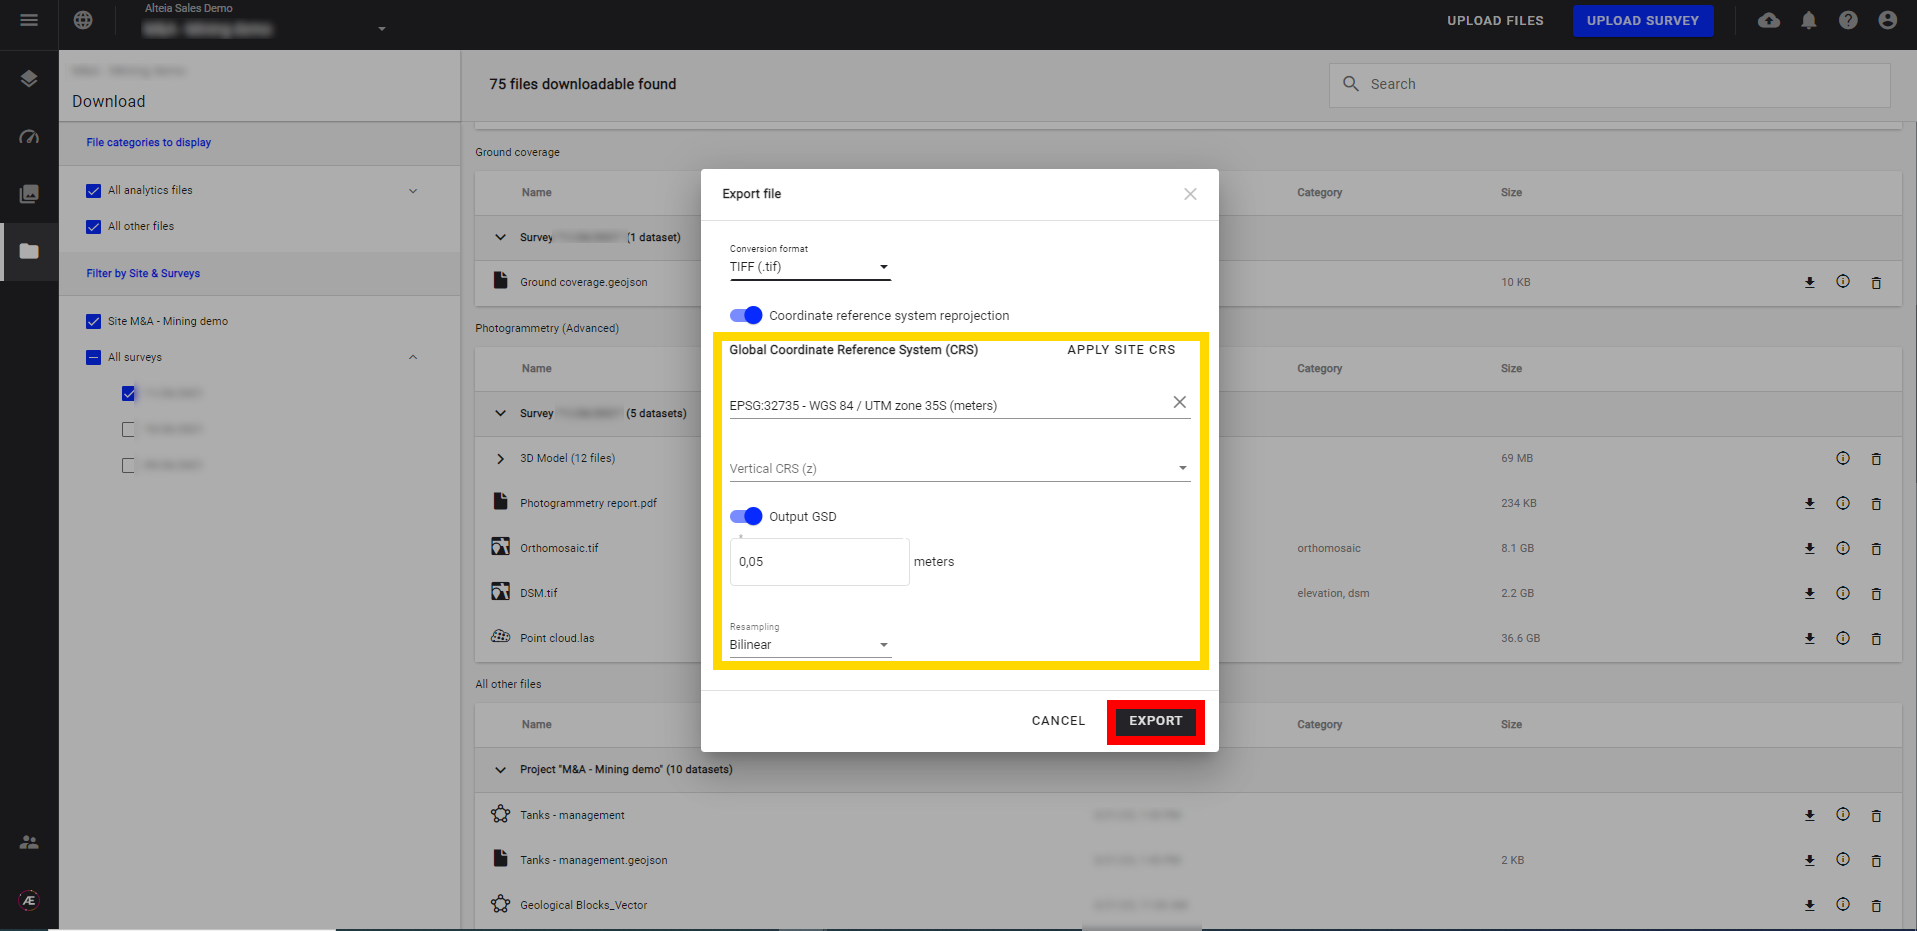
JPEG format supports a maximum image size of 65 000 x 65 000 pixels.
*The displayed is the rounded value of the original data.
** Here are the definition of the resampling methods :
-
Bilinear (default): Bilinear interpolation is a technique for calculating the values of a grid location based on four nearby grid cells.
It assigns the output cell value by taking the weighted average of the four neighboring cells in an image to generate new values.
It smooths the output raster grid, but not as much as cubic convolution. It’s useful when working with continuous data sets that don’t have distinct boundaries.
When should you use bilinear resampling?
Temperature gradients rasters, digital elevation models, and annual precipitation grids are examples of when to use bilinear interpolation
-
Near: The nearest neighbor technique doesn’t change any of the values from the input raster data set. It takes the cell center from the input raster data set to determine the closest cell center of the output raster. Processing speed, it’s generally the fastest because of its simplicity.
Because nearest neighbor resampling doesn’t alter any values in the output raster data set, it is ideal for categorical, nominal, and ordinal data.
When should you use the nearest neighbor resampling?
Often, you use the nearest neighbor for discrete data like land cover classification, buildings, and soil types that have distinct boundaries and their limits are discrete.
-
Cubic: Cubic convolution interpolation is similar to bilinear interpolation in that it takes the average of surrounding cells. Instead of using the four nearest cells, the output value is based on averaging the 16 nearest cells. As a result, processing time tends to increase for this method.
This method is generally used for continuous surfaces where much noise exists. Because it takes more neighboring cells compared to bilinear resampling, it’s good for smoothing data from the input raster grid.
When should you use cubic convolution interpolation?
Cubic convolution is ideal for noisy rasters like smoothing out a radar image or surface model.
- Cubicspline: Cubic spline resampling
- Lanczos: Lanczos windowed sinc resampling.
- Average: Average resampling, computes the weighted average of all contributing pixels.
- Mode: Mode resampling, selects the value which appears most often of all the sampled points.
- Max: Maximum resampling, selects the maximum value from all contributing pixels.
- Min: Minimum resampling, selects the minimum value from all contributing pixels.
- Med: Median resampling, selects the median value of all contributing pixels.
- q1: First quartile resampling, selects the first quartile value of all contributing pixels.
- q3: Third quartile resampling, selects the third quartile value of all contributing pixels.
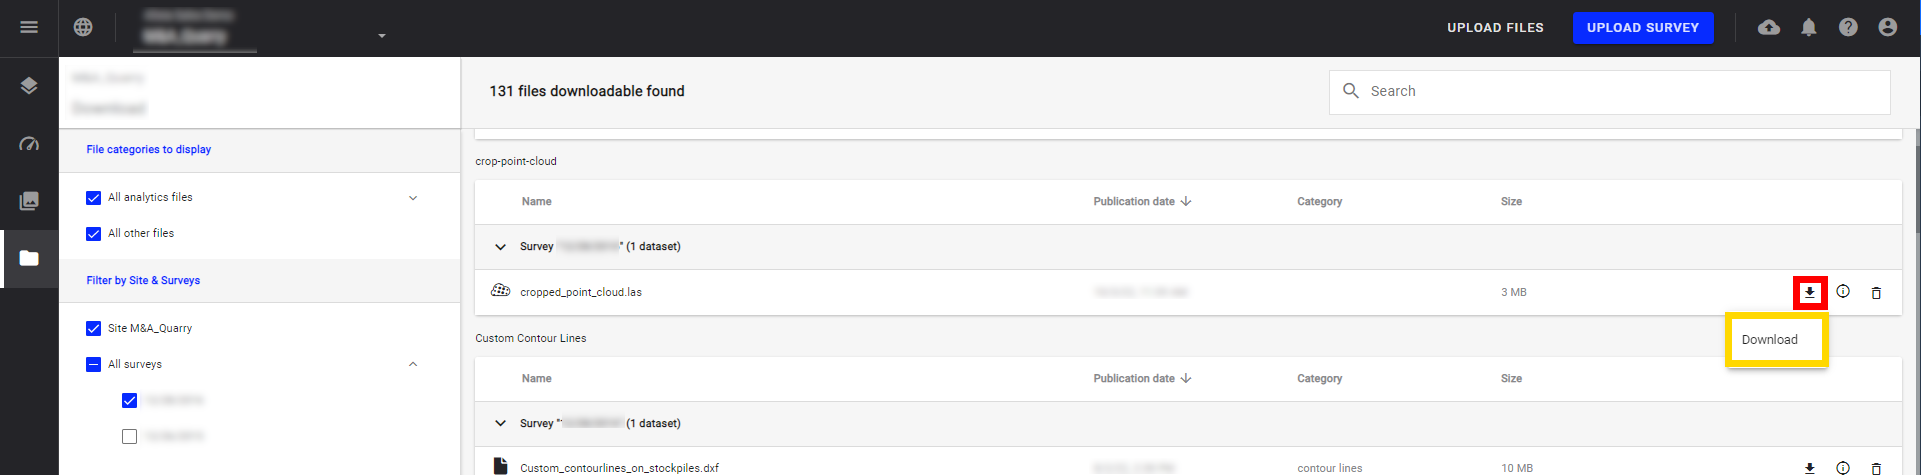
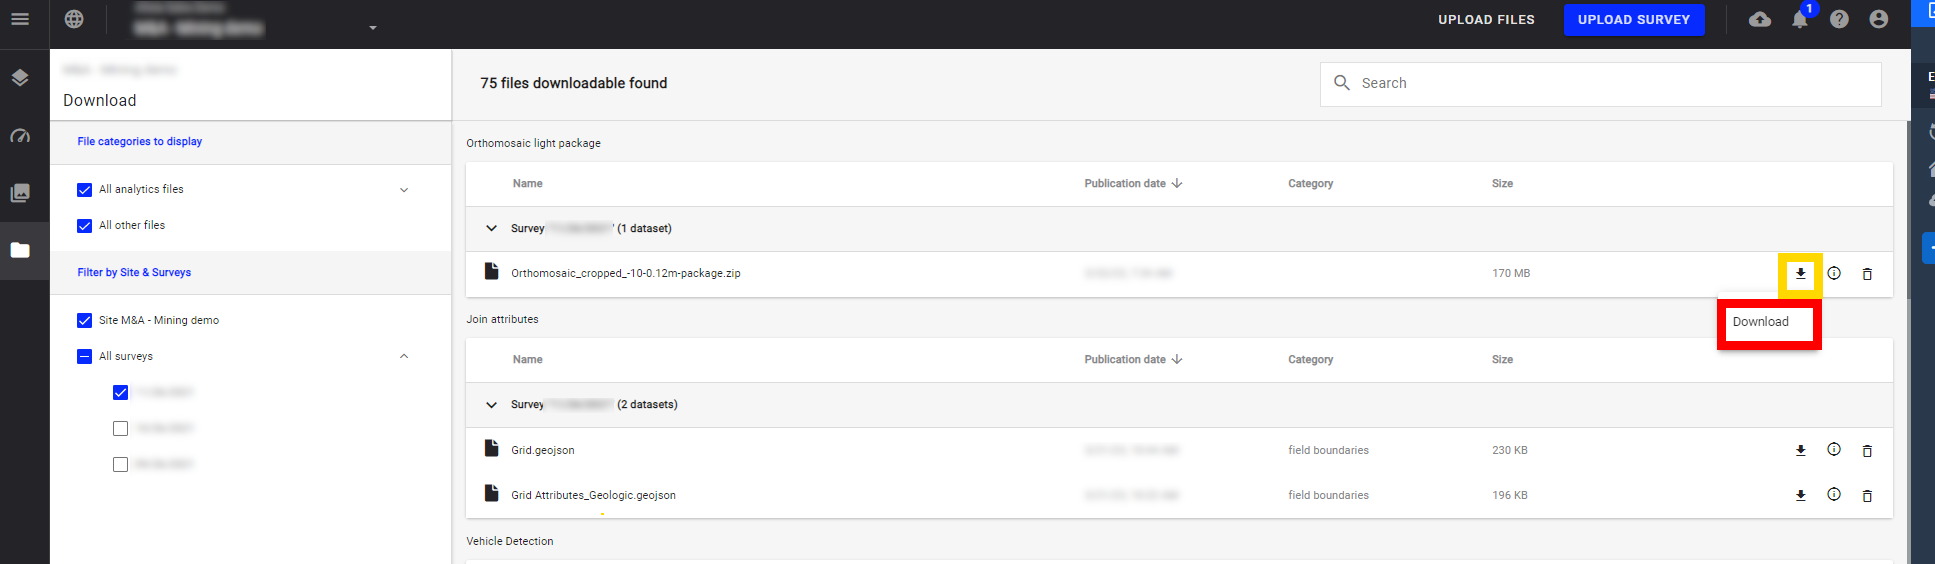
3.3 Download vector/raster files
Download the raster or vector files corresponding to your initial files directly from the download menu by clicking on the arrow icon then "Download".
Info
You can also download vector files from the layer view. To do this, click on the desired vector file. On the information panel that opens on the right side of your screen, click on the 3 dots near the name of the vector. Finally, click on "Download".
