Navigation
1. Introduction
You can think of Aether as an operating system for the visual data in your organization. This page provides information about how to navigate and find the tools and resources required to work effectively in this operating system.
This page provides information about the sidebar and topbar that serve as a home base for moving around the platform. You'll also learn about the help & support options available to you while working in Aether. Finally, your Aether account will allow you to sort out your public user and platform settings.
2. Home Page
2.1 Topbar

| (1) | "Company" menu: Drop-down menu to select a company. A company is the highest-level entity in Aether and often refers to the company, client, or business unit you work for. As a user, you can view only one company at a time but you can belong to multiple ones. |
| (2) | "CREATE A PROJECT" button: Opens a pop-up window to create a new "PROJECT" within an existing "Company", see Project Creation. |
| (3) |
"UPLOAD SURVEY" button: Opens a pop-up window to upload a "Survey" for an existing "Project" within a "Company". Within a "Project", there may be one or more "Surveys" to which you will add data or images. See Upload Survey. |
| (4) | "Uploads" button: To see the progress of the file upload. |
| (5) | "Notifications" button: All notifications are centralized here. A number is displayed and incremented as new notifications are received. See Notification Center. |
| (6) | "Help" button: Opens a menu to access the Knowledge Base, Contact Support, and visit Alteia’s website. |
| (7) | "Profile" button: Opens a menu to give access to the profile connected, change password options, and log out. See User Profile Edition. |
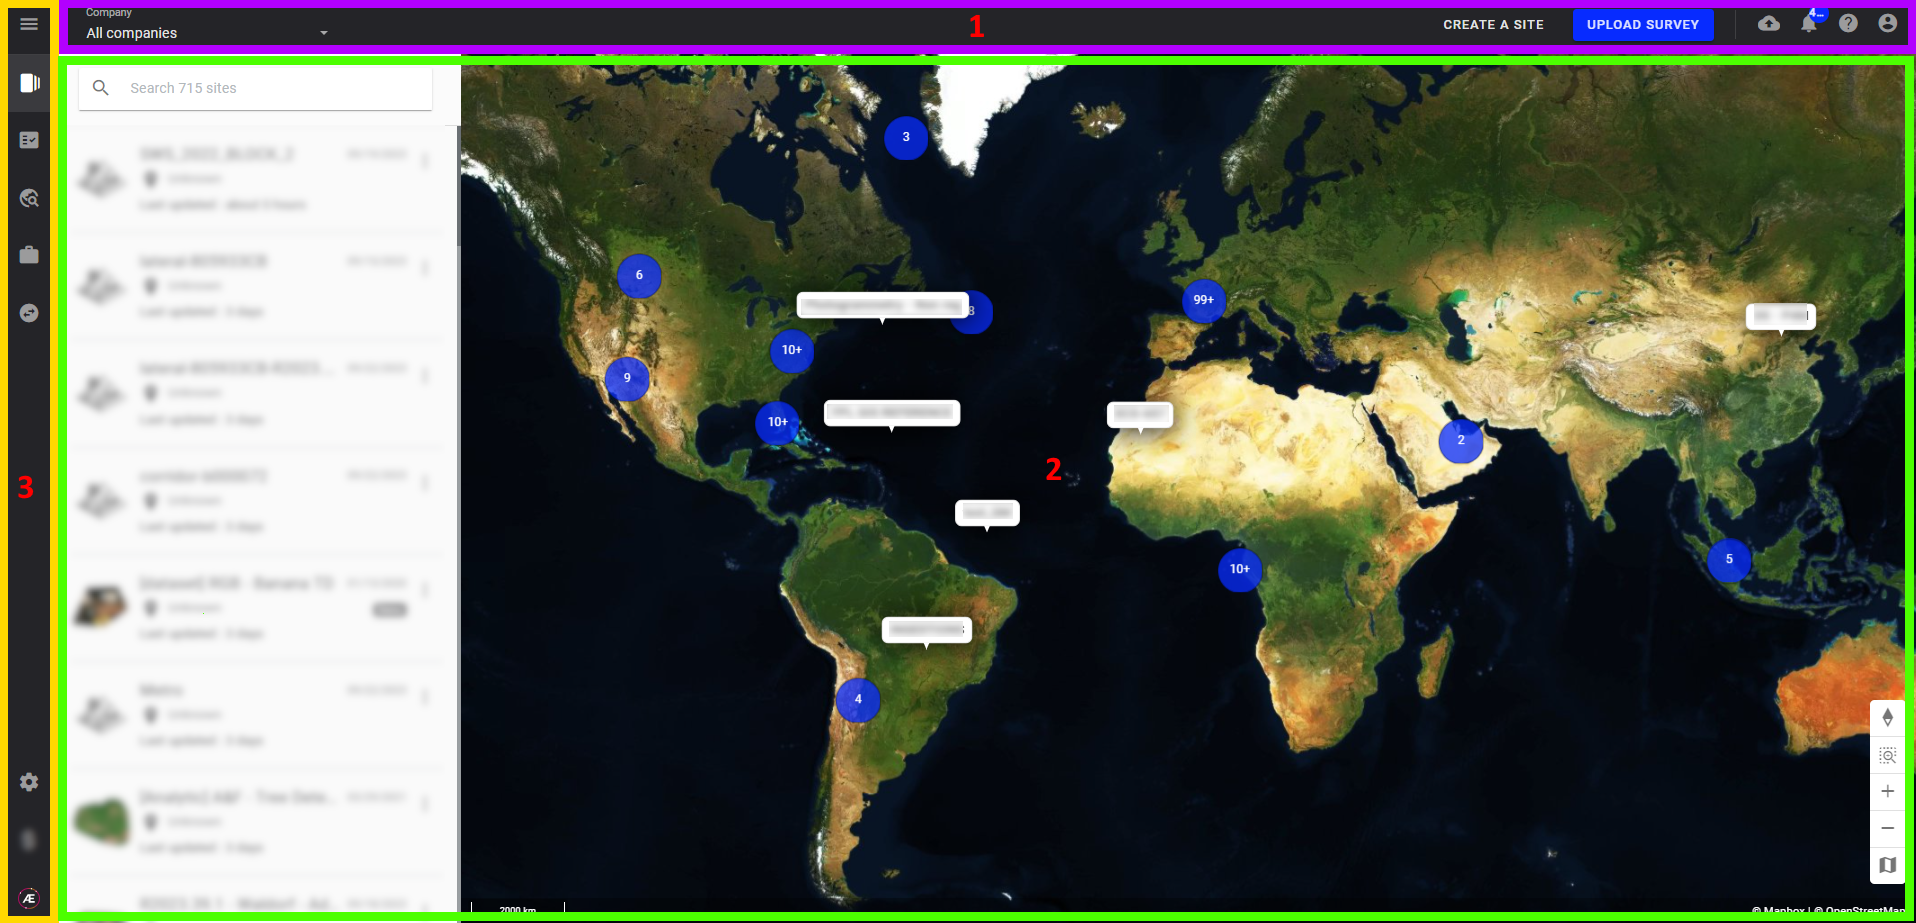
2.2 Map view
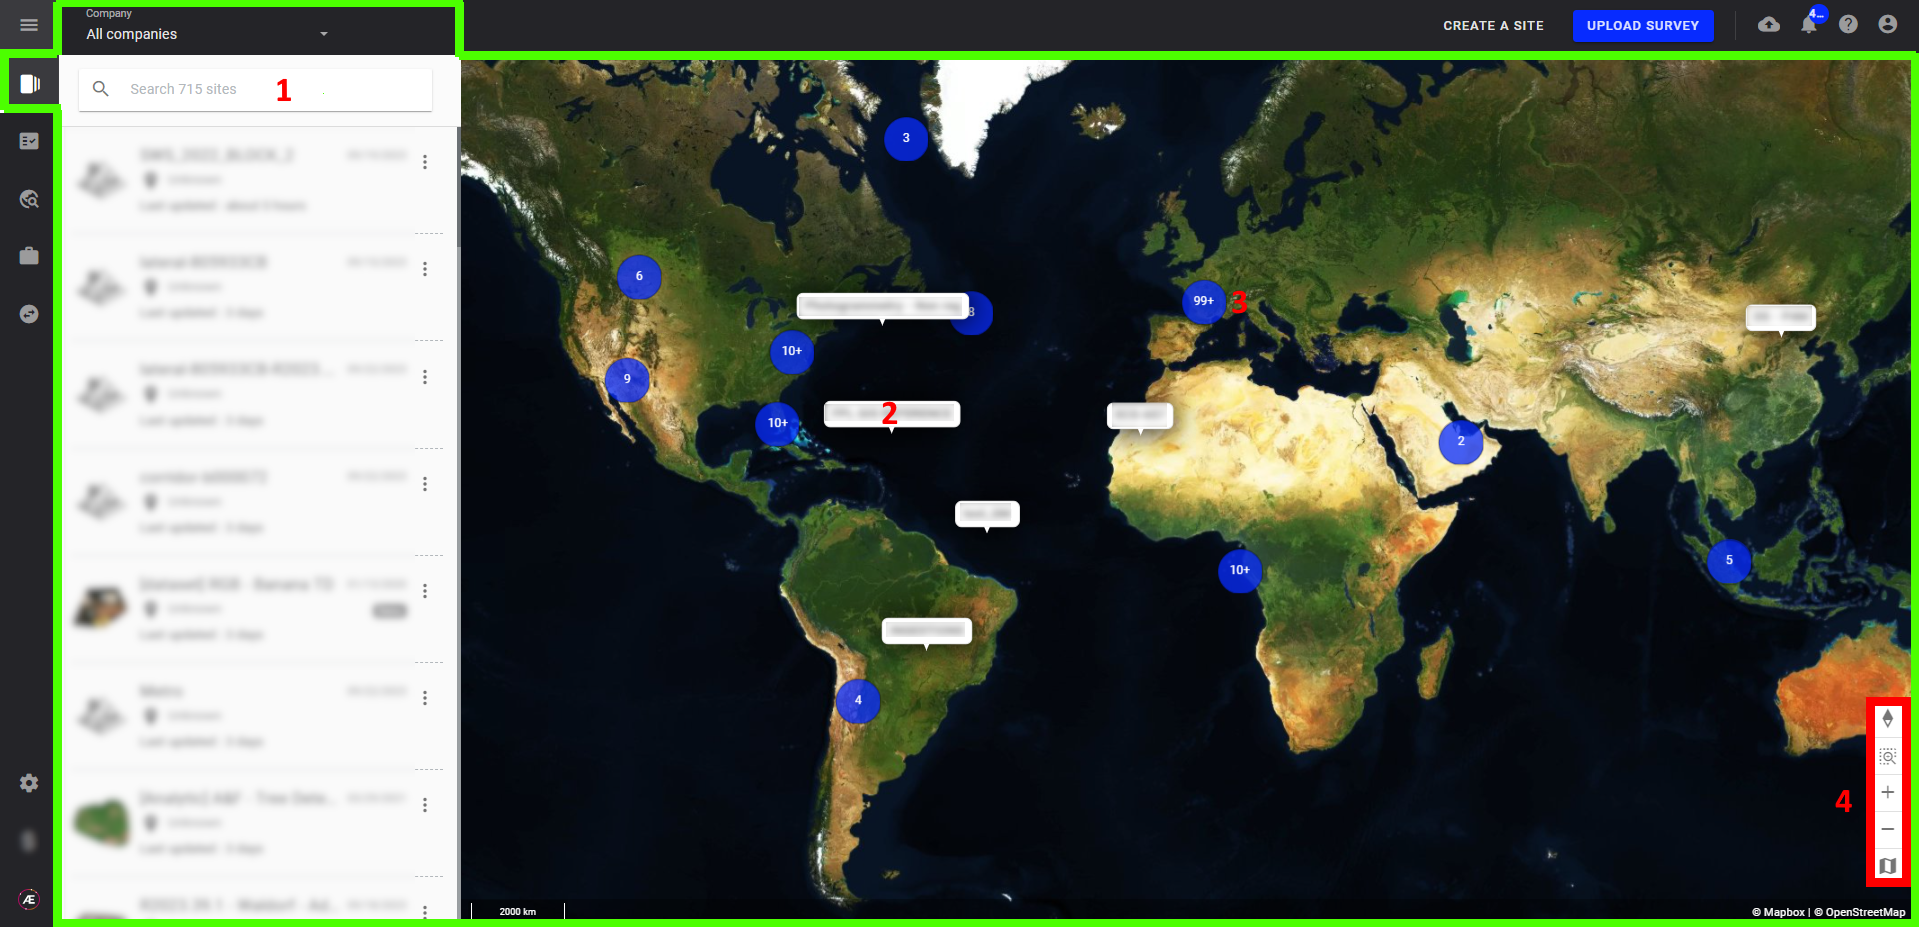
The Map View gives an overview of all the company’s project(s) as a list and their location on the map.
Use the mouse wheel to zoom in and out of the map, and left-click to navigate the map
(1) Project Search menu: Find the project you want to work on and click it to open it.
(2) Project name and location display: Click on it to zoom in and open the project.
(3) Projects grouped in close proximity: Click on a circle to zoom in on the location. If you zoom in enough, you will be able to separate the locations and get the view described in point (2).
(4) Map toolbar which allows you to:
- Resetting displayed orientation to North
- Zoom in on a selected area
- Zoom in (+) and zoom out (-)
- Select ground layer
2.3 Sidebar
The left menu allows access to the different business modules.
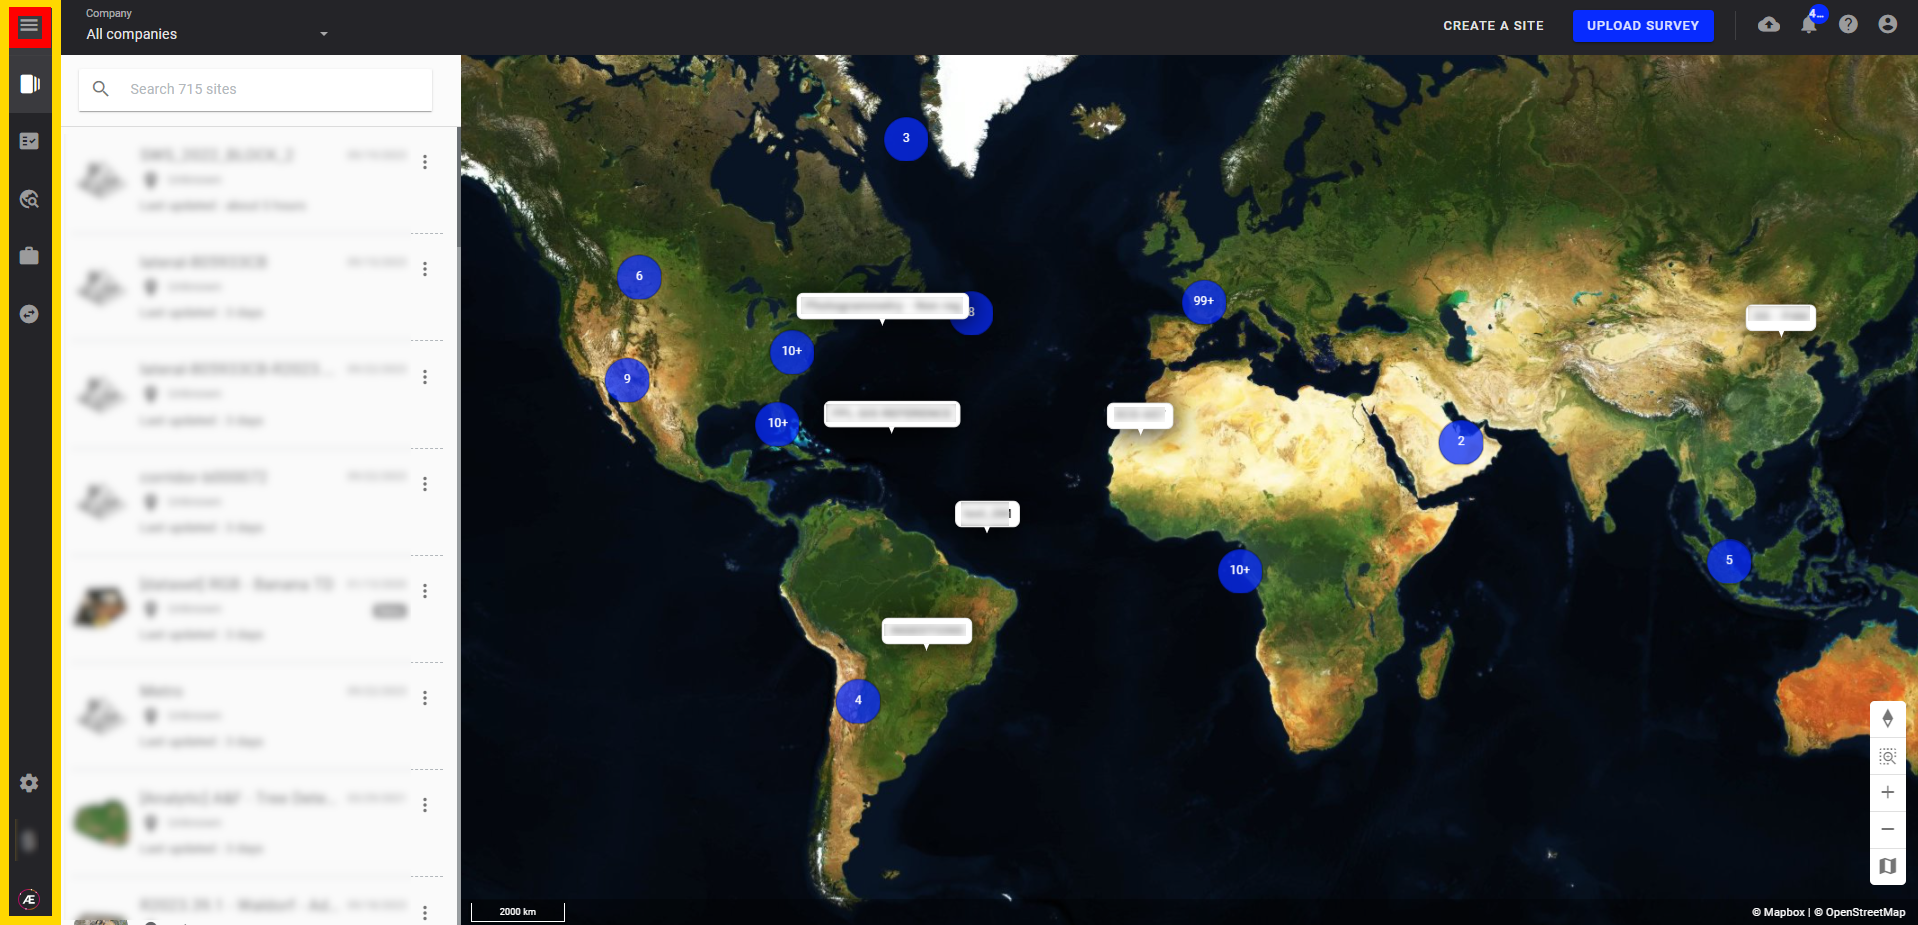
By expanding this menu you can visualize the names of the different business modules.
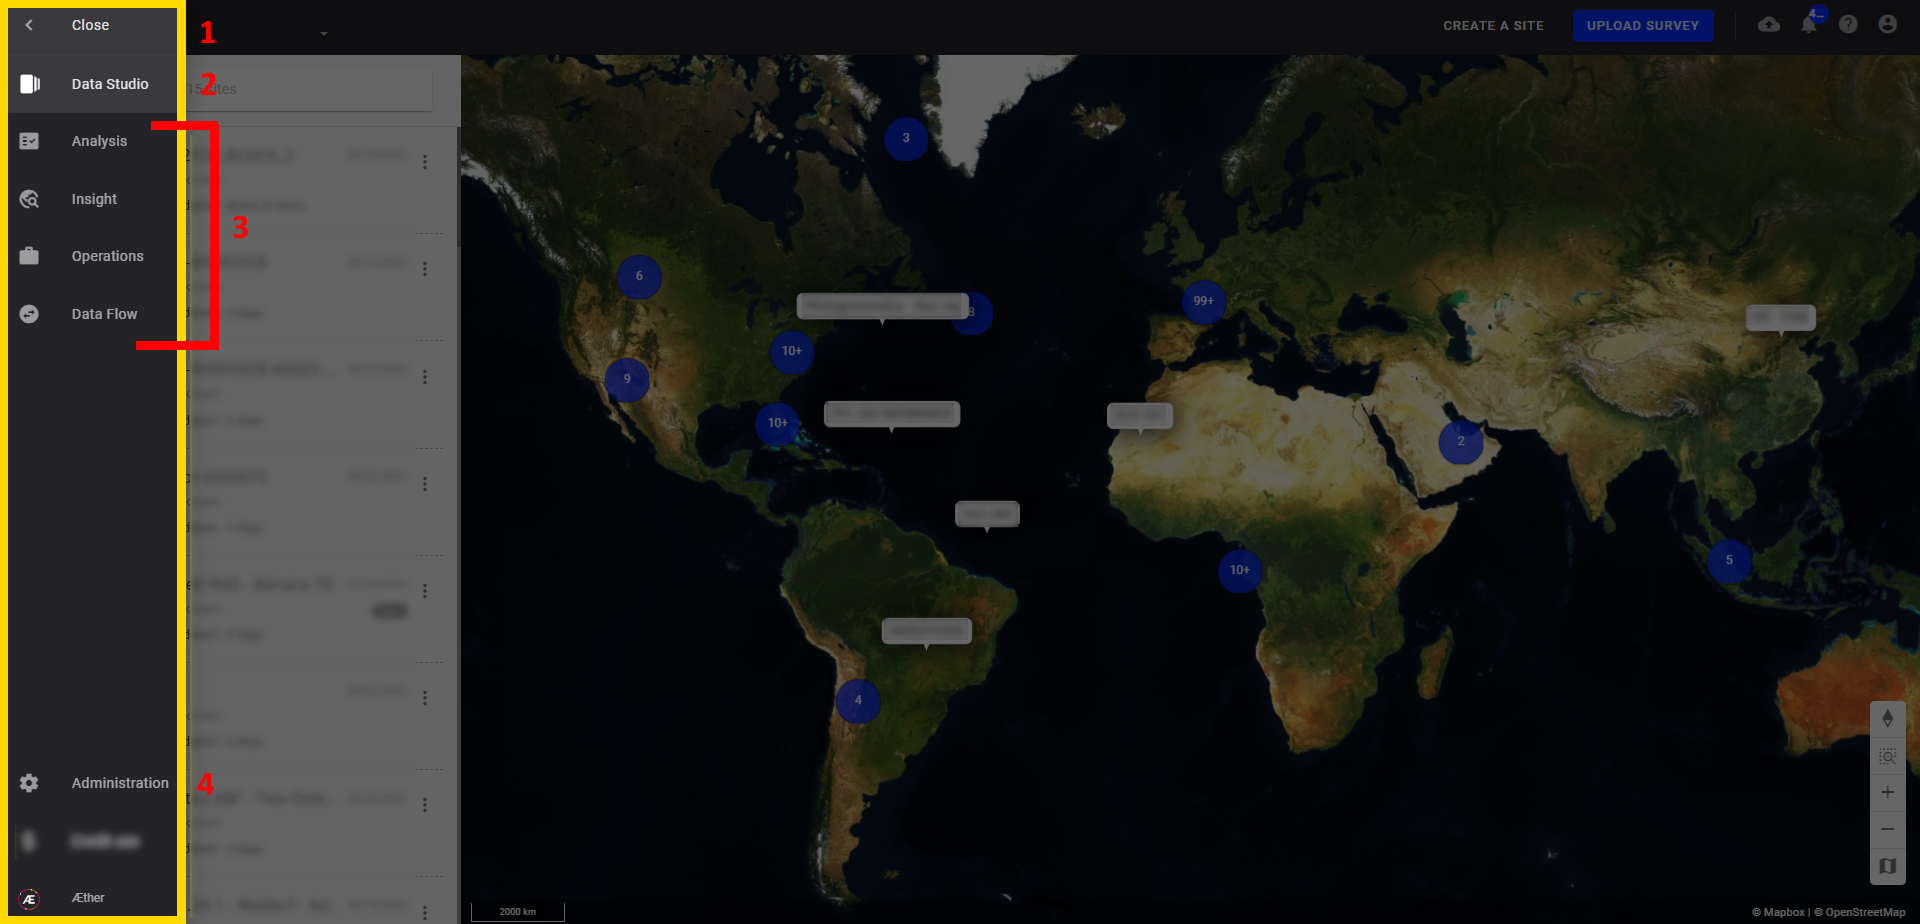
(1) "Close" button: Retract the menu.
(2) "Data Studio" button: Gives access to the Map View module.
(3) Access specific modules (non-exhaustive list).
(4) "Administration" See User Management.
3. Data Studio main page
Select a project to access this screen.
3.1 Topbar

| (1) | "Return" button: To return to the starting page. |
| (2) |
"Company" menu: Where Company and Project selected are displayed. Note: It is possible, thanks to a drop-down menu, to change the visualized project. |
| (3) |
"Survey" menu: Change between surveys on the same project. Note: The last survey of the project is displayed by default. The 3-dot menu allows deletion and renaming surveys. It also allows showing information about the project. |
| (4) |
"UPLOAD FILES" button: Upload to the project or to a specific survey of different types of files. See Manual File Upload. |
| (5) |
"UPLOAD SURVEY" button: Opens a pop-up window to upload a "Survey" for an existing "Project" within a "Company". Within a "Project", there may be one or more "Surveys" to which you will add data or images. See Upload Survey. |
| (6) | "Uploads", "Notifications", "Help" and "Profile" buttons: See paragraph 2.1 |
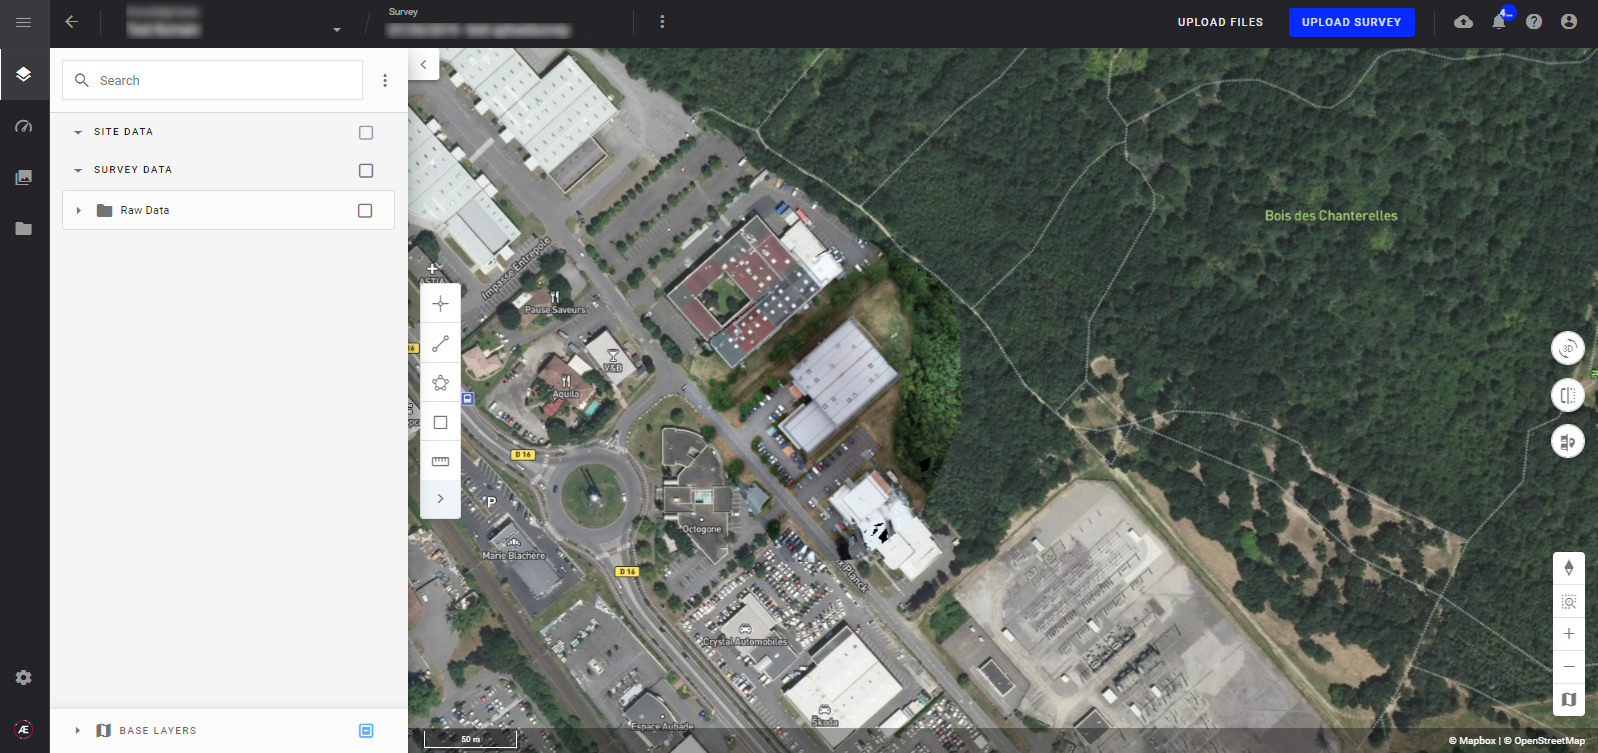
3.2 Survey Zone
The survey zone corresponds to the work area covered by a raster.
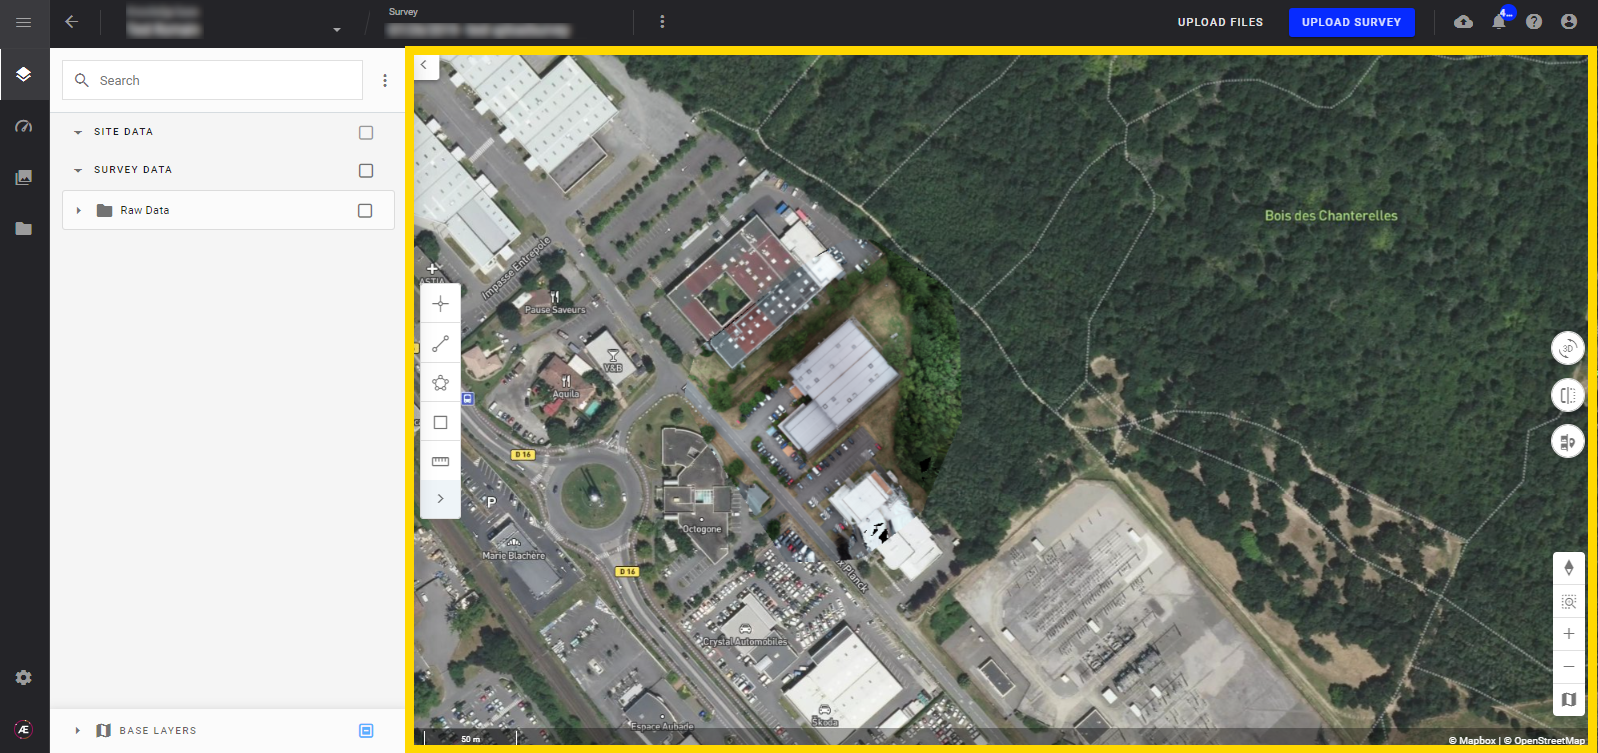
3.3 Annotations tools
- An annotation is a vector that can be created both in 2D or 3D view and then displayed on top of a raster layer. It is used to highlight or mark specific aspects such as lengths and perimeters and used to calculate areas and volumes. See Annotation Creation and Edition.
3.3 Sidebar
- With an open project, new buttons appear.
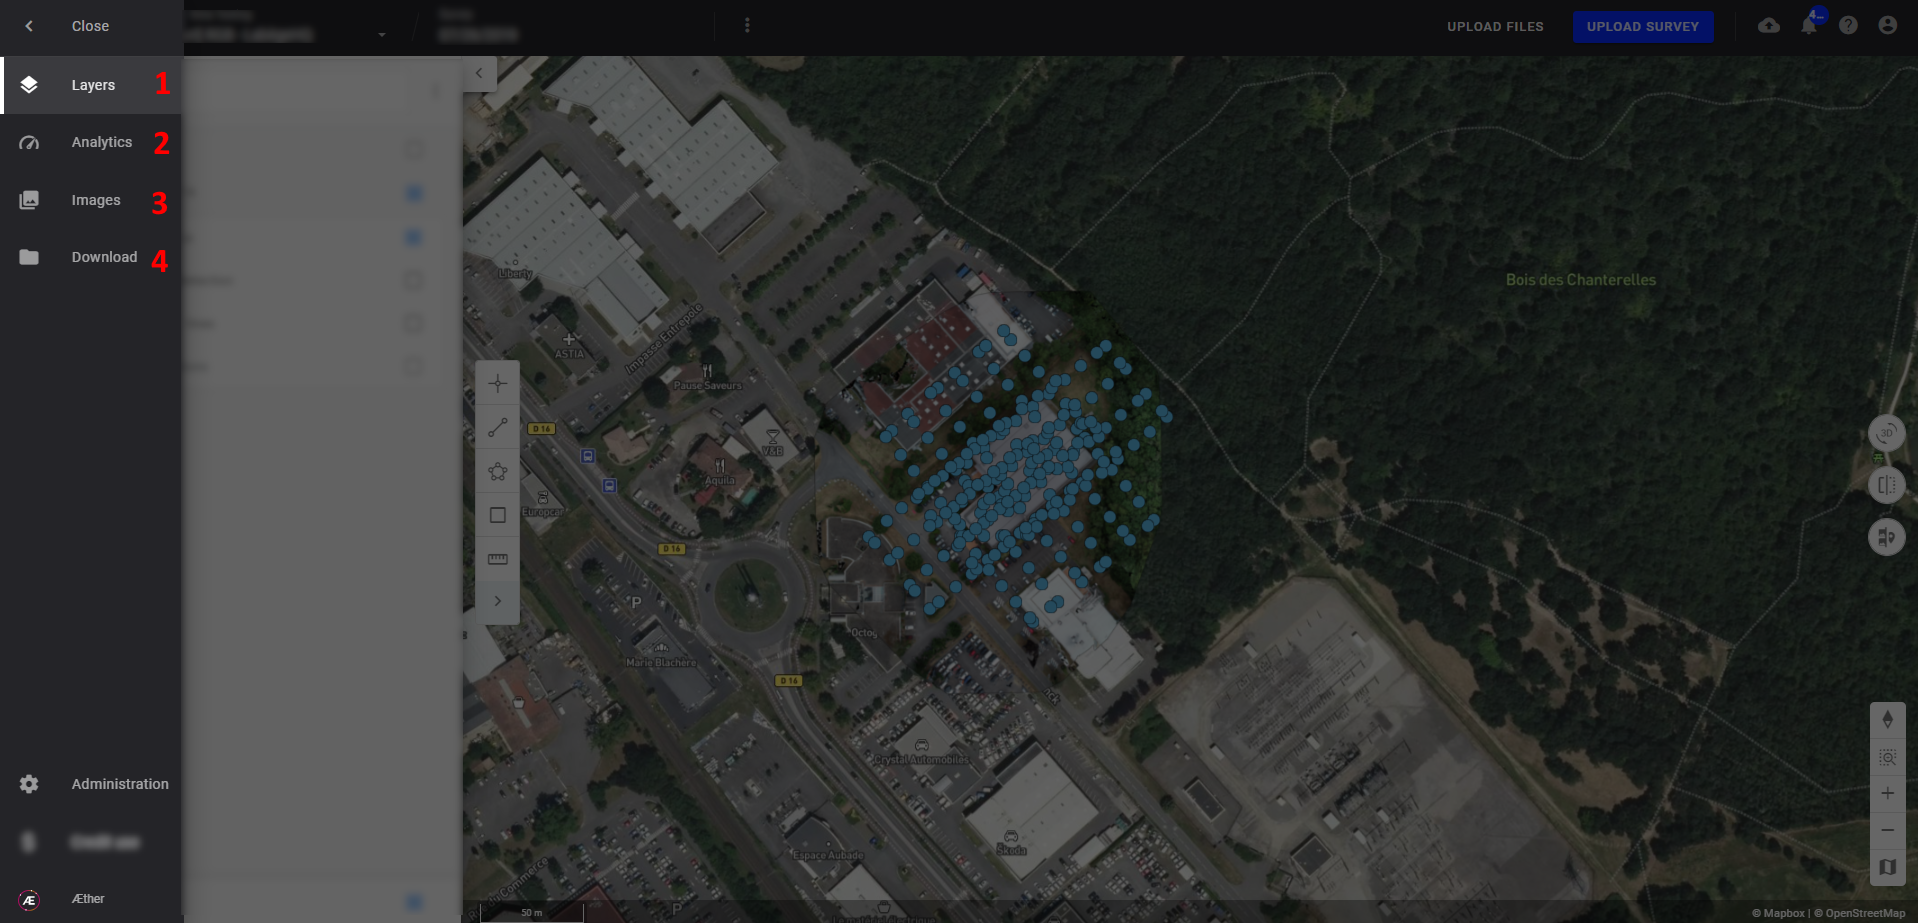
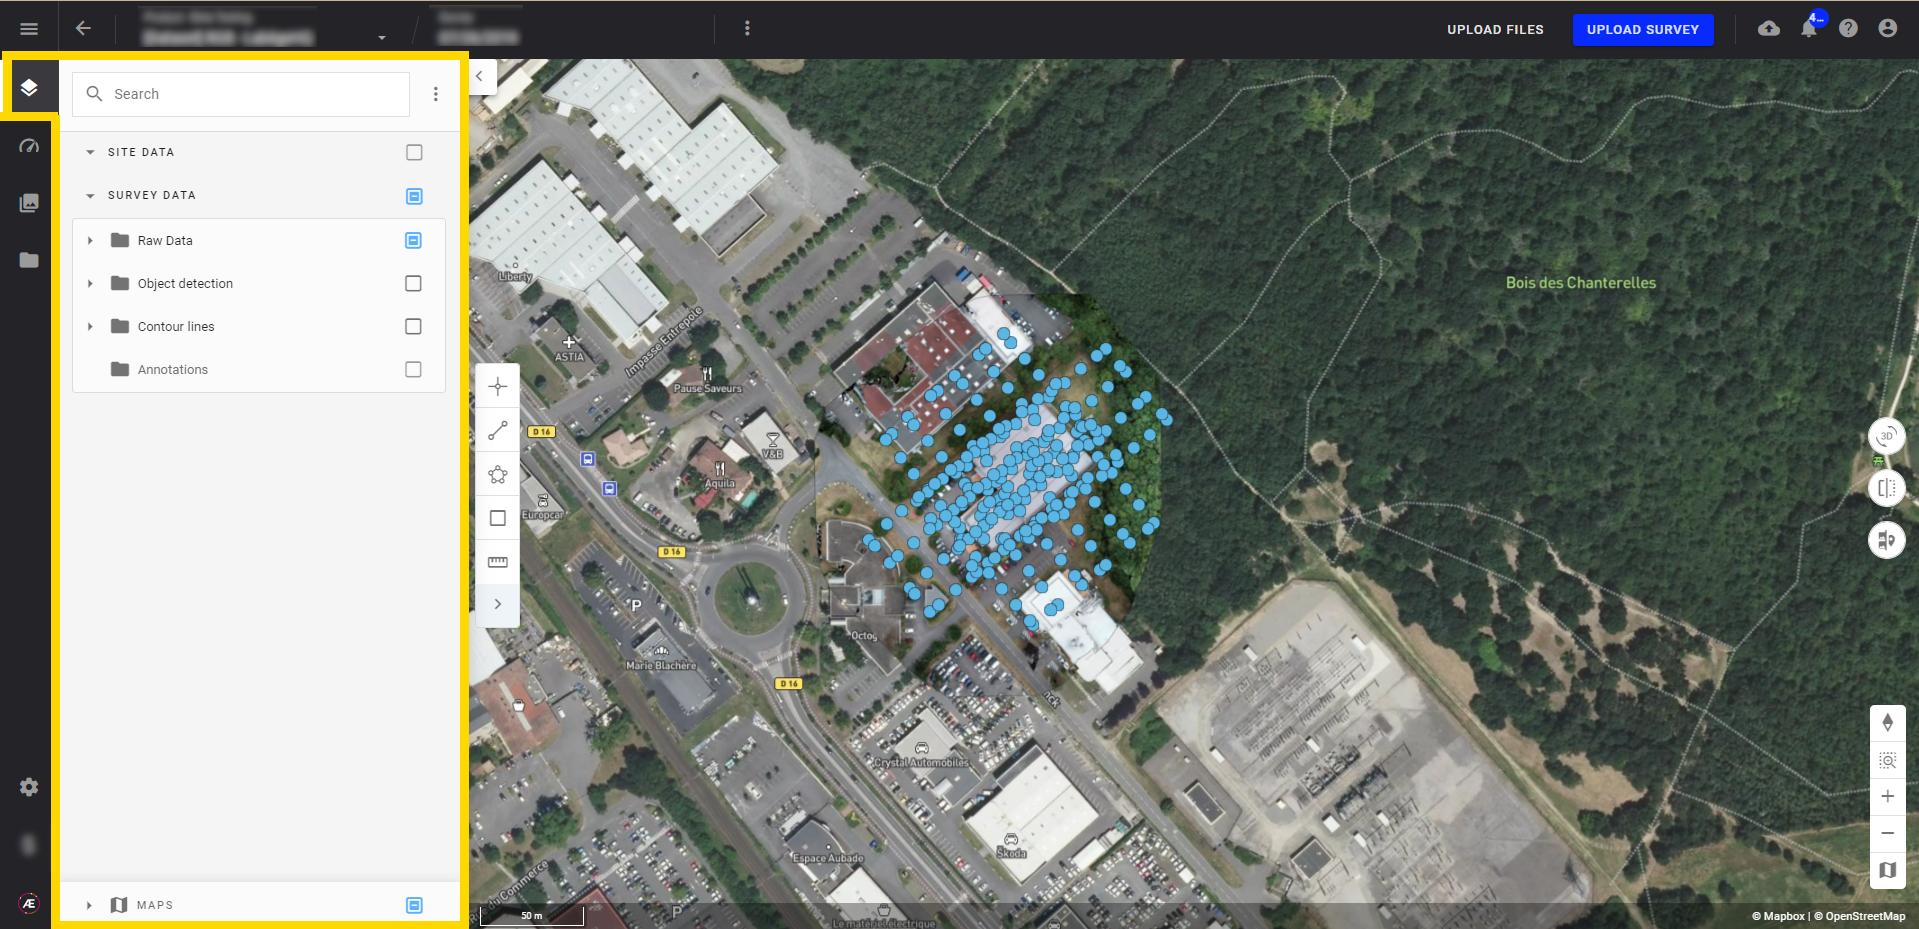
(1) "Layers" Menu: To organize and manage the layers linked to your project or survey. See Browsing and Arranging Layers.
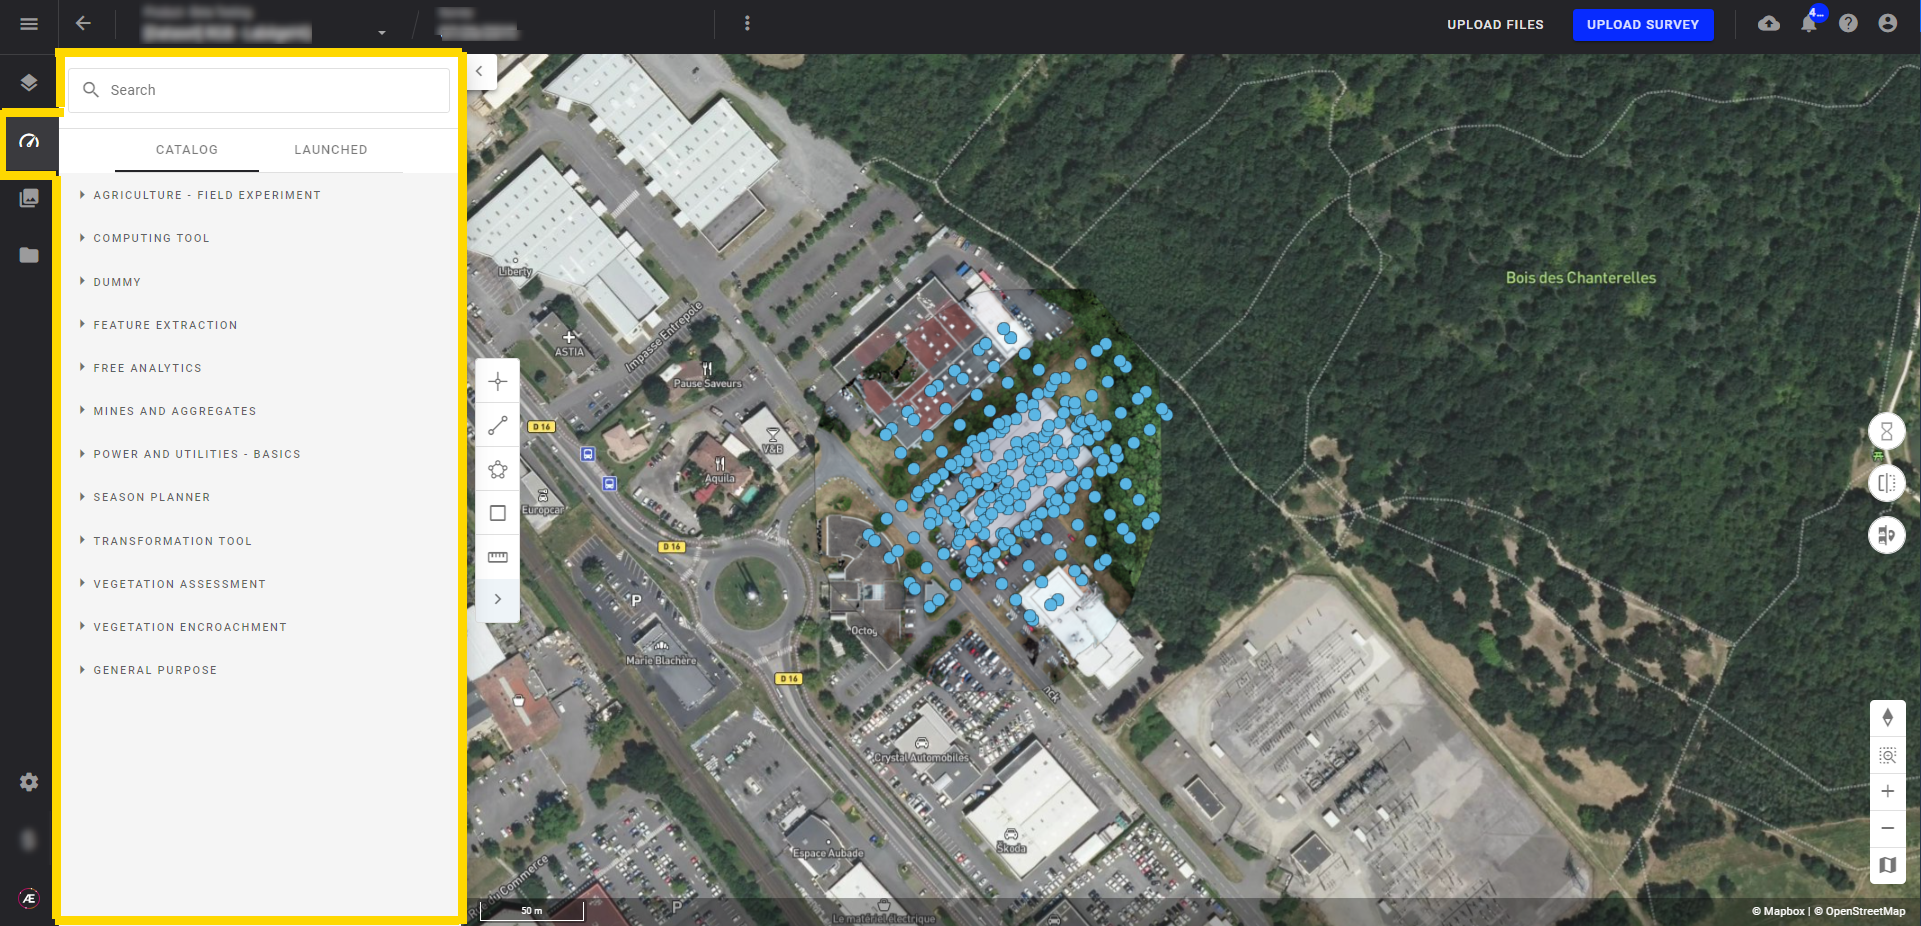
(2) "Analytics" Menu: Gives access to a large choice of analytics to launch grouped by sector of activity. See more by searching them on the Knowledge Base.
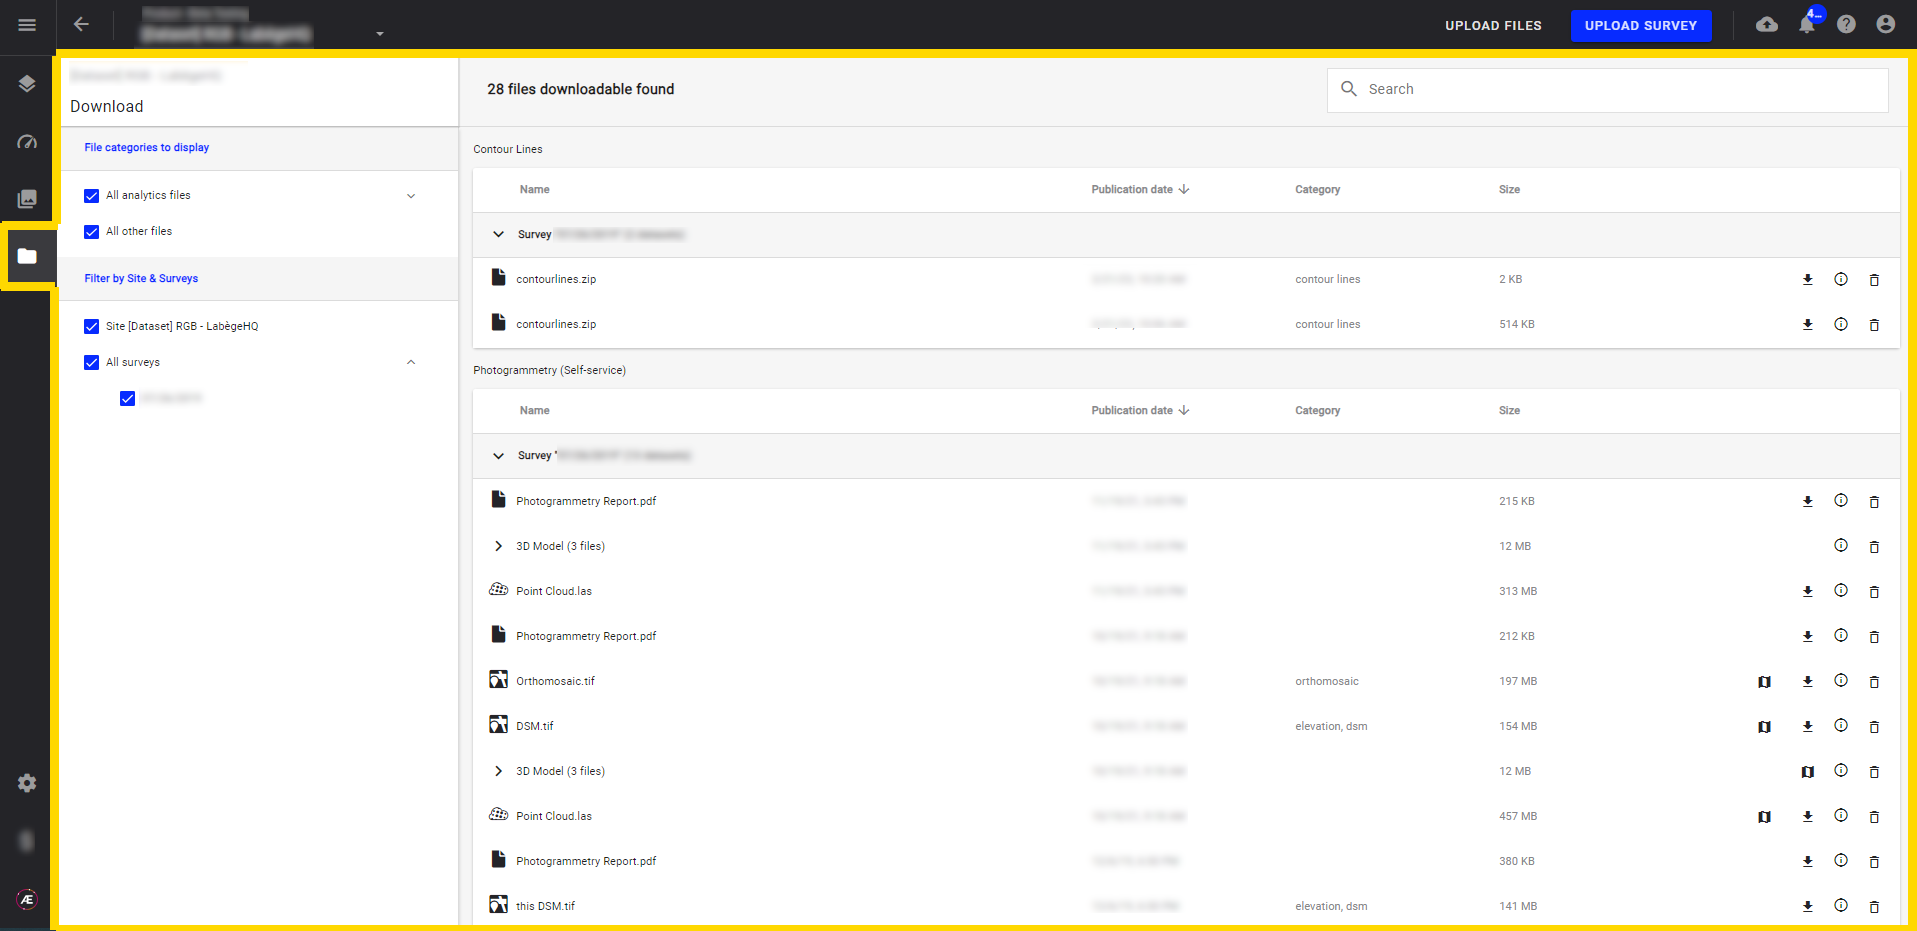
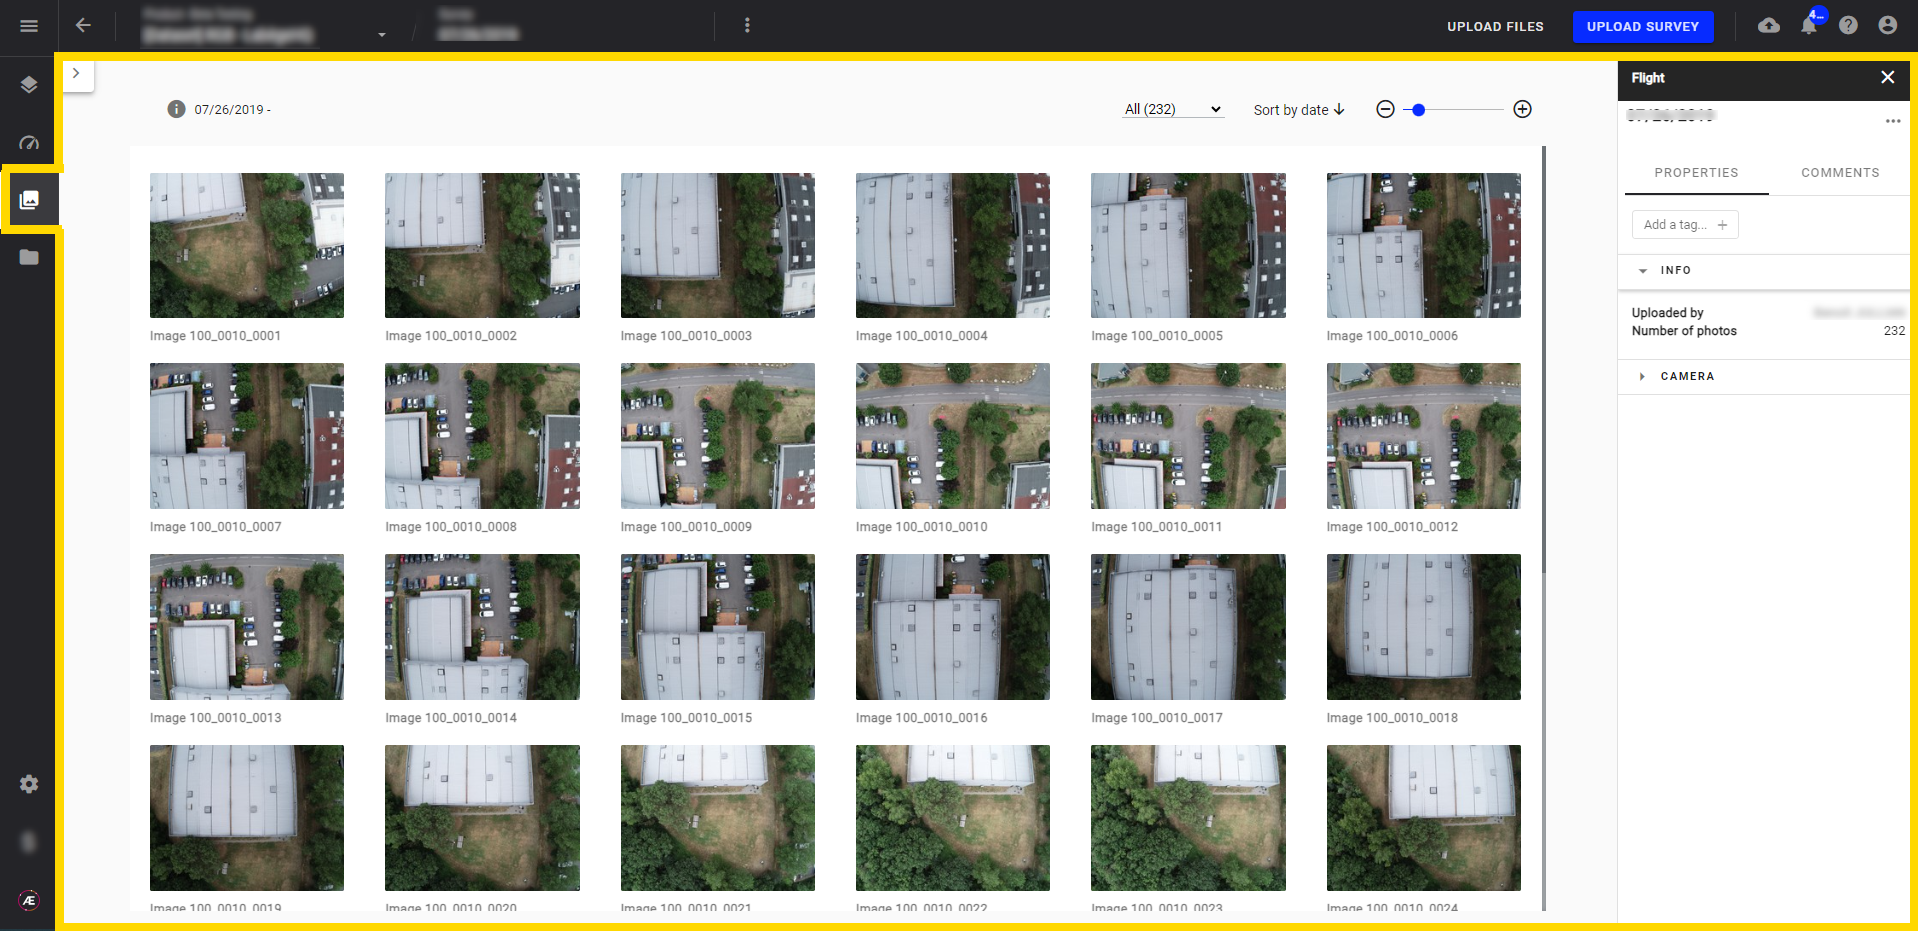
(3) "Images" Menu: Gives access to all images of the survey and information for each one such as altitude, date, focal length, etc…
(4) "Download": Gives access to all downloadable and exportable items on a project. See Export Data.