

Custom Analytics Creation with CLI - Rust Detector Tutorial
1. Description
With Alteia's Command Line Interface (CLI) developers can deploy their own custom analytics on Aether. With the integration of custom models, you can use the platform resources and features for visual and non-visual data management, to add custom analytics to end-to-end workflows.
We've created a code sample, Rust Detector, to help you create and deploy your first custom analytics. Let's configure the description and deploy it together.
2. Prerequisites
- Ability to install and run programs as administrator on your computer
- Ability to run git commands on your computer
- The company where you want to create and test your custom analytics already exists and custom analytics are enabled on it -> we will call it the development company in this document
- The company where you want to activate your custom analytics already exists and the Domain manager has defined a shortname for this company -> we will call it the target company in this document
- An account with a role that has permission to manage custom analytics (create and test) on the development company -> we will call it a "developer" account in this document
- An account with a role that has permission to expose custom analytics from the development company to the domain -> we will call it an "analytic exposer" account in this document
- An account with a Domain manager role (who has permission to activate custom analytics)
- An account with a role to create datasets in a project on the target company (can be User or Manager role)
- An account with a role that has permission to order custom analytics on the target company -> we will call it a "user" account in this document
3. Initial steps
Developer
Step 1 - Clone the tutorial repository on your computer.
git clone https://github.com/alteia-ai/rust-detector.git
Step 2 - Install the Alteia CLI by typing the below code into your terminal.
python3 -m pip install alteia-cli
Step 3 - Create a Docker ID account, by following these steps:
https://docs.docker.com/docker-id/#register-for-a-docker-id
- Install Docker Desktop, by following the procedure depending on your environment:
- After installing Docker Desktop, start it.
The Alteia platform must have access to your Docker registry to pull Docker images. To allow this, we need to configure your Docker registry credentials. An example of the configuration file is provided with the rust-detector code example.
Step 4 - Edit the docker_credentials.json file (found at the root of the repo you cloned) with the following rules:
[
 {
    "name": "[NAME]",
    "credentials": {
        "login": "[USERNAME]",
        "password": "[ACCESS_TOKEN]",
        "registry": "[REGISTRY_URL]"
    },
    "labels": {
        "description": "description of my docker registry"
    }
 }
]- Set the following fields:
- [NAME]: choose a unique name for your credential (example: My docker.io registry)
- [USERNAME]: your Docker hub or Harbor username
- [ACCESS_TOKEN]: your Docker Hub or Harbor access token
- [REGISTRY_URL]: your registry URL (for Docker Hub: registry-1.docker.io)
- Configure your Alteia credentials by using your developer account:
alteia configure
- The Alteia CLI will ask you to enter your email, password, and the platform you are using, for example, https://YourCompanyName.alteia.com/.
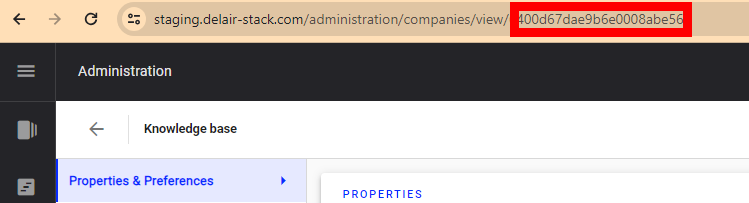
- Execute the following command by replacing [YOUR_COMPANY_ID] with your company identifier:
alteia credentials create --filepath docker_credentials.json --company [YOUR_COMPANY_ID]
4. Create your analytic
Developer
To create your analytics, you must create a YAML file that tells the platform how to behave regarding the Docker image you’ve created. This also helps to create the user interface while ordering your analytics when done.
4.1 Configure analytics general information
To do this with the Rust Detector example, follow these steps :
Step 1 - Open the file rust-detector.yaml
spec-version: v1.0
name: [YOUR-COMPANY-SHORTNAME]/rust-detector
version: 1.0.0
display-name: Rust detector
description: Detects rust on historical buildings
docker-image: [YOUR-DOCKER-REGISTRY]/rust-detector:v1.0
docker-credentials-name: [credentials of the docker registry]
instance-type: small
volume-size: 20
groups: [Maintenance, Test]
Step 2 - Configure the mandatory fields as follows:
- name is the name of your analytics and your company's short name must be followed by it. Thanks to this short name, the platform will identify whether the company has the CLI feature enabled or not. Please contact your sales representative or the support team if you do not have a company's short name.
- docker-image is the tag of your docker image that has been pushed to your docker registry. It tells the platform where to pull to get your algorithm running. Replace [YOUR-DOCKER-REGISTRY] with the hostname of your own Docker registry. For example registry-1.docker.io/[USERNAME] for dockerHub or [ECR_ID].dkr.ecr.us-east-1.amazonaws.com for AWS ECR.
- docker-credentials-name : is the credential name of docker registry
Step 3 - Note that some other fields can also be configured:
- spec-version corresponds to the format version of the description file (currently v1.0)
- version is the version of your analytics respecting the SemVer format
- display-name is the name displayed on the platform
- description is a brief description of what the analytics is doing
-
instance-type and volume-size are the kind of instance you want to use: small, large, xlarge, gpu, and the volume size is an integer from 0 to 1000 (in GB). Minimal resources allocated for each instance type:
- small: { cpu: 4, gpu: false },
- large: { cpu: 36, gpu: false },
- xlarge: { cpu: 48, gpu: false },
- gpu: { gpu: true, cpu: 32 }
- groups you must put the analytics group name where you want to add your analytics. Here there are two groups Maintenance and Test in which the analytics Rust Detector will be.
4.2 Configure analytics inputs
The inputs section of your YAML file tells the platform what kind of input file it has to search for. Here is a description of this section for the Rust Detector example. It can be left as is.
inputs:
  - name: building_mesh
    display-name: Building 3D Model
    description: 3D Model of the model (mesh dataset)
    kind: dataset
    schema:
      type: mesh
    required: true
name and display-name give a name to your inputs and a display name for the user interface
description can as you see
kind tells the platform what kind of inputs it has to send to the docker image. The choices are: dataset and dataset-array
If you want to use more than one input you must use: dataset-array
schema tells the platform what kind of dataset it has to look for. The platform will only display the dataset that matches this schema:
- type: raster, pcl, mesh, vector, file, image
- source: defines where to look for the datasets in the platform. The choices are: data-manager (for all the raw uploaded data) and map-service (for the vector data that is ingested by the platform and usable by it)
mission: current, all, others
required: true or false define if the input is mandatory or not
4.3 Configure parameters
You will likely want to apply external parameters, adjustments, and even more settings to your analytics. To do so, use the parameters section. Here is a description of this section for the Rust Detector example. It can be left as is.
parameters:
  - name: detection-mode
    display-name: Rust detection mode
    description: Level of detection (Fast, Standard or Deep)
    schema:
        type: string
        default: Standard
        enum:
            - Fast
            - Standard
            - Deep
    required: true
name and display-name give a name to your parameters and a display name for the user interface
description describe the kind of parameters you will be setting, and choose the level of detection
schema that describes what kind of parameters can be set on your analytics. For example in this analytic, the parameter is in type string but can also be in numbers. In this case, the parameter default value is “Standard”.
required: true or false define if the parameter is a requirement or not
4.4 Configure deliverables
The deliverables section shows the outputs of your analytics. The definitions for the items in this section are the same as those in the input section. Here is a description of this section for the Rust Detector example. It can be left as is.
deliverables:
    - name: rust-report
      display-name: Rust detection report
      description: Pdf report containing insights about rust detected in the 3D model
      kind: dataset
      schema:
        type: file
      required: true
To simplify how deliverables are handled and displayed, each dataset can be assigned a category.
The list of available categories and their corresponding folders is provided in this article.
Example of deliverable definition with a category
deliverables:
    - name: statistics-extract
      display-name: Statistical metrics
      description: Extract statistical metrics
      kind: dataset
      schema:
        type: vector
        categories :
          - statistics
      required: true
In this example, the deliverable "statistics-extract" will be added in the folder "Statistics" in the section "Survey data".
4.5 Analytics creation
With the completed YAML file, you can now create the analytics on Aether.
Begin with the following command in the correct folder:
alteia analytics create --description rust-detector.yaml
To ensure you created the analytics correctly, request a list of all available analytics:
alteia analytics list
Next, build your Docker image and tag it with your Docker registry hostname, as follows, depending on your environment:
For a Linux environment:
export DOCKER_REGISTRY="REPLACE_WITH_YOURS" # example: "registry-1.docker.io/[ACCOUNT_NAME]"
docker build -t ${DOCKER_REGISTRY}/rust-detector:v1.0 .
For a Windows environment:
set DOCKER_REGISTRY="REPLACE_WITH_YOURS" # example: "registry-1.docker.io/[ACCOUNT_NAME]"
docker build -t %DOCKER_REGISTRY%/rust-detector:v1.0 .
Push your Docker image as follows, depending on your environment:
For a Linux environment:
docker push ${DOCKER_REGISTRY}/rust-detector:v1.0 For a Windows environment:
docker push %DOCKER_REGISTRY%/rust-detector:v1.0
If you run into an issue, try executing the docker login first.
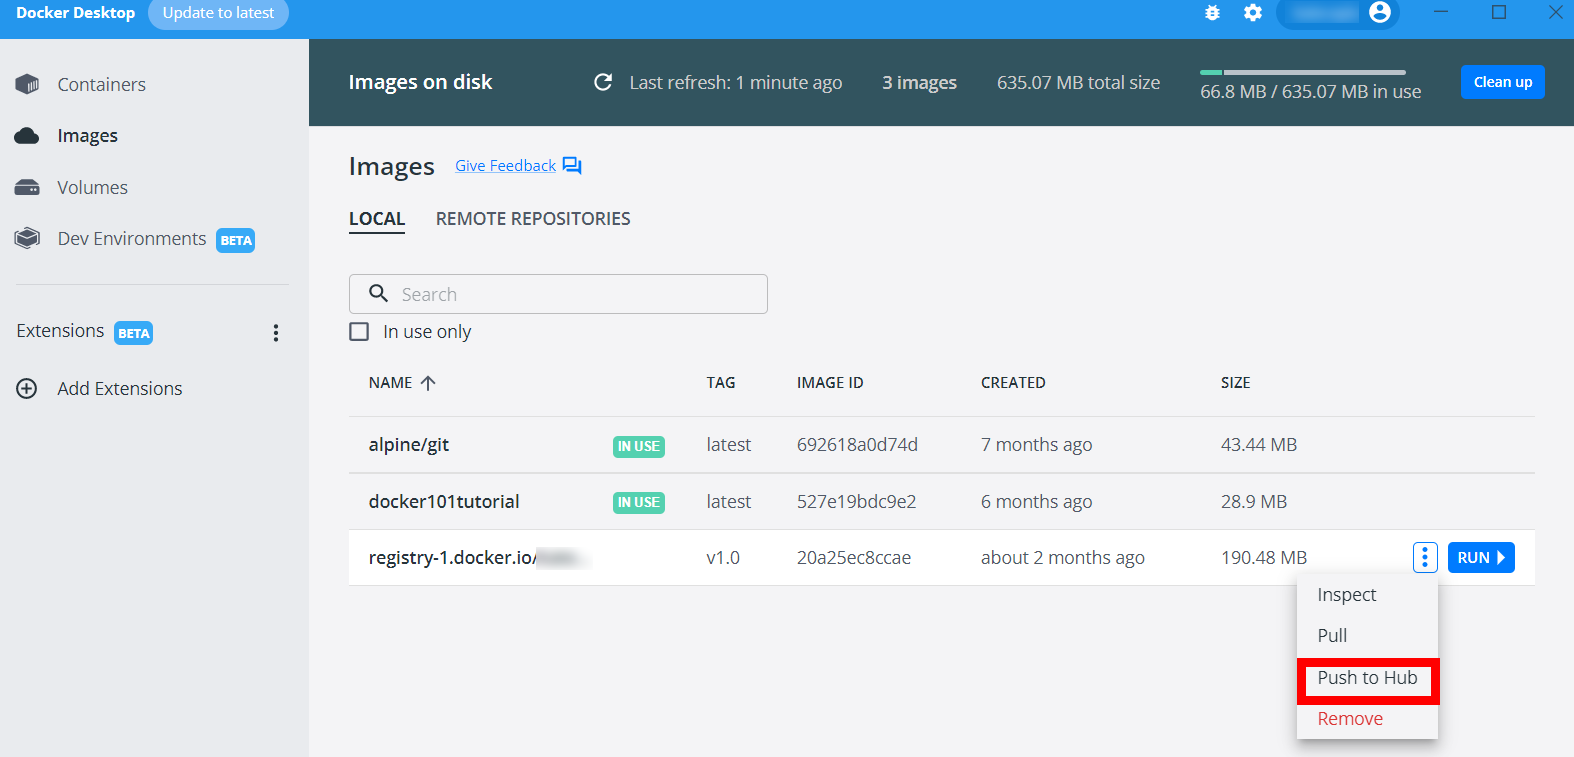
Or push your docker image from the Docker Desktop user interface.
5. Create your project in your development company
Developer
First, create a project where you can launch your brand-new analytics. To do this:
- With your developer account, connect to the platform then open your development company
- Create an empty site on Aether by clicking on the CREATE A SITE button in the toolbar.
- Next, click on the UPLOAD FILES button in the toolbar to upload a mesh file. Make sure that you select the radial button to "Attach file to a new survey". An example file can be found in the cloned repo, at sample_workdir/EiffelTower.obj.
You can then run the analytic from the development company, in order to test it (see section "9. Run your analytic" further)
6. Expose your analytics on your domain
Analytic exposer
The analytics is now available under the company you created it in and only for the following users:
- users who have the rights to expose analytics from this company
- users who have the rights to manage custom analytics (create and test) on this company
To expose the analytic on your domain, run the following commands with your analytic exposer account:
- First, configure your Alteia credentials by using your analytic exposer account:
alteia configure
The Alteia CLI will ask you to enter your email, password, and the platform you are using, for example, https://YourCompanyName.alteia.com/.
- Then, run the CLI command to expose the analytic:
alteia analytics expose --domain DOMAIN_NAME ANALYTIC_NAME
When exposing, specify the following option:
--domain TEXT: To expose the analytics on the domain.
By default, without providing this option, the analytics will be exposed on your domain if you have the right permissions on it.
To see which analytics are exposed on your domain, run the:
alteia analytics list-exposed --domain DOMAIN_NAME
If you don't provide the option --domain, you will obtain all analytics exposed on your domain. Cancel the command with Ctrl+C.
7. Activate your analytics on a company
Domain manager
The analytic is now exposed on the domain but still, no user can access it from the analytic catalog.
To activate the analytics on a company, follow these steps:
Step 1 - Login to the domain as a domain manager.
Step 2 - Click on "User and company manager".
Step 3 - Open a company details page, then click on the Analytics menu on the left.
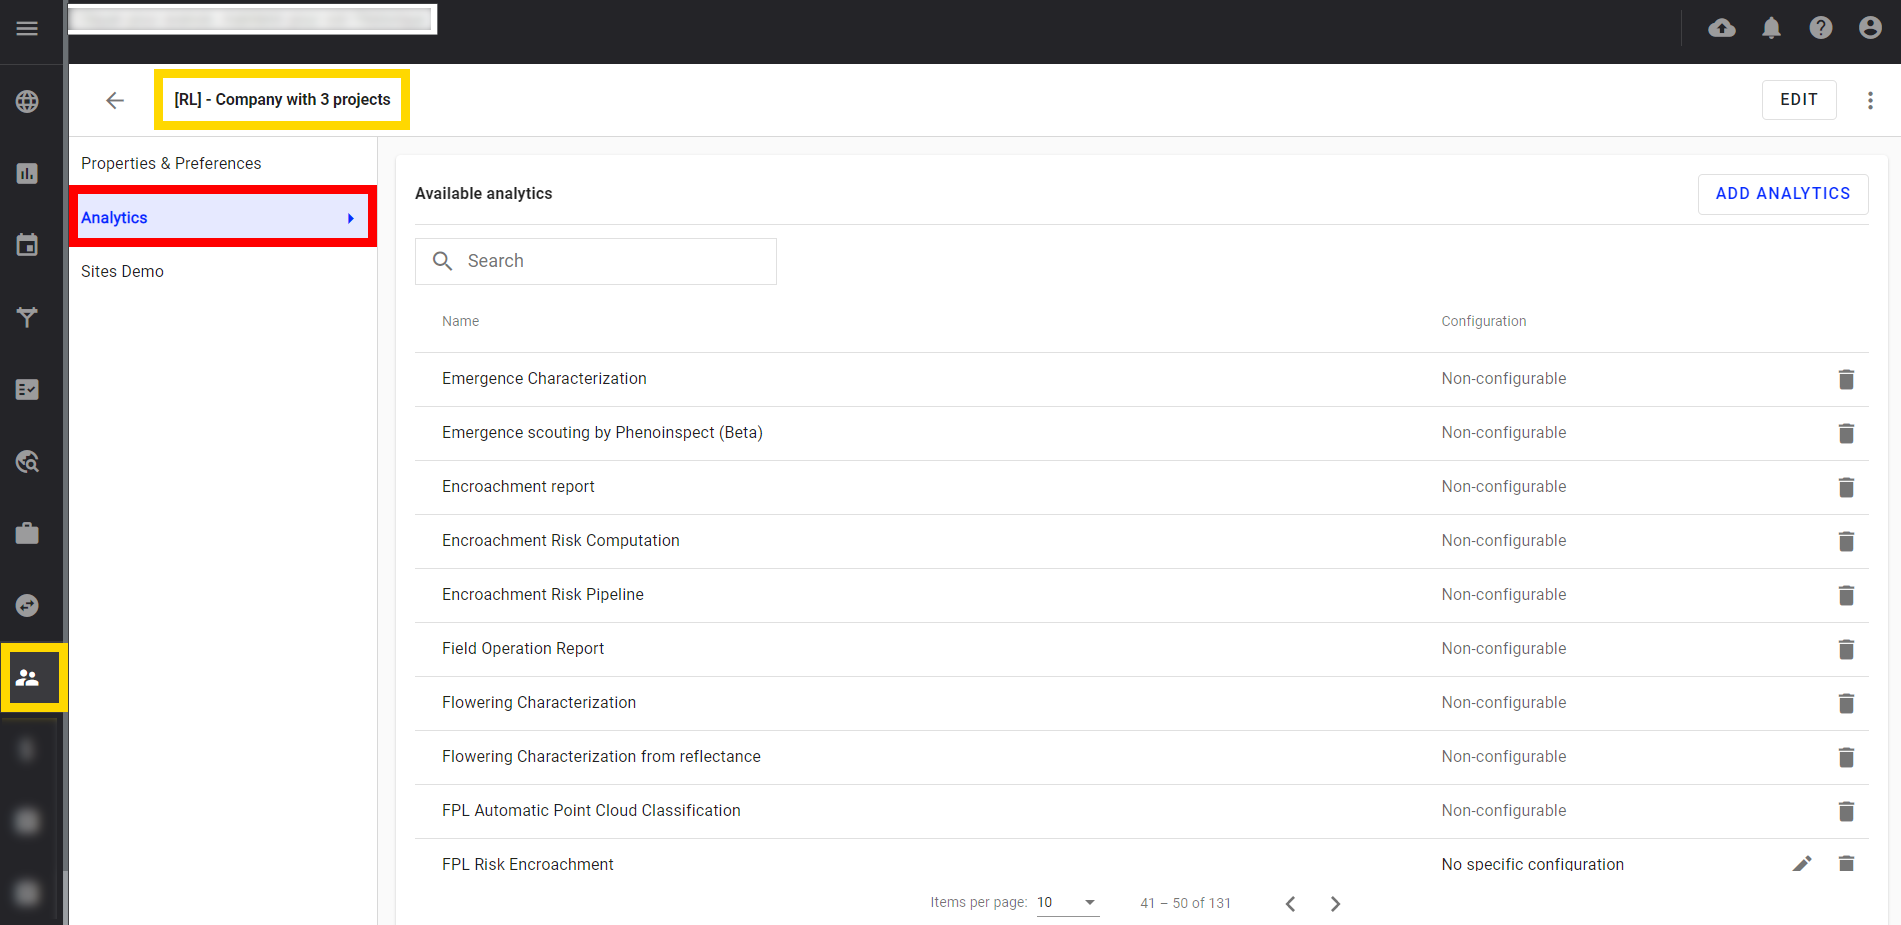
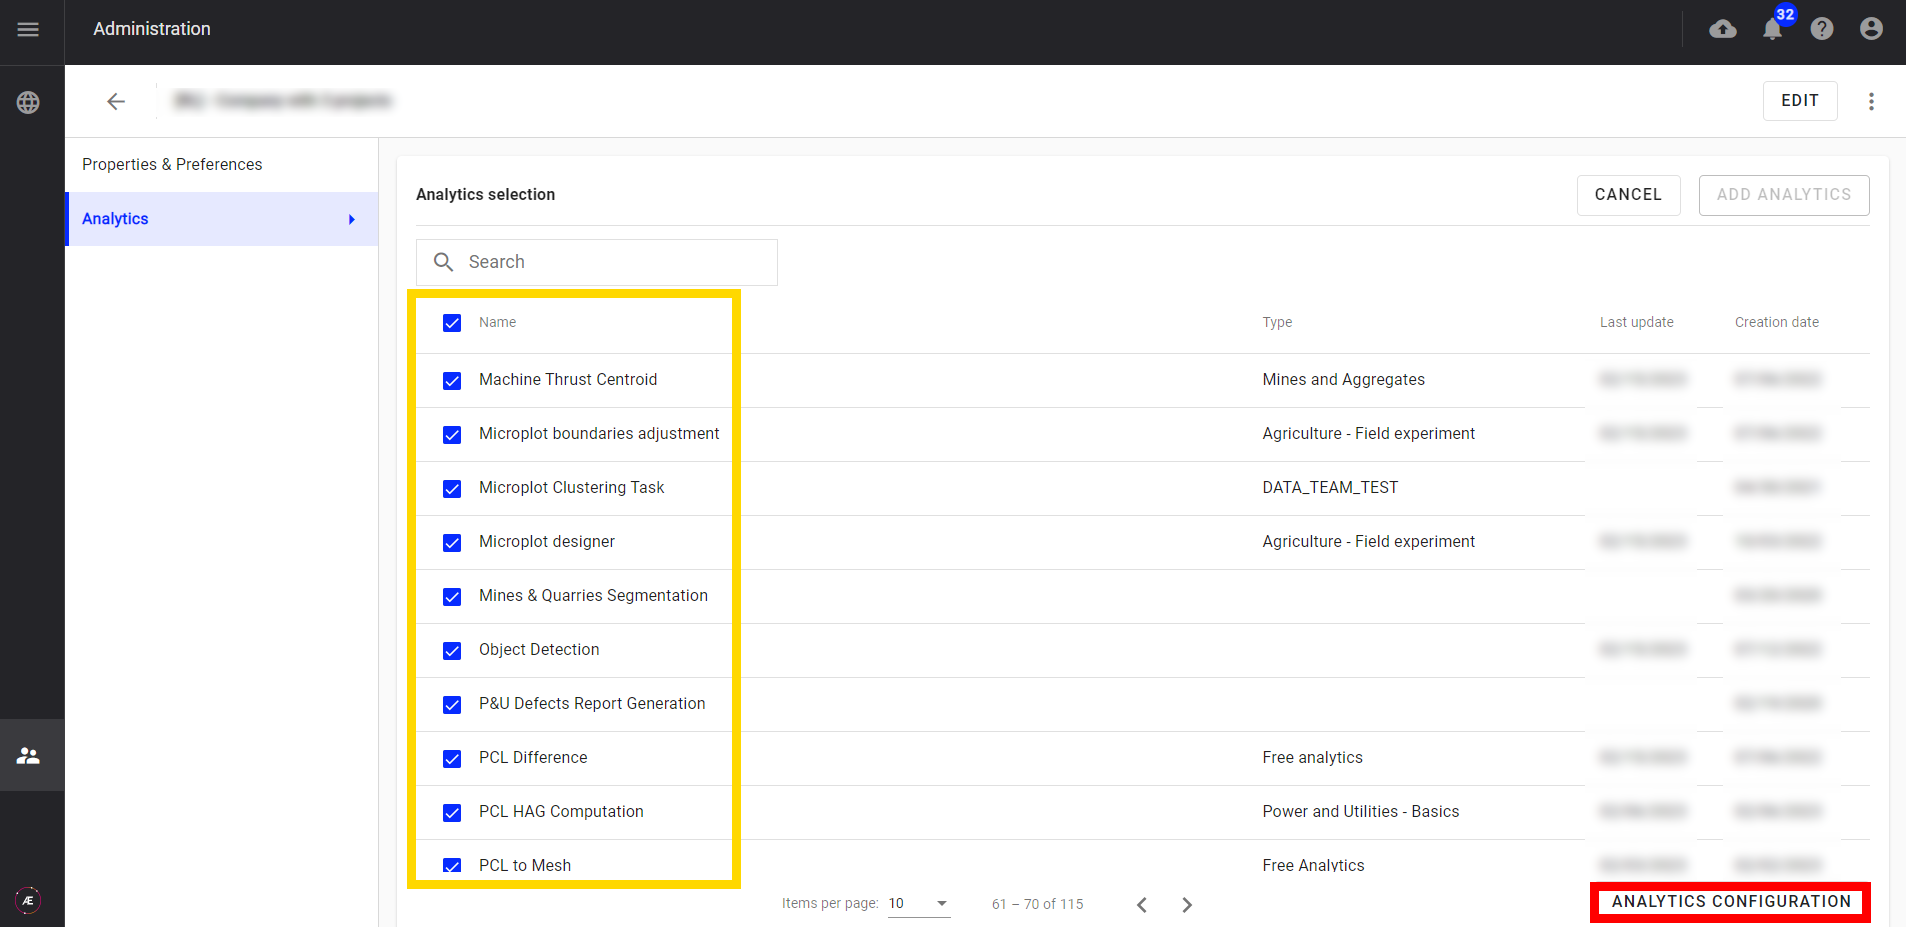
Step 4 - All available analytics for the company, are listed.
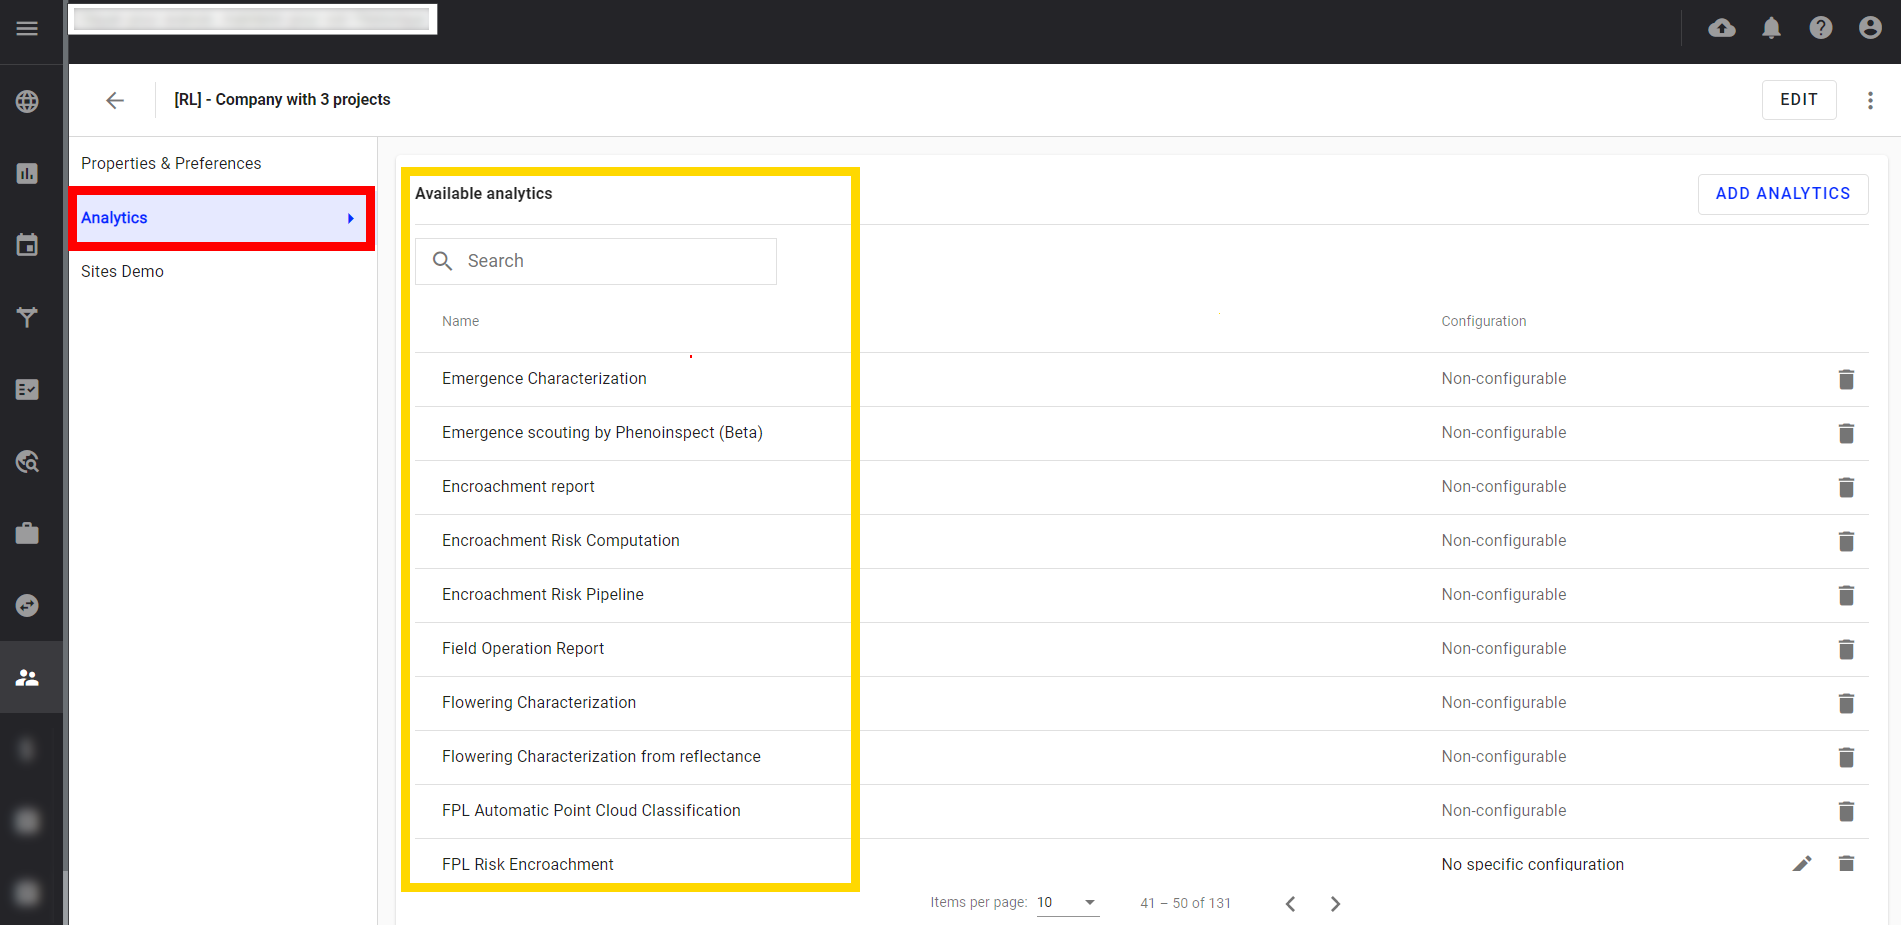
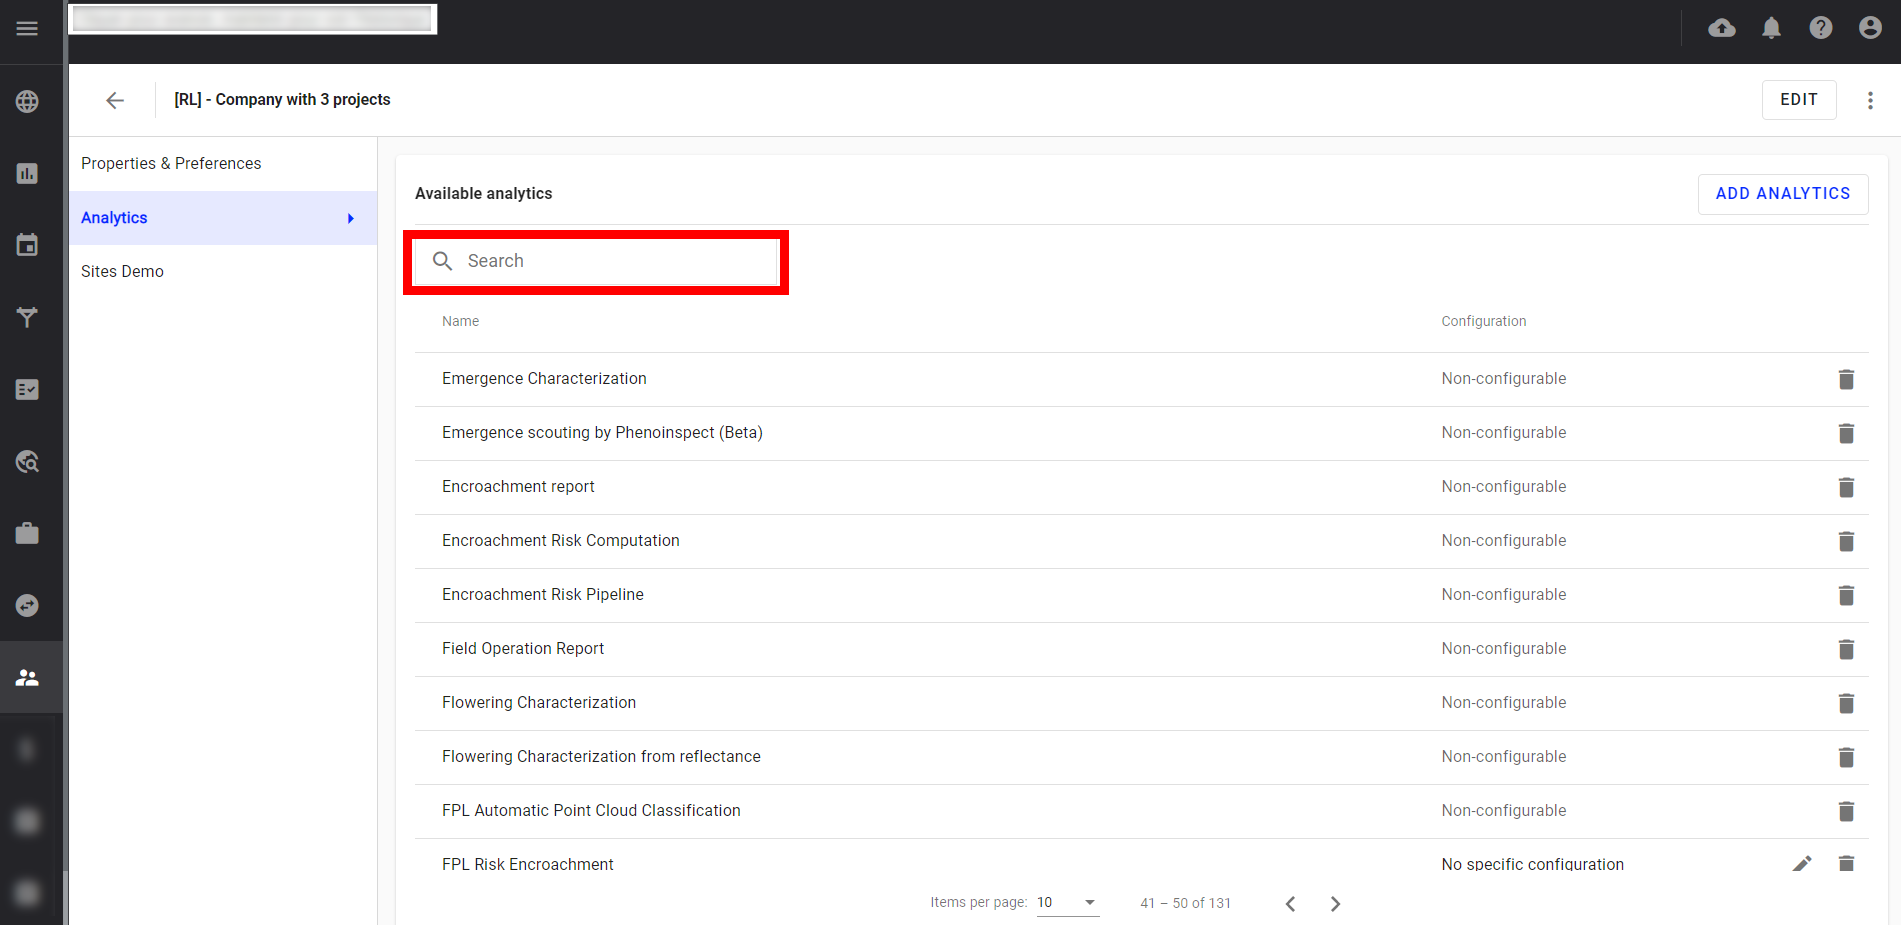
Step 5 - It is possible to search on this list by using the search field.
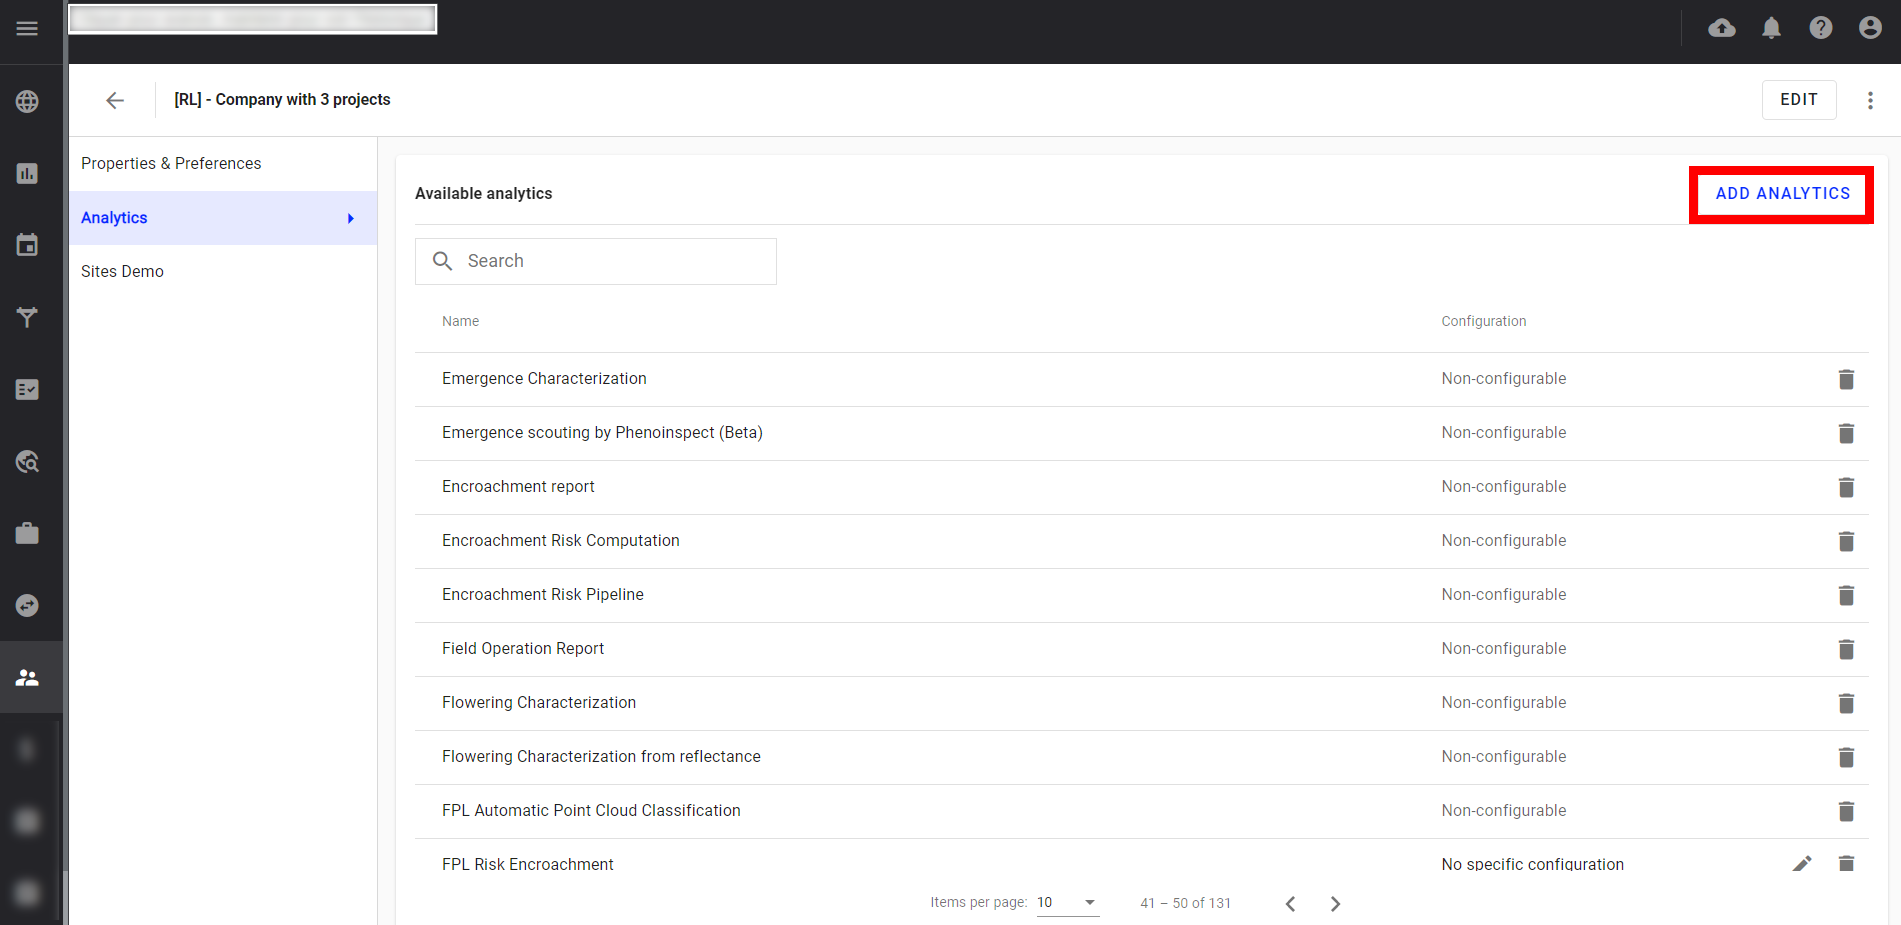
Step 6 - Click on "Add analytics".
Step 7 - It is possible to make a search on this list by using the search field.
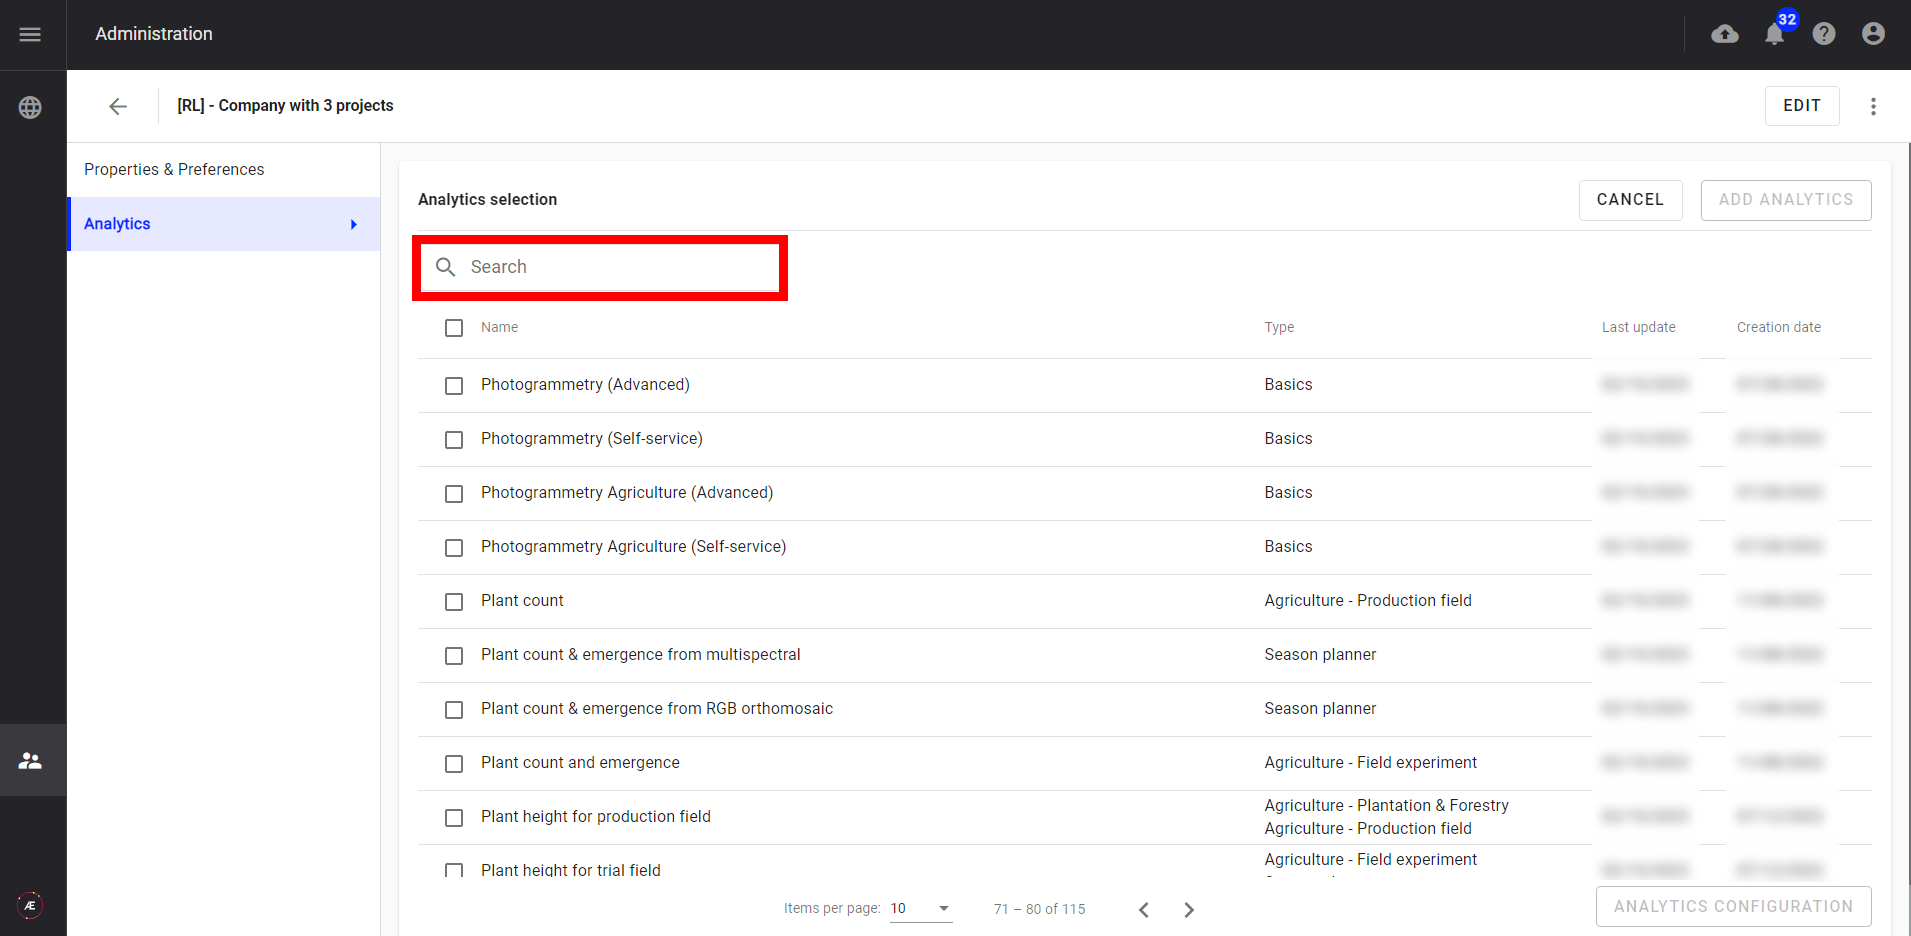
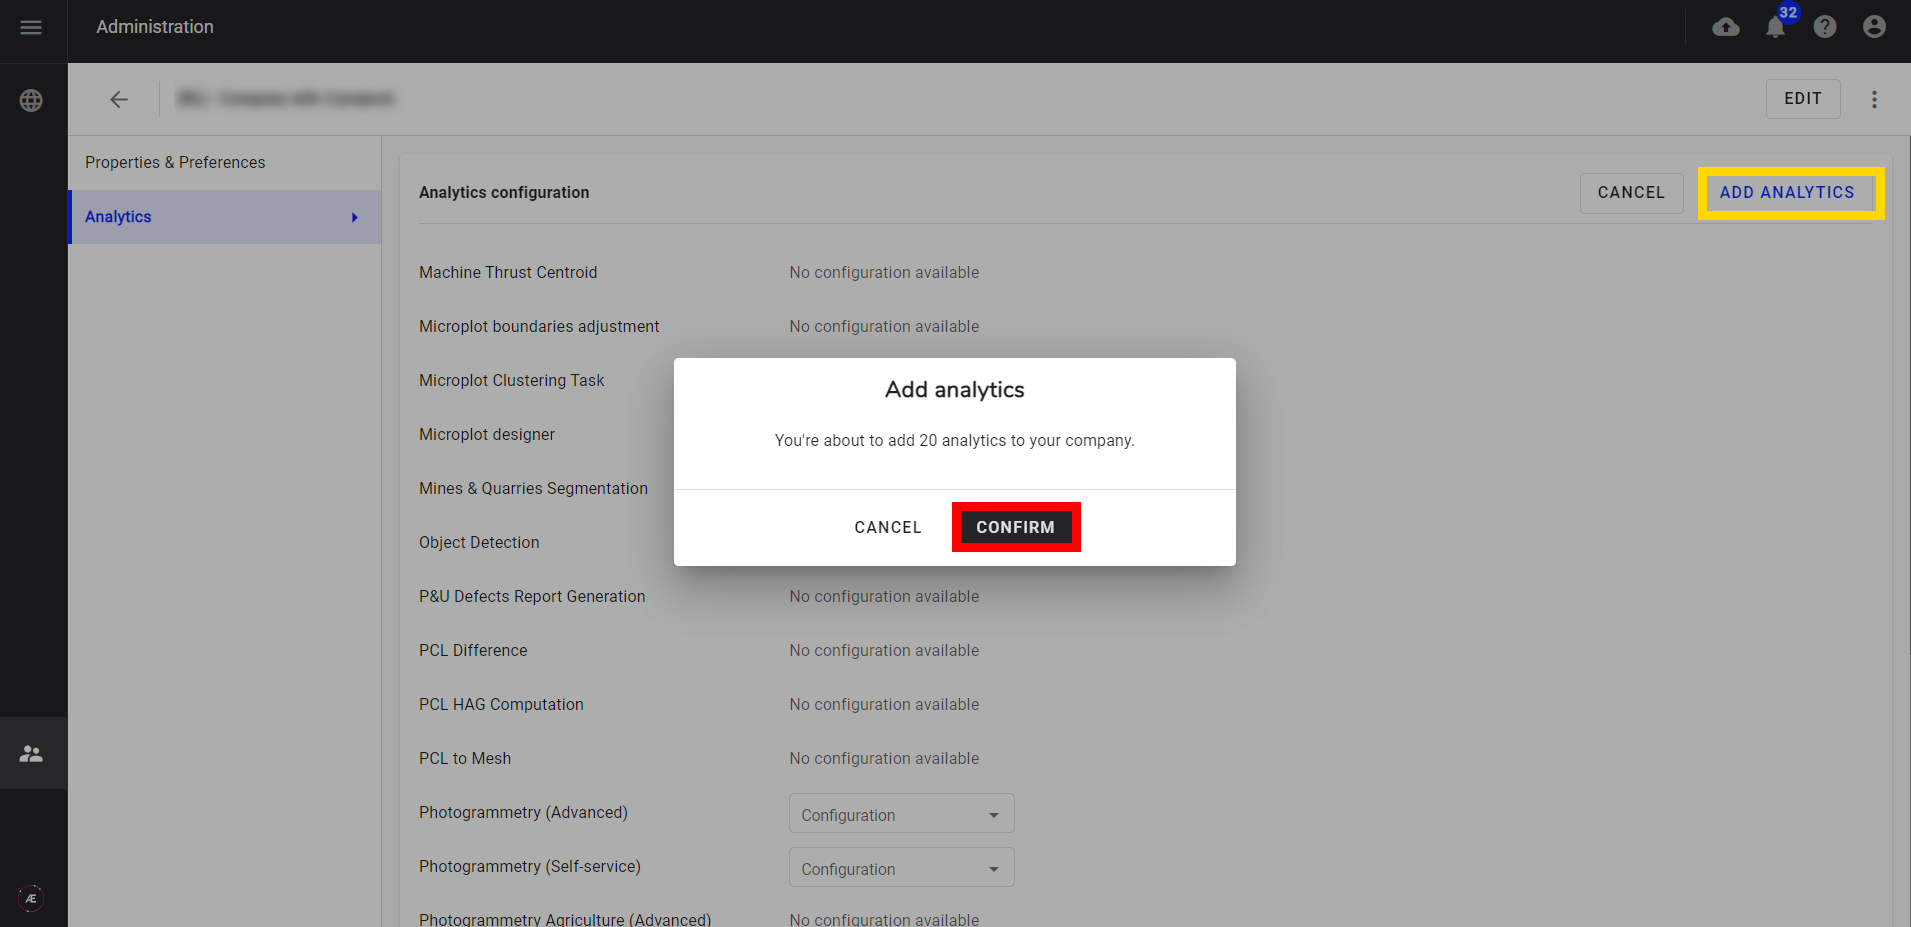
Step 8 - Select one, several, or all analytics of the displayed page, and click on "ANALYTICS CONFIGURATION".
Step 9 - Click on "Add analytics", and on "CONFIRM".
8. Create your project in your target company
Company manager or analytic user
Create a project where you can launch the analytics. To do this:
Step 1 - With your company manager (or analytic user) account, connect to the platform then open the target company
Step 2 - Create an empty project on Aether by clicking on "CREATE A PROJECT" in the toolbar.
Step 3 - Click on the "UPLOAD FILES" button in the toolbar to upload the input of the custom analytic (a mesh file for the Rust Detector analytic). Make sure that you select the radial button to "Attach a file to a new survey". An example file can be found in the cloned repo, at sample_workdir/EiffelTower.obj.
9. Run your analytic
Analytic user
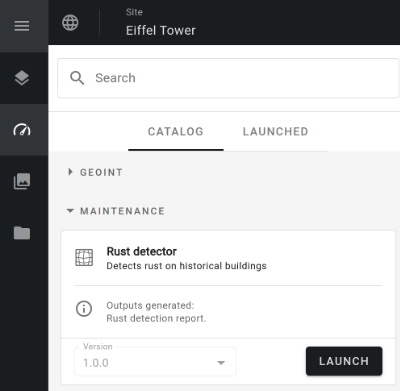
Step 1 - Connect to Alteia and open your project with the 3D mesh file. In the Analytics view, order the Rust Detector analytics (in the Maintenance group).
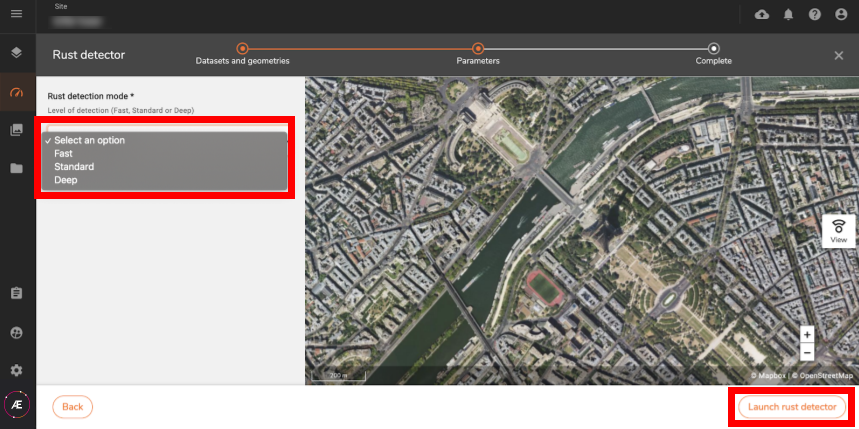
Step 2 - On the next screen, you see the description of your analytics that were defined in the general information section of the YAML file. The definitions provided in the inputs section are visible here with the name of the inputs and a short description. The platform will only show the datasets that match the provided input schema.
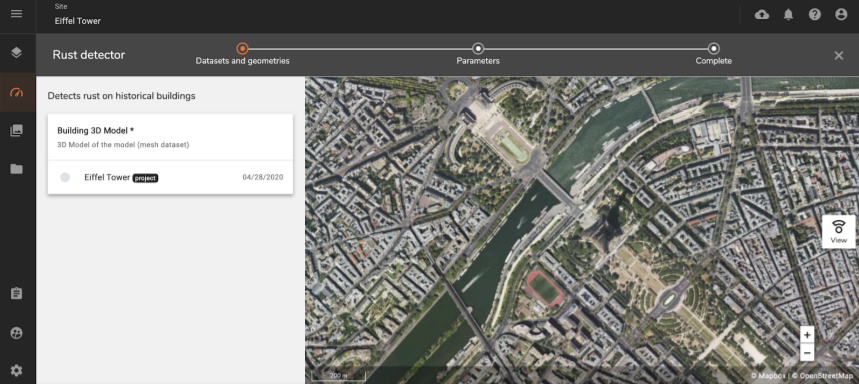
Step 3 - Select the parameters that you defined in the parameter section, and click on "Launch rust detector".
10. Debugging
Developer
Step 1 - When developing new analytics, it is convenient to retrieve the execution logs. To do that, execute:
alteia products list
Step 2 - Copy the product id corresponding to your order:
alteia products logs --follow [PRODUCT_ID]
The --follow option allows you to retrieve the logs as soon as they arrive.
Step 3 - Once processed, you can check the report created in the Download view of the Data Studio module.
Step 4 - During development, it can be useful to execute tests locally. To do that, just set the DELAIRSTACK_PROCESS_WORKDIR environment variable:
export DELAIRSTACK_PROCESS_WORKDIR="./sample_workdir"
Step 5 - Run the script with:
python3 detect_rust.py
Step 6 - At the end of execution, the workdir should contain:
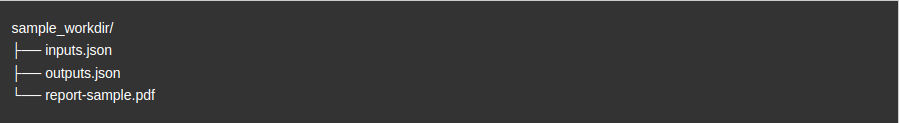
11. Update credential
Developer
If you need to update the custom analytic credential, execute
alteia analytics set-docker-credentials-name [YOUR-COMPANY-SHORTNAME]/rust-detector --version 1.0.0 --company [YOUR-COMPANY-SHORTNAME] --docker-credentials-name [YOUR-NEW-CREDENTIAL-NAME]
