

Usage Monitoring
Discover how to monitor products ordered on the platform
1. Description
The Usage Monitoring Dashbard presents the list of all analytics ordered by customers. The user can visualize this list, filter this list according to different criteria, access to the details of one analytic and export this list.
2. Access to Usage Monitoring
Info
In order to access to Usage Monitoring menu, the custom role “Usage Supervisor” is needed on all authorized companies.
This role shall be added to “manager” core role.
Click on the “Administration” menu on the left bar of the platform.
Click on “Usage Monitoring”. It opens the Usage monitoring dashboard global view.
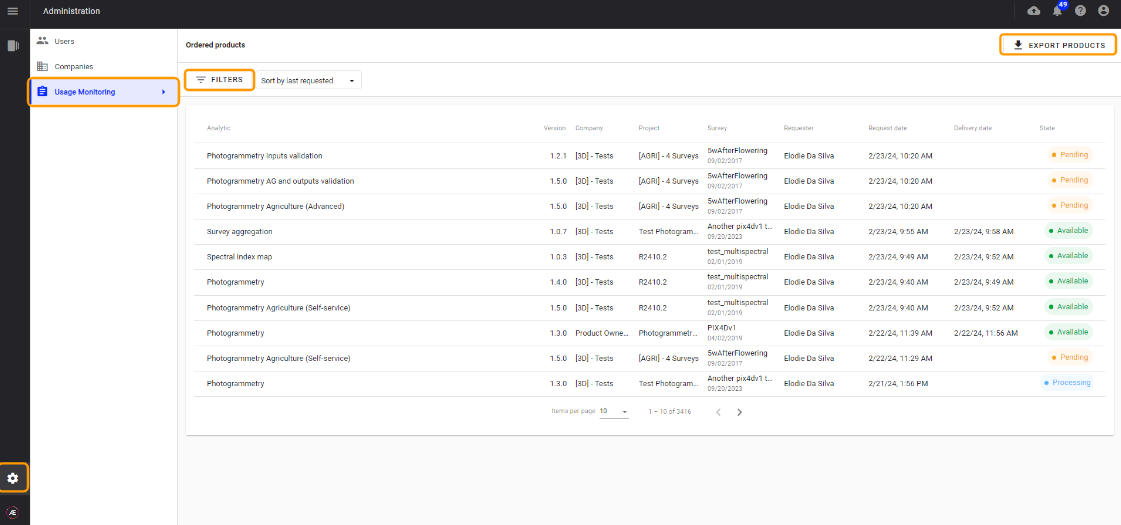
3. Global view
This view presents all analytics of all companies on which the user has the custom role “Usage Supervisor”.
The columns are the following :
- Analytic : Display name of the analytic
- Version : version of the analytic
- Project / Survey : name of the project and survey
- Requester : name of the user that requested the analytic
- Request date : date of the request of the analytic
- Delivery date : date of the delivery of the analytic in the platform
- Status : status of the analytic.
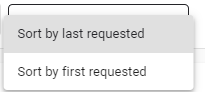
By default, the analytics are ordered by “request date”, from the recent one to the oldest one. The user can change this order, selecting “sort by first requested” :
3.1. Filters
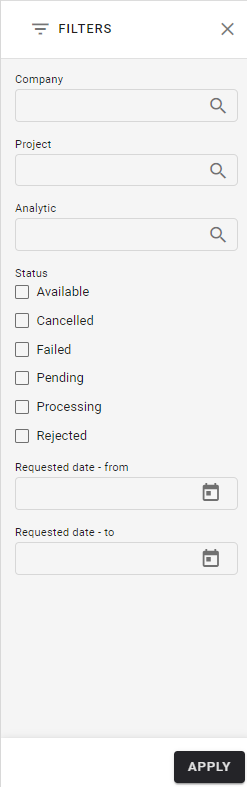
The user can filter the displayed analytics according to the following criteria :
- Company
- Project
- Analytic
- Status
- Request date.
To do so, click on “FILTERS” button above the table. Define the filter criteria and click on “APPLY”.
The list of analytics is filtered according to the defined criteria.
Note
If several filters are activated, the table only displays analytics responding to all defined criteria.
3.2. Export
The user can export the list of analytics by clicking on the “EXPORT” button, on top right of the page. By clicking on this button, all filtered analytics are exported in a CSV file, automatically downloaded on the user computer.
If no filters are set, the first 1000 raws are exported.
4. Detailed view
By clicking on a specific raw of the table, it opens a detailed view of the analytic.
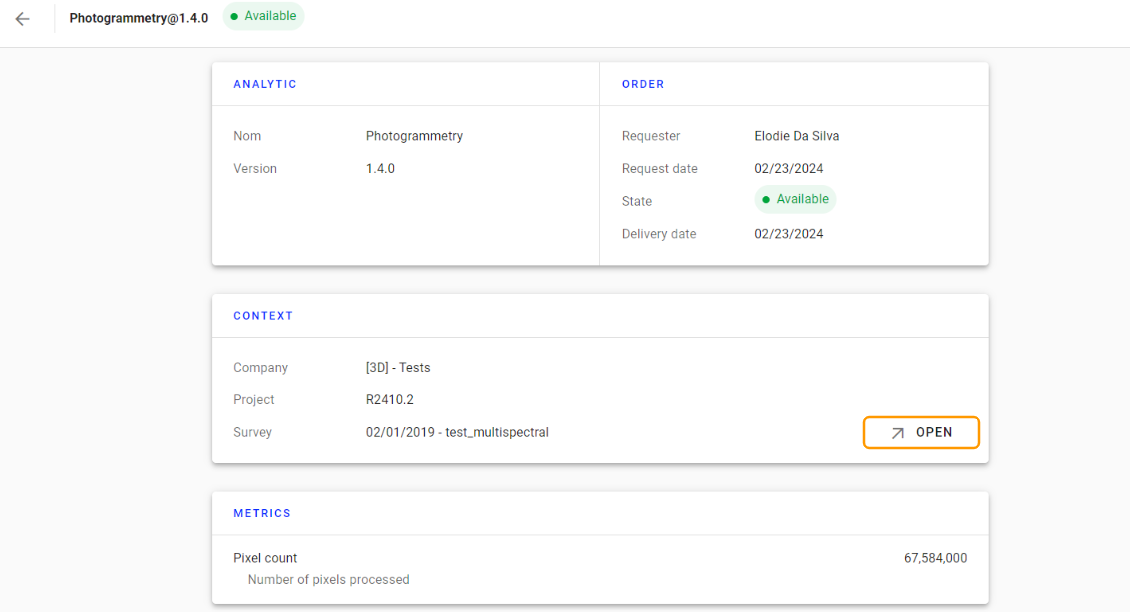
This view is made of several blocks :
- Analytic : gives the name and version of the analytic
- Order : gives details on the order : requester, dates, and status.
- Context : indicates the company, project and survey on which the analytic has been launched. From this part, click on “OPEN” to be redirected towards the corresponding survey in Data Studio.
- Metrics : gives some metrics on the analytic. For now, only one metric is supported : the number of pixels processed for photogrammetry analytics.
