

Microplot Boundaries Adjustment Task
This task allows to adjust the format of the microplot file to Aether's analytic requirements and to adjust the microplot boundaries positioning.
1. Inputs
- Microplot vector file: made with Aether's Microplot Designer Tool or with external software.
- Vegetation index: NDVI (multispectral sensor) or VARI (RGB sensor) in raster format.
- Field trial start: A point annotation made in Aether defining the field trial start
2. Outputs
The microplot boundaries adjustment tool will generate a Geojson file with the expected format and position with plot IDs as attributes. The new file is named “Microplots - adjusted”.
3. Workflow
Upload the microplot file in Aether
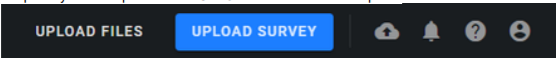
Step 1 - Open Data Studio and upload your Microplot file from UPLOAD FILES button on top bar:
Step 2 - Attach the file to the corresponding survey
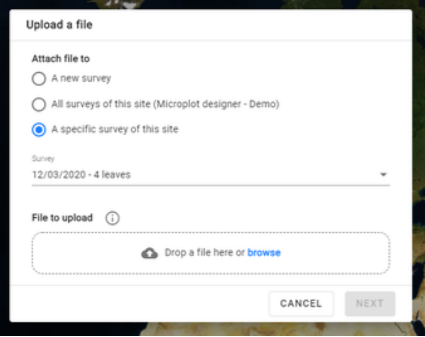
Step 3 - Drag-and-drop or browse to your plot map file
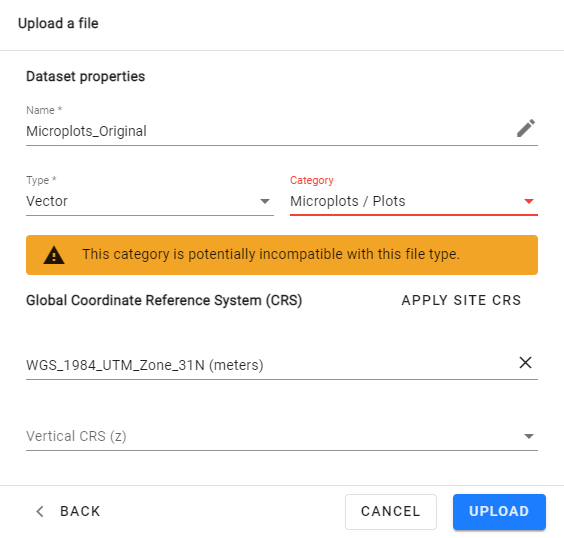
Step 4 - Edit file Name if necessary, select the “Type: vector” and “Category: Microplots”. Then press UPLOAD:
Your microplot file will be stored and available under the Download section:

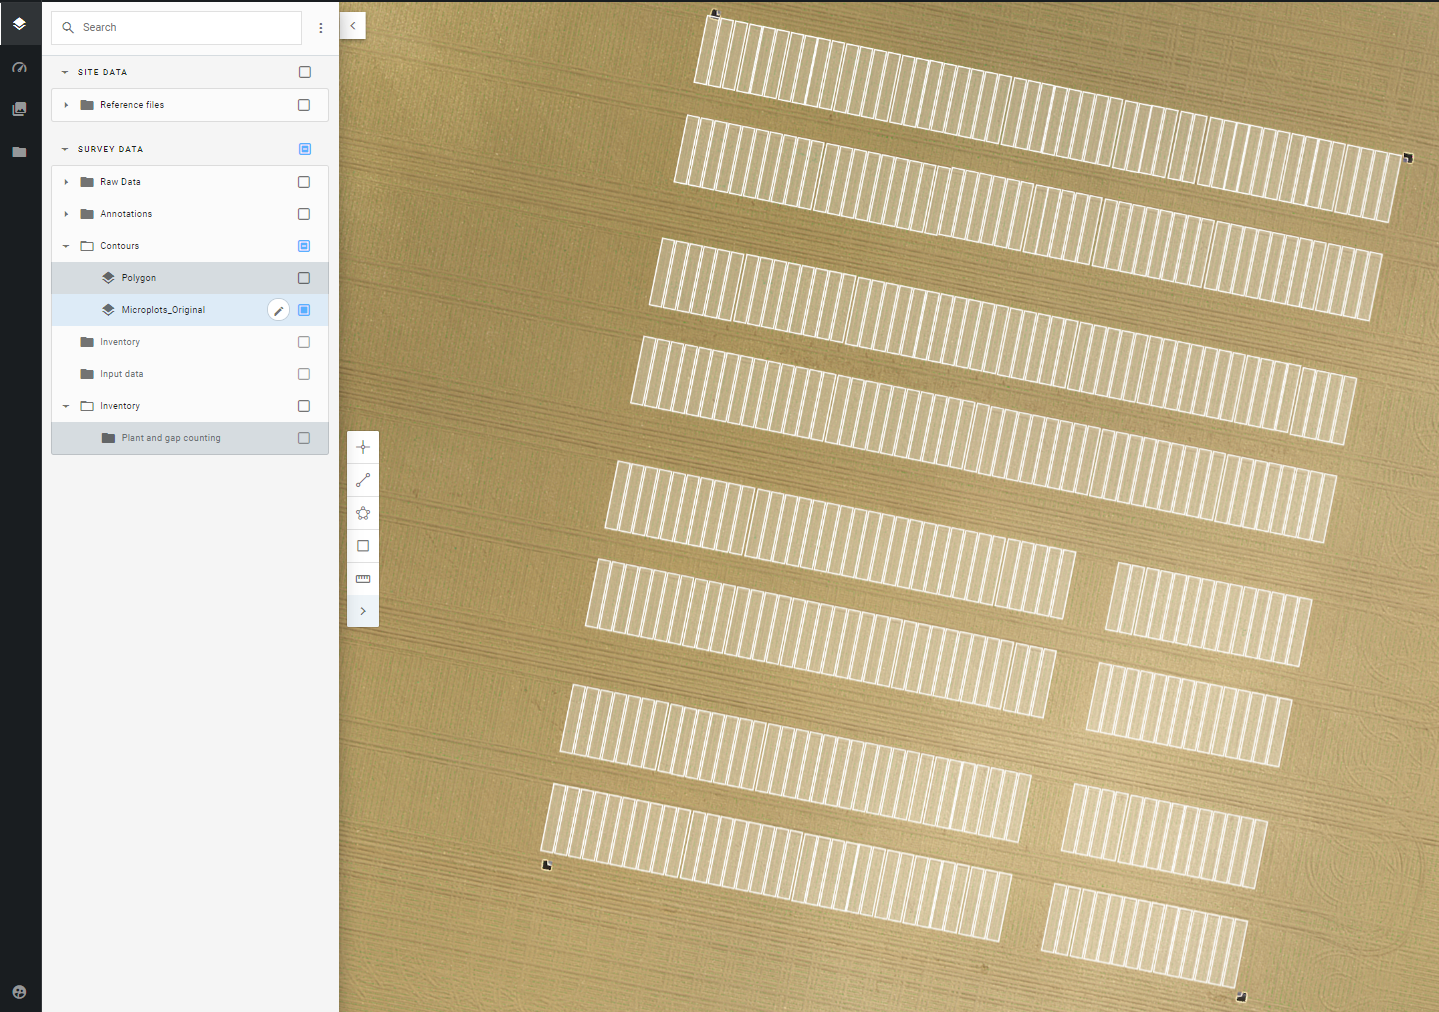
You can display the uploaded microplot vector in the map view as well:
Ensure the vegetation index (NDVI or VARI) is available for your survey
Roughly adjust the position of the microplots using the edition tools
Add the field trial start
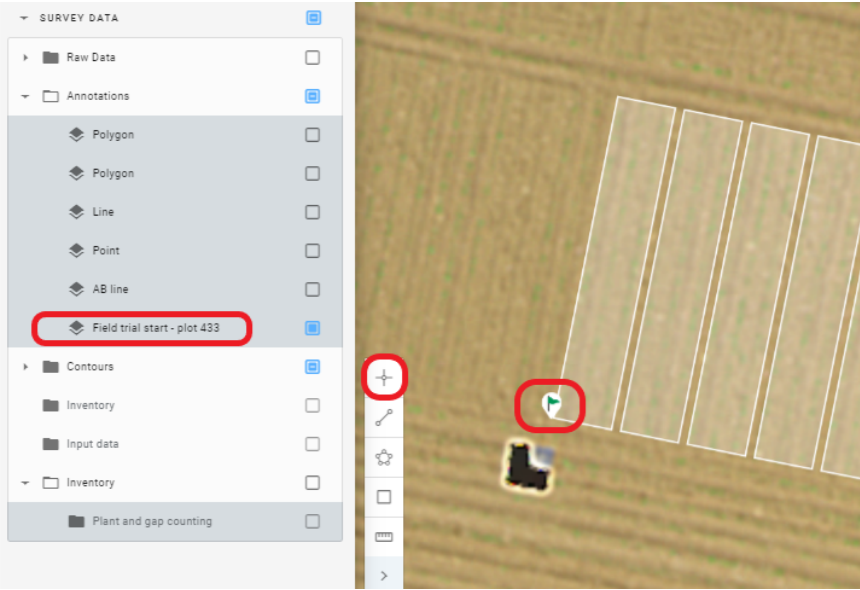
Create a point annotation where the field trial starts:
- Click on Point.
- Add a point at the corner of the first plot of the trial.
- Change the name of the annotation (Field trial start - “first plot name”) then click on Enter to validate.
- You can change the icon (green flag for example)
Adding custom attributes to the microplot file (optional)
Please read this article for more information: Join attributes to a vector file
Launch Microplot boundaries adjustment task
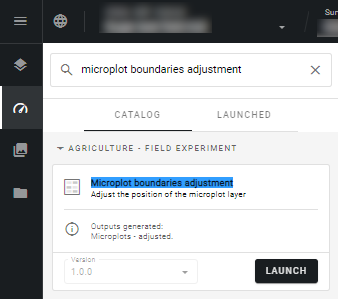
Go to Analytics section from the left panel, search for “Microplot boundaries adjustment” and then click on LAUNCH:
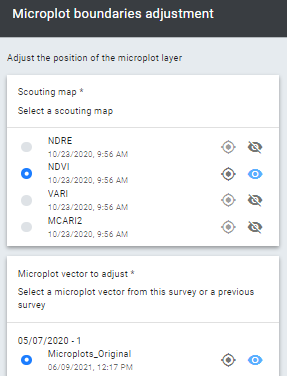
Select the right input files:
- Scouting map
- Microplot vector to adjust
Once the process is complete, the Microplot file becomes viewable in the download and map view sections.
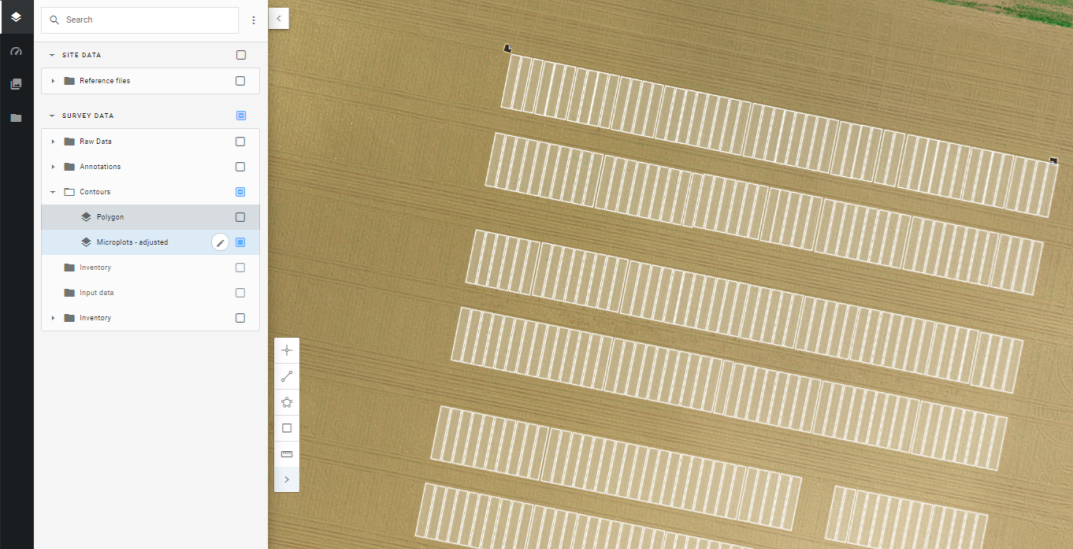
4. Display
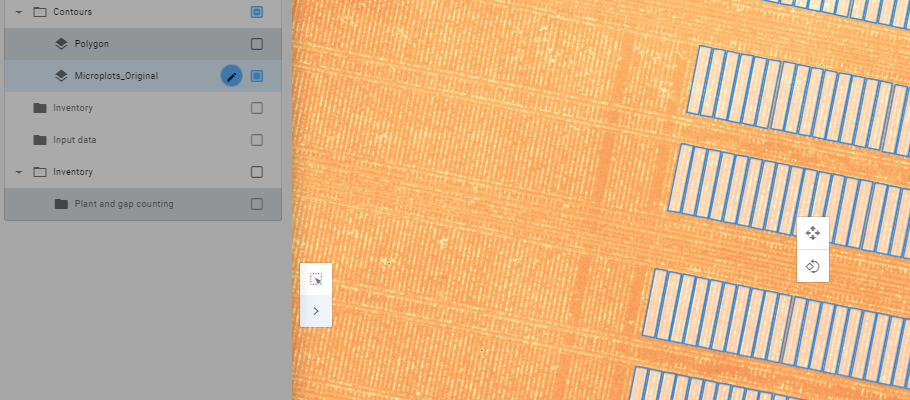
From the layers panel on the left, select Microplots - adjusted layer from the "SURVEY DATA" section, inside the Contours group.
5. Export of the Microplot file
The microplot file can be exported to your computer if necessary.
- Download the modified microplot file (i.e. including the modifications of position and orientation and including the properties if any):
From the layers panel, go to SURVEY DATA, Contours, and select the Microplots layer to open the info panel on the right. Click on the 3 dot menu on the top right and Download as GeoJSON: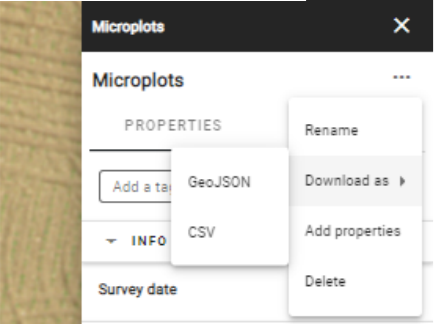
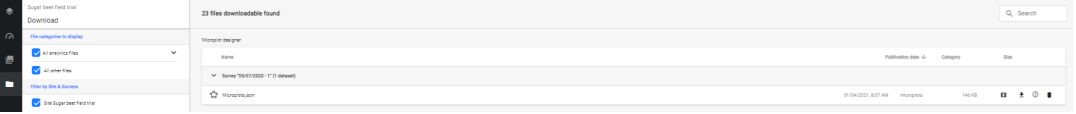
-
Download of the original microplot file (i.e. the file that do not contain any modification): click on the folder button on the left bar, search the file, and click on the arrow to export it.
6. Next steps
Once the adjusted microplot file is generated and positioned on the field trial map, it can be used as input of the analytics.
