• Contact Us close
  • Home
  • Welcome to Alteia keyboard_arrow_right
    Getting Started keyboard_arrow_right
    Quick Guide to the Alteia Software Interface Notification Center Alteia Glossary
    Platform Administration keyboard_arrow_right
    System Requirements and Supported Browsers Account and User Roles Management Company Information Edition User Profile Edition Alteia's Terms of Use - October 2021
    Release Notes keyboard_arrow_right
    Release Note R2022.35 - August 30th, 2022 Release Note R2022.43 - October 25th, 2022 Release Note R2022.47 - November 22th, 2022
    Get Support keyboard_arrow_right
    Contact Support Platform Status
  • The Alteia Platform keyboard_arrow_right
    Fuse
    Build
    Deploy
  • Applications by Industry keyboard_arrow_right
    Worksite Management keyboard_arrow_right
    Site Settings for Mines & Aggregates Material Management Safety and High Walls Analytics Building Information Modeling (BIM) Solar Plant Thermal Inspection Change Map Advanced Stockpile Analytics and Stockpile Module Haul Roads Analytics
    Field Trial Analysis keyboard_arrow_right
    Microplot Designer Plant Height from RGB and Multispectral Plant Count and Emergence for Trial Field Scouting Maps Generic and Custom Scouting Maps Custom Composition Map Supported Crops for Trial Fields & Production Fields Row Vectorization Microplot Boundaries Adjustment Task Fraction of Vegetation Cover (FCover) Flowering Characterization Stay Green Plant Height from LiDAR Statistics for Trial Fields and Production Fields Agriculture and Forestry Analytics Description
    Mine Productivity Analysis keyboard_arrow_right
    Haul Roads Analytics Site Settings for Mines & Aggregates Material Management Safety and High Walls Analytics Change Map Advanced Stockpile Analytics and Stockpile Module
    Plantation and Forestry Management keyboard_arrow_right
    Supported Plantations and Forests Advanced Tree Analysis Tree Detection Grid Designer Tree Density Indicators Agriculture and Forestry Analytics Description
    Precision Agriculture keyboard_arrow_right
    Scouting Maps Generic and Custom Scouting Maps Custom Composition Map Field Boundaries Creation Supported Crops for Trial Fields & Production Fields Fraction of Vegetation Cover (FCover) Stay Green Statistics for Trial Fields and Production Fields Grid Designer Weed Management Plant Count for Production Field Emergence Characterization for Production Field Agriculture and Forestry Analytics Description
  • For Developers keyboard_arrow_right
    SDK and APIs keyboard_arrow_right
    SDK Introduction SDK Use Case Examples Custom Analytics Creation with CLI API Calls Using Alteia and YOLO to Train and Run Detection Models
US
FR
Contact Us
  • Home
  • Welcome to Alteia keyboard_arrow_right
    Getting Started keyboard_arrow_right
    Quick Guide to the Alteia Software Interface Notification Center Alteia Glossary
    Platform Administration keyboard_arrow_right
    System Requirements and Supported Browsers Account and User Roles Management Company Information Edition User Profile Edition Alteia's Terms of Use - October 2021
    Release Notes keyboard_arrow_right
    Release Note R2022.35 - August 30th, 2022 Release Note R2022.43 - October 25th, 2022 Release Note R2022.47 - November 22th, 2022
    Get Support keyboard_arrow_right
    Contact Support Platform Status
  • The Alteia Platform keyboard_arrow_right
    Fuse
    Build
    Deploy
  • Applications by Industry keyboard_arrow_right
    Worksite Management keyboard_arrow_right
    Site Settings for Mines & Aggregates Material Management Safety and High Walls Analytics Building Information Modeling (BIM) Solar Plant Thermal Inspection Change Map Advanced Stockpile Analytics and Stockpile Module Haul Roads Analytics
    Field Trial Analysis keyboard_arrow_right
    Microplot Designer Plant Height from RGB and Multispectral Plant Count and Emergence for Trial Field Scouting Maps Generic and Custom Scouting Maps Custom Composition Map Supported Crops for Trial Fields & Production Fields Row Vectorization Microplot Boundaries Adjustment Task Fraction of Vegetation Cover (FCover) Flowering Characterization Stay Green Plant Height from LiDAR Statistics for Trial Fields and Production Fields Agriculture and Forestry Analytics Description
    Mine Productivity Analysis keyboard_arrow_right
    Haul Roads Analytics Site Settings for Mines & Aggregates Material Management Safety and High Walls Analytics Change Map Advanced Stockpile Analytics and Stockpile Module
    Plantation and Forestry Management keyboard_arrow_right
    Supported Plantations and Forests Advanced Tree Analysis Tree Detection Grid Designer Tree Density Indicators Agriculture and Forestry Analytics Description
    Precision Agriculture keyboard_arrow_right
    Scouting Maps Generic and Custom Scouting Maps Custom Composition Map Field Boundaries Creation Supported Crops for Trial Fields & Production Fields Fraction of Vegetation Cover (FCover) Stay Green Statistics for Trial Fields and Production Fields Grid Designer Weed Management Plant Count for Production Field Emergence Characterization for Production Field Agriculture and Forestry Analytics Description
  • For Developers keyboard_arrow_right
    SDK and APIs keyboard_arrow_right
    SDK Introduction SDK Use Case Examples Custom Analytics Creation with CLI API Calls Using Alteia and YOLO to Train and Run Detection Models
  • Home
  • keyboard_arrow_right Applications by Industry
  • keyboard_arrow_right Plantation and Forestry Management

Advanced Tree Analysis

This all-in-one workflow will enable you to detect trees, measure tree height and provide advanced health and density indicators.

Delete

This task is compatible with Multispectral sensor only.

For RGB sensors it is possible to generate the same analysis by launching each sub tasks individually:

  • Plant height (Plant height from RGB and Multispectral‍)
  • Tree detection (Tree detection‍)
  • Grid Designer (Grid designer‍)
  • Tree density indicators (Tree density indicators‍)

1. Inputs and parameters

  • A DSM extracted from the photogrammetry process
  • Reflectance Map (R,G,B, RE, NIR required) extracted from the photogrammetry process
  • Field boundaries defining the area of interest (How to create a Field Boundaries‍)
  • Minimum Tree Height: minimum accepted plant height
  • Minimum Canopy Radius: minimum accepted canopy radius
  • Maximum Canopy Radius: maximum accepted canopy radius
  • Grid tile size
  • Optimal Tree Density: Ideal number of trees per hectare (used for density indicators)

2. Deliverables

  • Tree crowns vector
  • Tree tops density vector
  • AOI Density vector
  • AOI Grid density vector

Tree crowns vegetation index statistics:

  • Tree crowns statistics NDVI
  • Tree crowns statistics NDRE
  • Tree crowns statistics CCCI
  • Tree crowns statistics MSAVI2
Delete

The deliverables can be exported in another file extension of your choice (csv, dxf, kml, shapefile)


3. Attributes

These are the attributes for the csv and geojson deliverables.

Tree crowns:

  • tree_id: Unique tree id
  • treetop_height: Tree height in m
  • tree_area: crown surface in m2

Tree Tops density:

  • tree_id: unique tree id
  • min_tree_top_distance: distance from the nearest tree (tree top to tree top)
  • min_tree_top_distance_unit: unit
  • mean_tree_top_distance: average distance form the nearest trees (tree top to tree top)
  • mean_tree_top_distance_unit: unit
  • min_tree_crown_distance: distance from de nearest crown (crown to crown)
  • min_tree_crown_distance_unit: unit
  • mean_tree_crown_distance: average distance from the nearest crowns
  • mean_tree_crown_distance_unit: unit
  • nb_touching_crowns: number of crowns that touch the tree (can not be higher than 5)

AOI Density and Grid density:

  • number_of_trees: number of trees in the area of interest (AOI)
  • tree_density: number of trees per ha in the AOI
  • tree_density_unit: unit
  • tree_density_deviation: 100*(tree_density - ideal_tree_density)/ideal_tree_density.
  • tree_density_deviation_unit: unit
  • tree_area: surface covered by the crowns in the AOI
  • tree_area_unit: unit
  • mean_tree_top_distance: average distance between the trees in the AOI (average distance of the five nearest trees for each tree)
  • mean_tree_top_distance_unit: unit
  • mean_min_tree_top_distance: lowest average distance between the trees in the AOI (ie average distance between the nearest tree for each trees)
  • mean_min_tree_top_distance_unit: unit
  • mean_tree_crown_distance: average distance between the crowns in the AOI (ie average distance of the five nearest tree crowns for each trees)
  • mean_tree_crown_distance_unit: unit
  • mean_min_tree_crown_distance: lowest average distance between each crown in the AOI (ie average distance of the nearest crown for each tree)
  • mean_min_tree_crown_distance_unit: unit
  • mean_nb_touching_crowns: average number of crowns that touch a crown in the AOI

4. Workflow

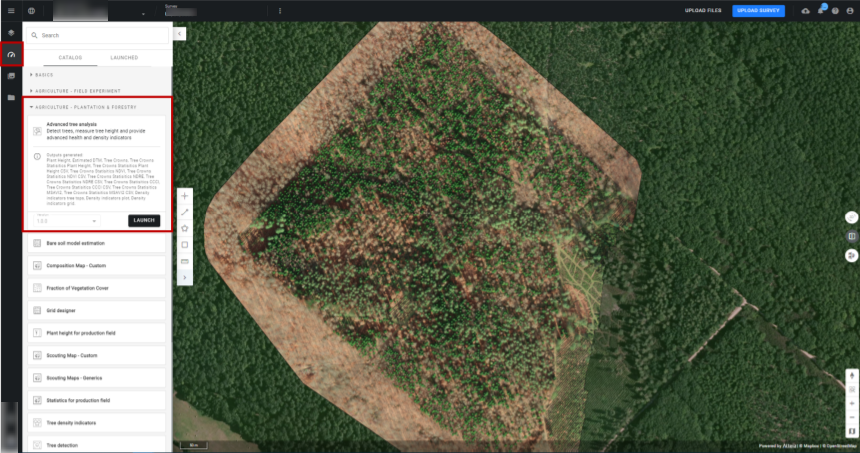
Step 1: Once in your project, you need to launch the analytic “Advanced tree analysis” from the Analytic Catalog.
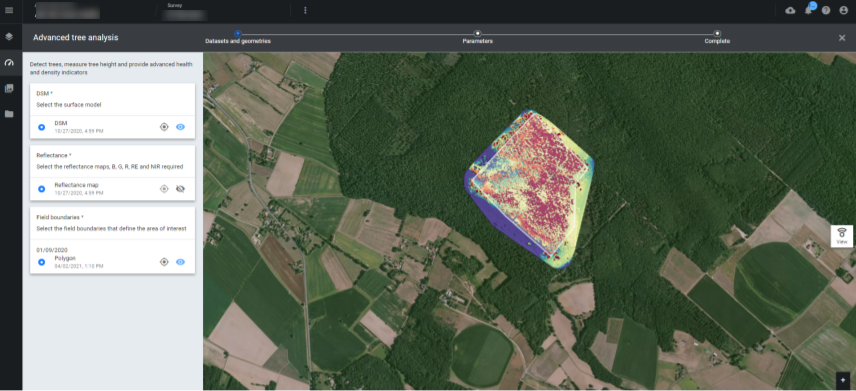
Step 2: Select your file inputs, DSM, Reflectance map and Field boundaries. You can click on the small eye icon to visualize the layers.
Step 3: Define your parameters and click on the “Launch advanced tree analysis” button.

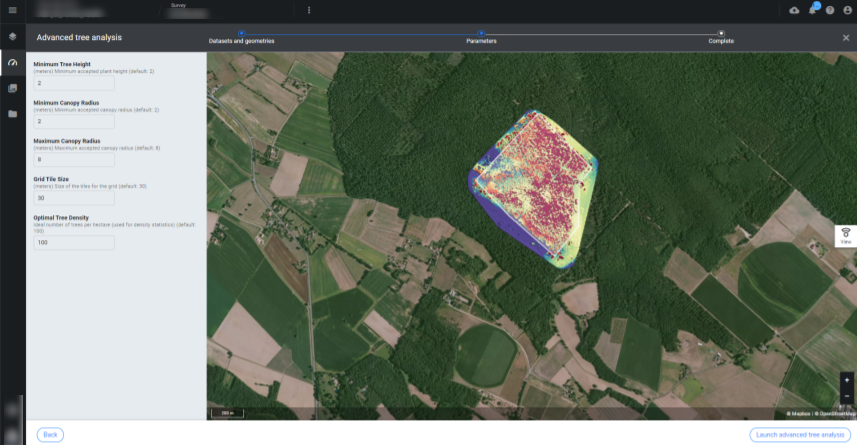
  • Minimum Tree Height: 2 meters by default
  • Minimum Canopy Radius: 2 meters by default
  • Maximum Canopy Radius: 8 meters by default
  • Grid tile size: 30 meters by default
  • Optimal Tree Density: 100 trees per hectare by default

5. The results

You can visualize the results by selecting the “Inventory” layer from the SURVEY DATA section on the left side menu.

  • When displaying the Tree crowns, you can choose to display the results based on specific attributes, by opening the Information Panel.
  • You can choose between:
    • Neutral
    • Tree crown surface
    • Tree height

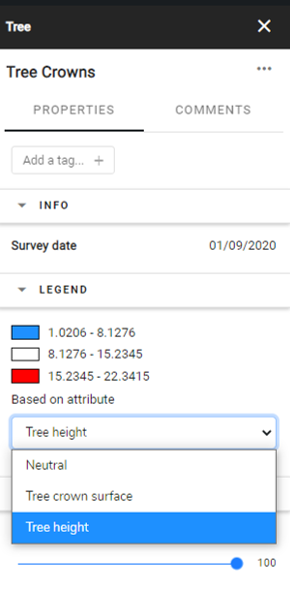
The map will show a color based classification and the legend, will be visible on the Information Panel.
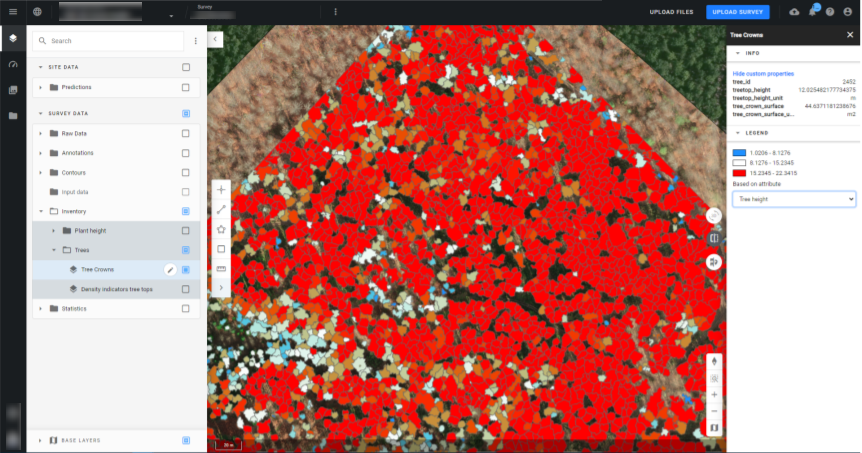
By clicking on a detected tree, the attributes of that tree will appear also in the information panel.

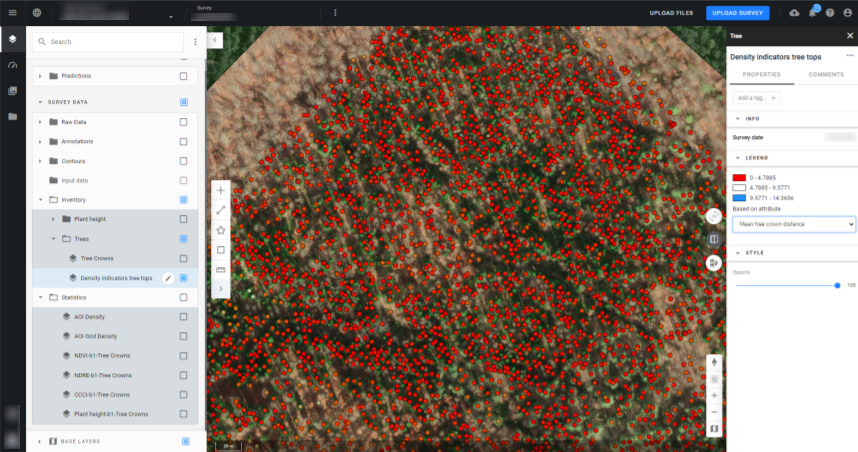
  • When displaying the Tree tops density you can choose to display the results based on specific attributes, by opening the Information Panel.

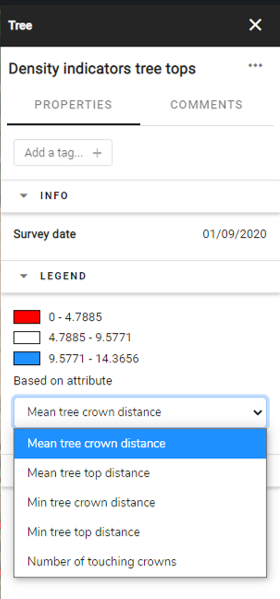
You are able to see the density at the tree level:

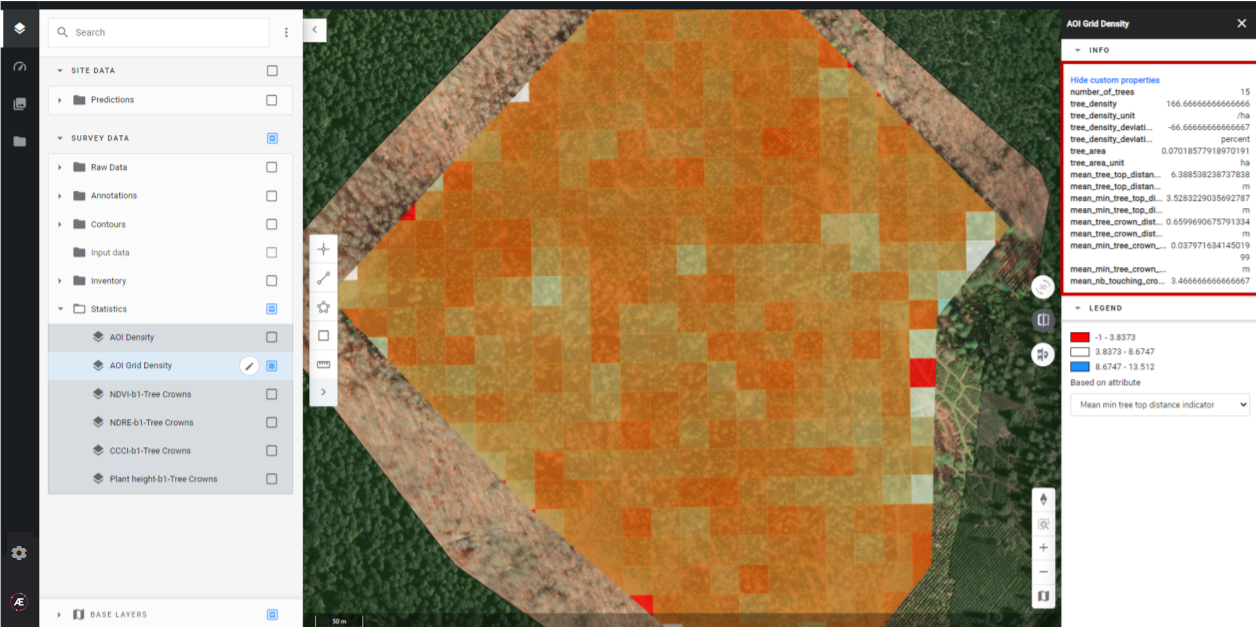
  • When visualizing the AOI Grid density you will be able to visualize the tree density by zones. You can also choose the attribute you want to take into account for the grid visualization.

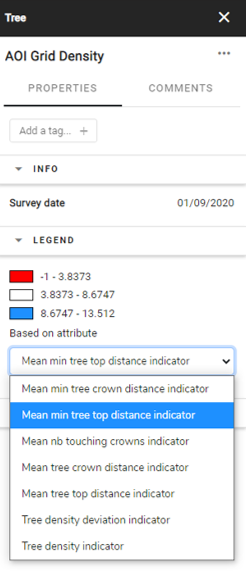
In this case the grid shows the results based on the attribute “ Mean min tree top distance indicator”:

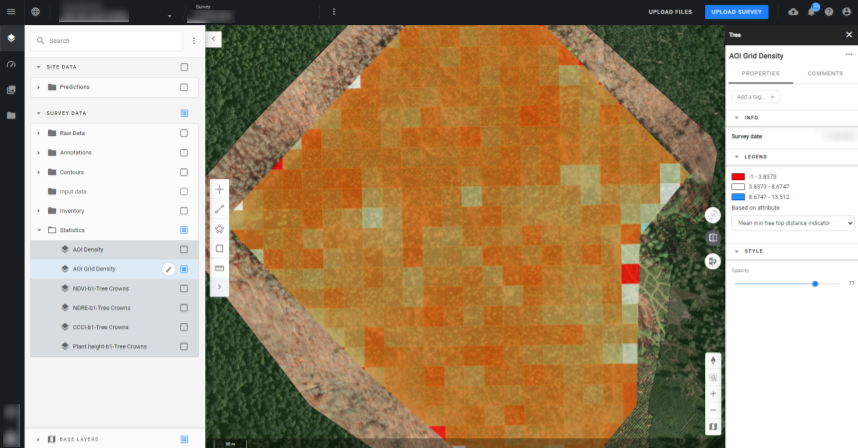
When clicking on a determined area on the grid, you will be able to see the attributes of the zone on the Info Panel:

Was this article helpful?

sentiment_satisfied

Yes

sentiment_dissatisfied

No

RELATED QUESTIONS

  • Supported Plantations and Forests arrow_forward
  • Agriculture and Forestry Analytics Description arrow_forward
  • Generic and Custom Scouting Maps arrow_forward
  • Upload of Images for Agriculture & Forestry arrow_forward

Sorry, we didn't find any relevant articles for you.

Please fill out the contact form below and we will reply as soon as possible.


Take the next step.

Request a demo or schedule a meeting to discuss your digital transformation ambitions.

Contact Us

Connect with us.

The world of Ai changes fast. Keep up to date with the Alteia platform by signing up to our newsletter :

Thank you for your message.

© 2021 Alteia. All rights reserved

LEGAL NOTICE
PRIVACY POLICY

© 2021 Alteia. All rights reserved

facebook logo
twitter logo
linkedin logo