

Vegetation Encroachment
1. Description
The Vegetation Encroachment detects vegetation surrounding power lines with advanced features. Starting from a LiDAR or photogrammetry point cloud with existing classified data, and using a vector as a reference for the analysis, the analytics can identify and group all the dangerous trees that are near a power line, creating a risk map.
The risk map layer highlights critical zones where vegetation is detected too close to the digitized conductors. These zones are colored, to indicate severity, in terms of proximity to the power lines. The resulting outputs enable you to more quickly and confidently make decisions for vegetation management, such as planning for pruning operations, in terms of total volume to trim and priority zones.
2. Prerequisites
| Required inputs | Notes |
| Point cloud corridor/area | The point cloud contains the inspected line and the surrounding vegetation to be analyzed. A basic classification provided by Aether's analytics is sufficient to run the vegetation encroachment analysis |
| Line vector | It is a 2D vector containing the inspected line's path. It is required to properly identify the line to be used as a reference for the analysis |
| Optional inputs | Notes |
|
Precomputed Network Grid File For Network Digitization |
Network grid file computed during a previous run to speed up the network digitization |
|
Precomputed Corridor Grid File For Risk Computation |
The corridor grid file computed from the corridor shape to aggregate the risk |
3. Workflow
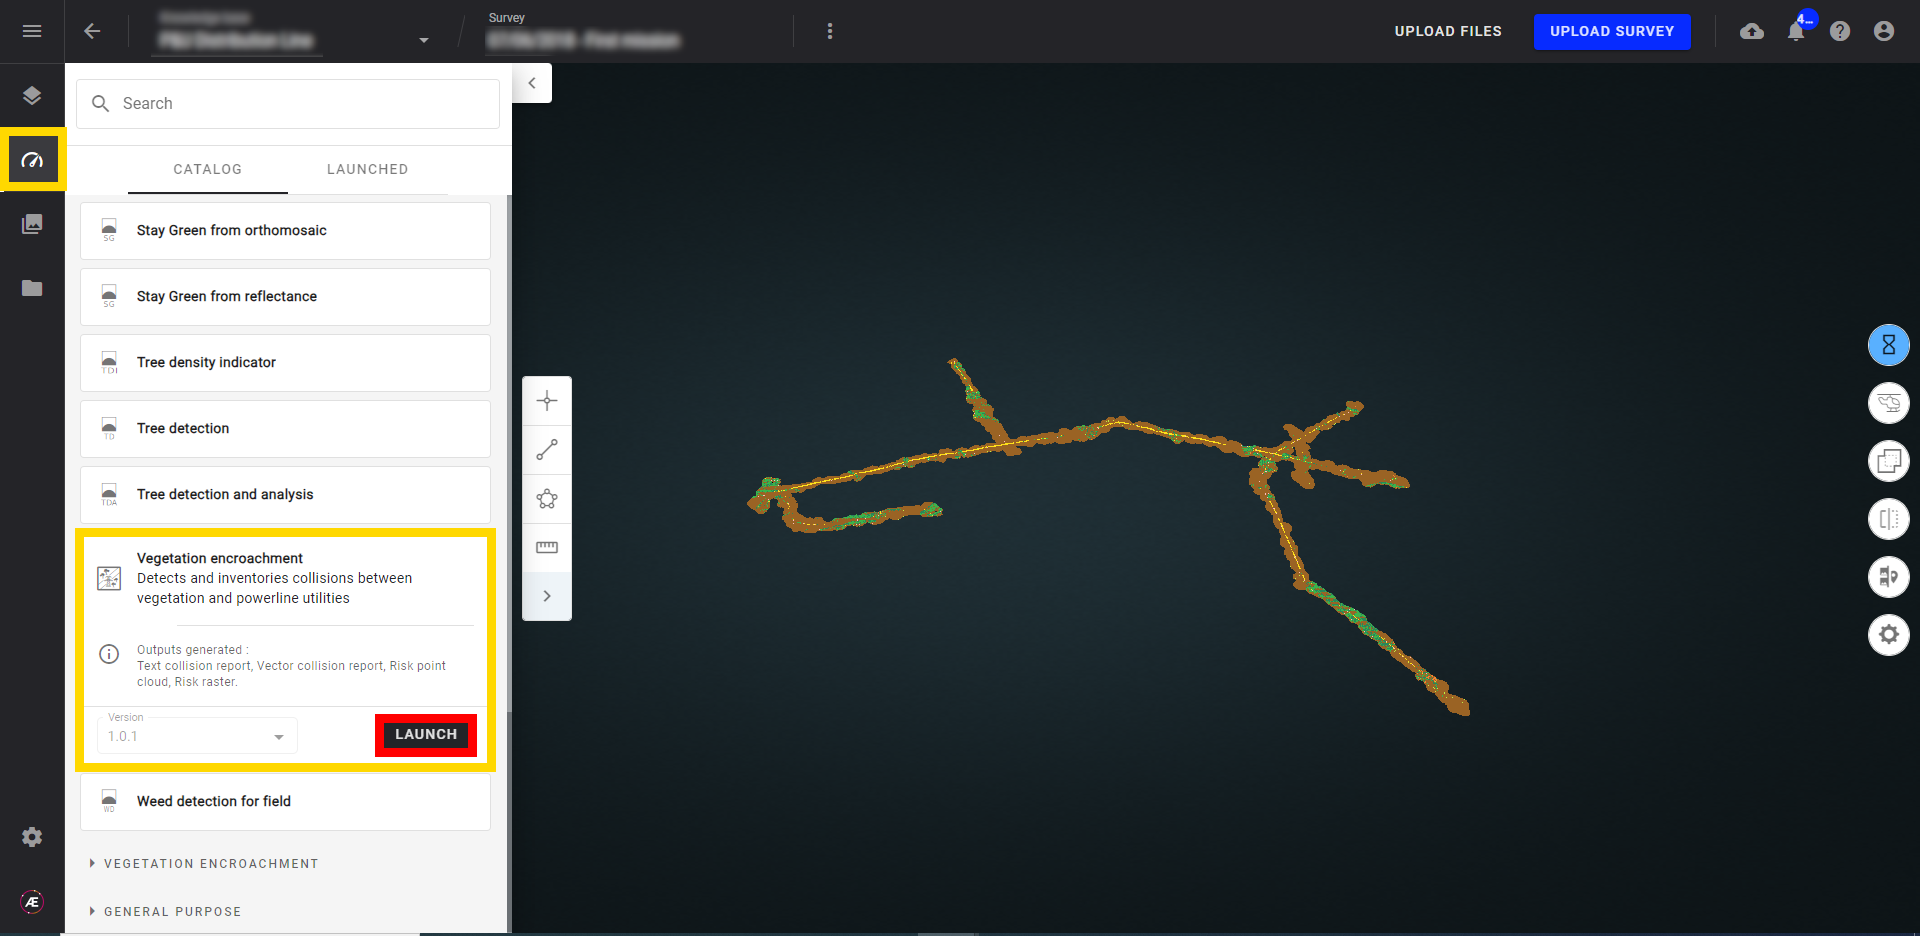
Step 1 - In the "Analytics" tab, search and select "Vegetation encroachment" (in the "VEGETATION ASSESSMENT" group) and click on "LAUNCH".
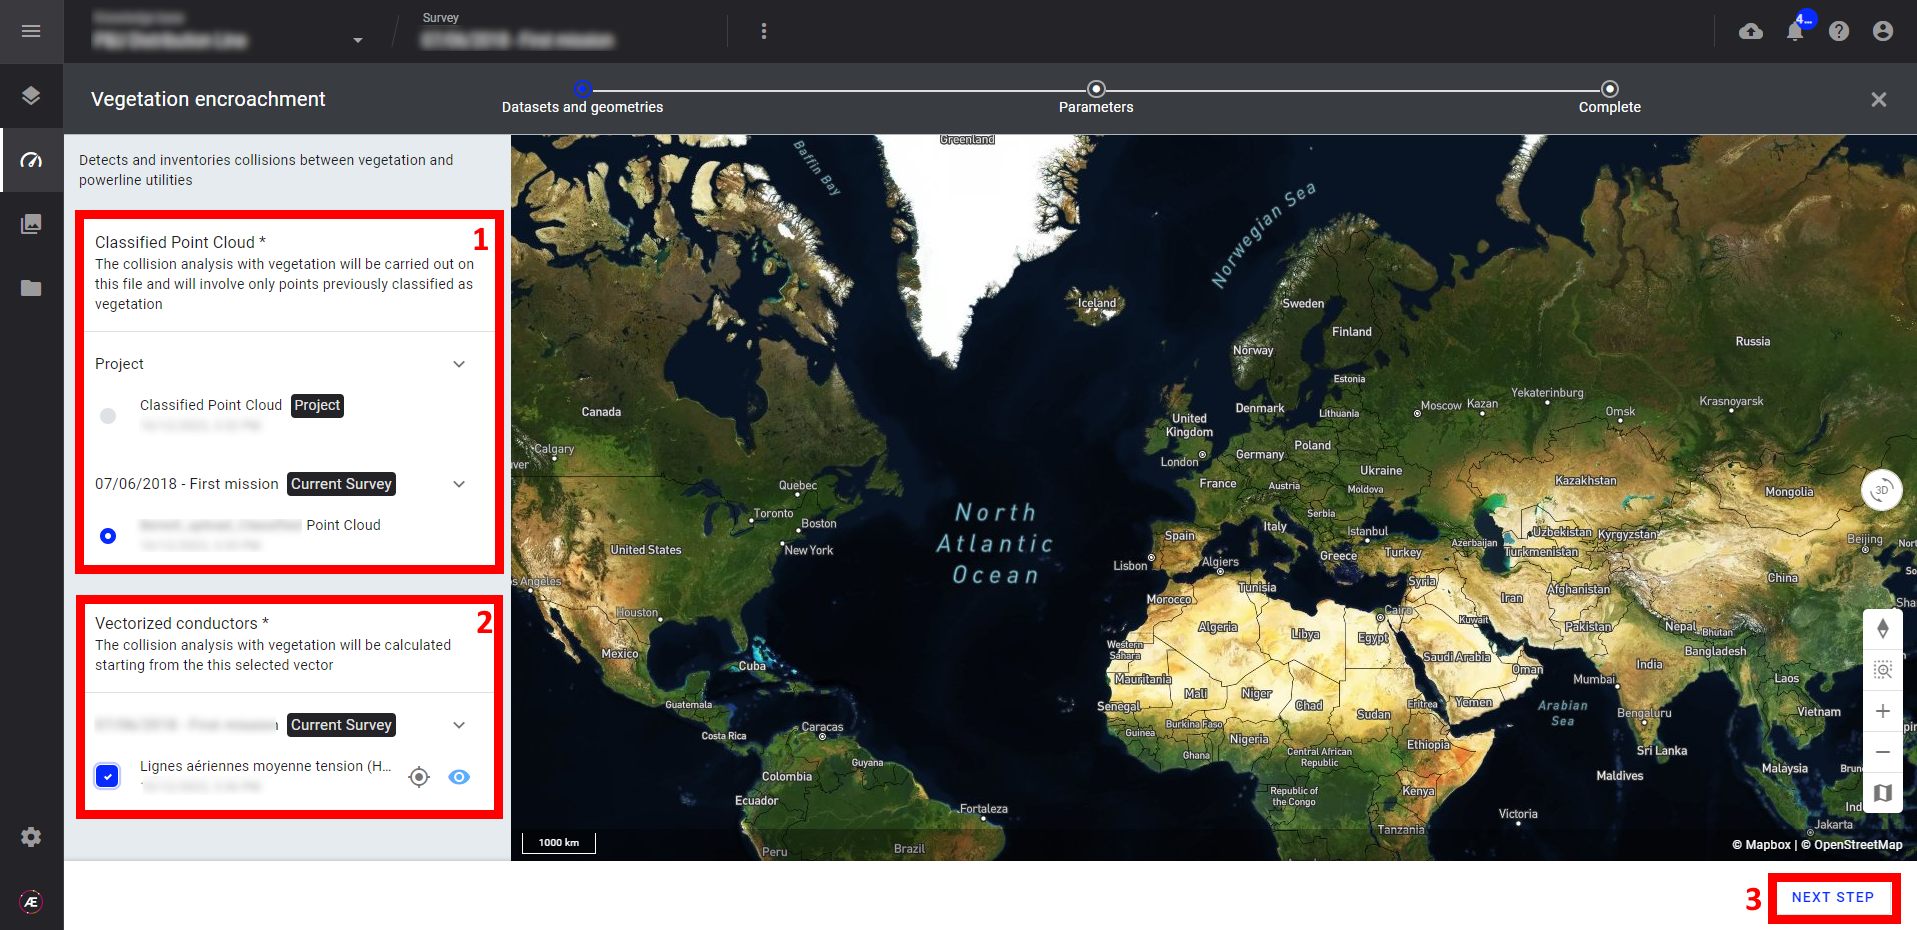
Step 2 - Select the "RGB " map (1) and the "Field Boundaries" (2) (field boundaries vector, microplot) and click on "NEXT STEP" (3).
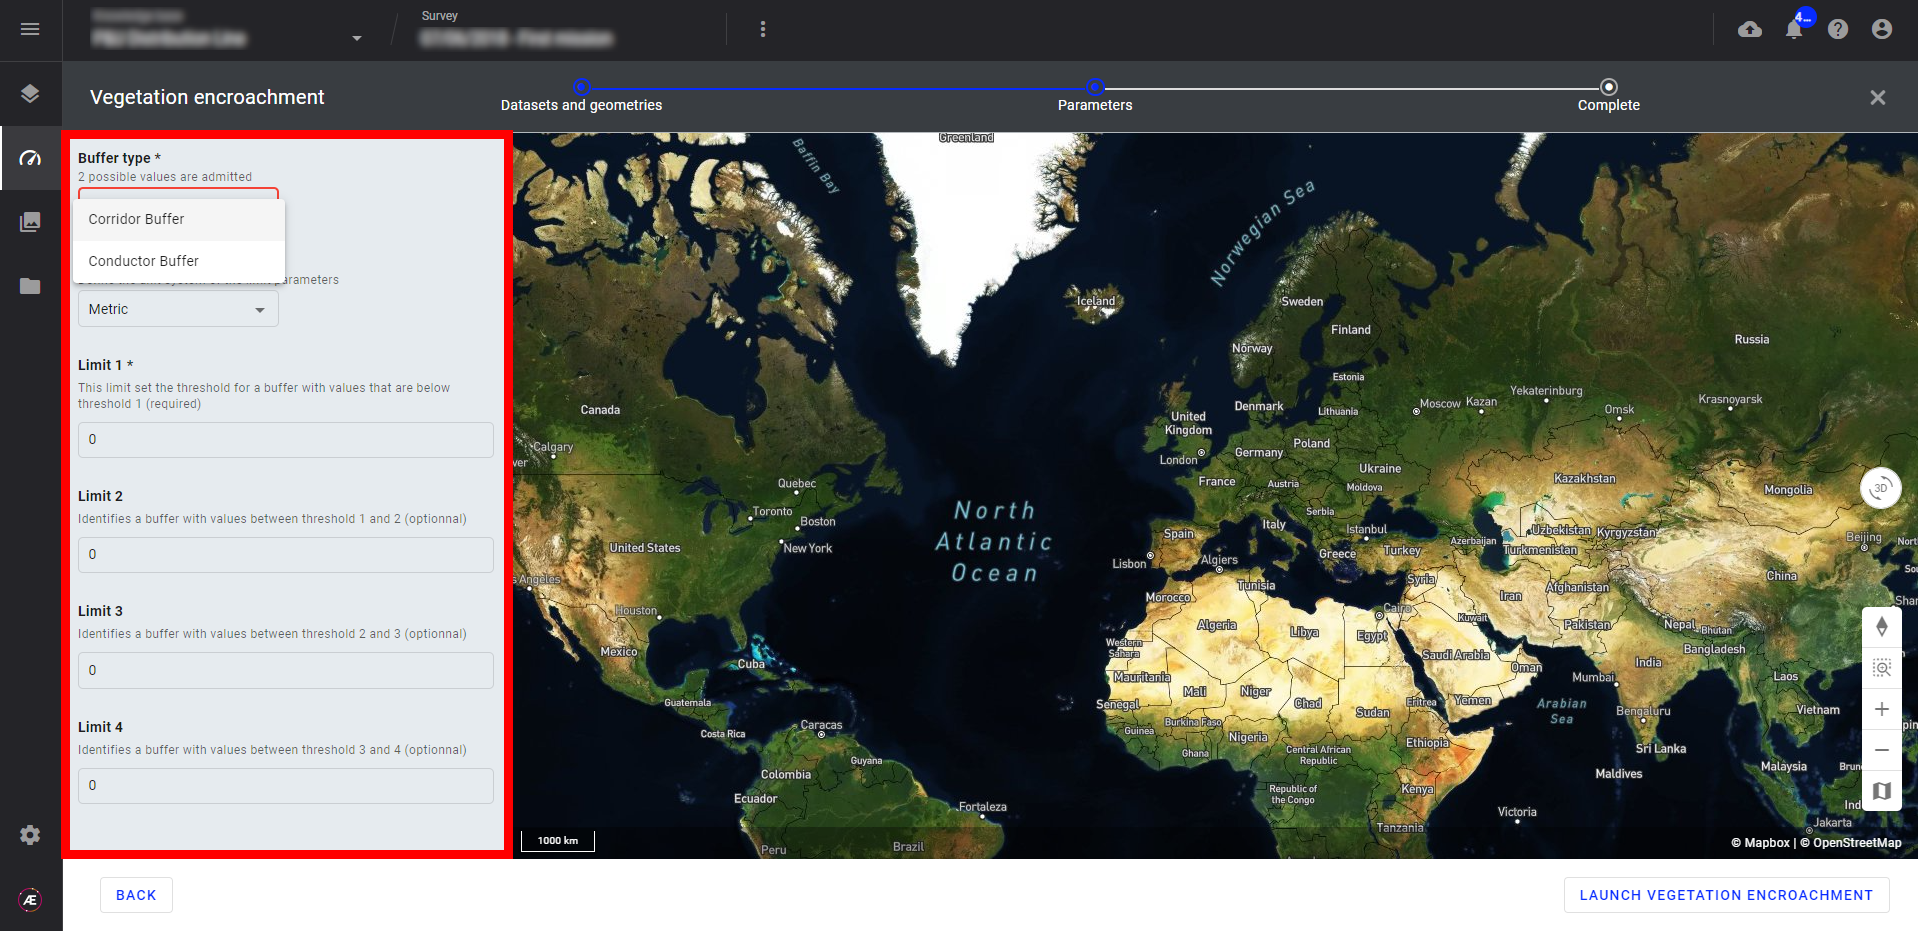
Step 3 - Select the "Buffer type" (2 choices), the "Unit system" and define the Limits.
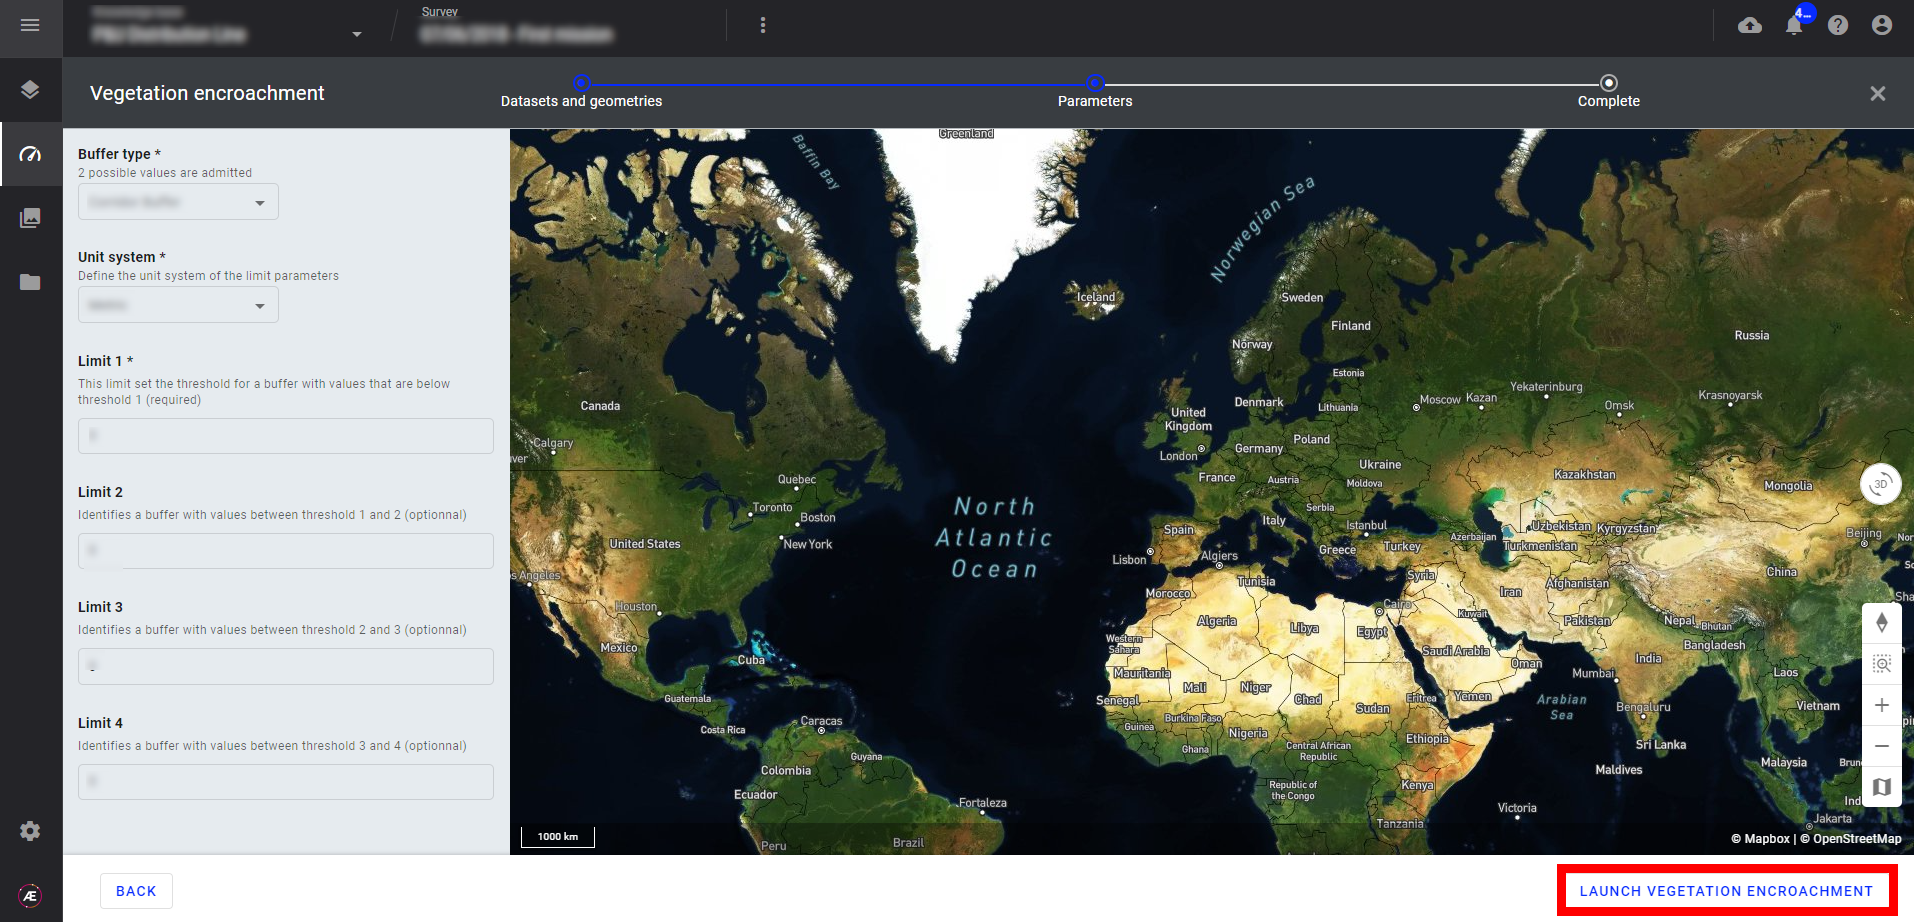
Step 4 - Click on "LAUNCH VEGETATION ENCROACHMENT".
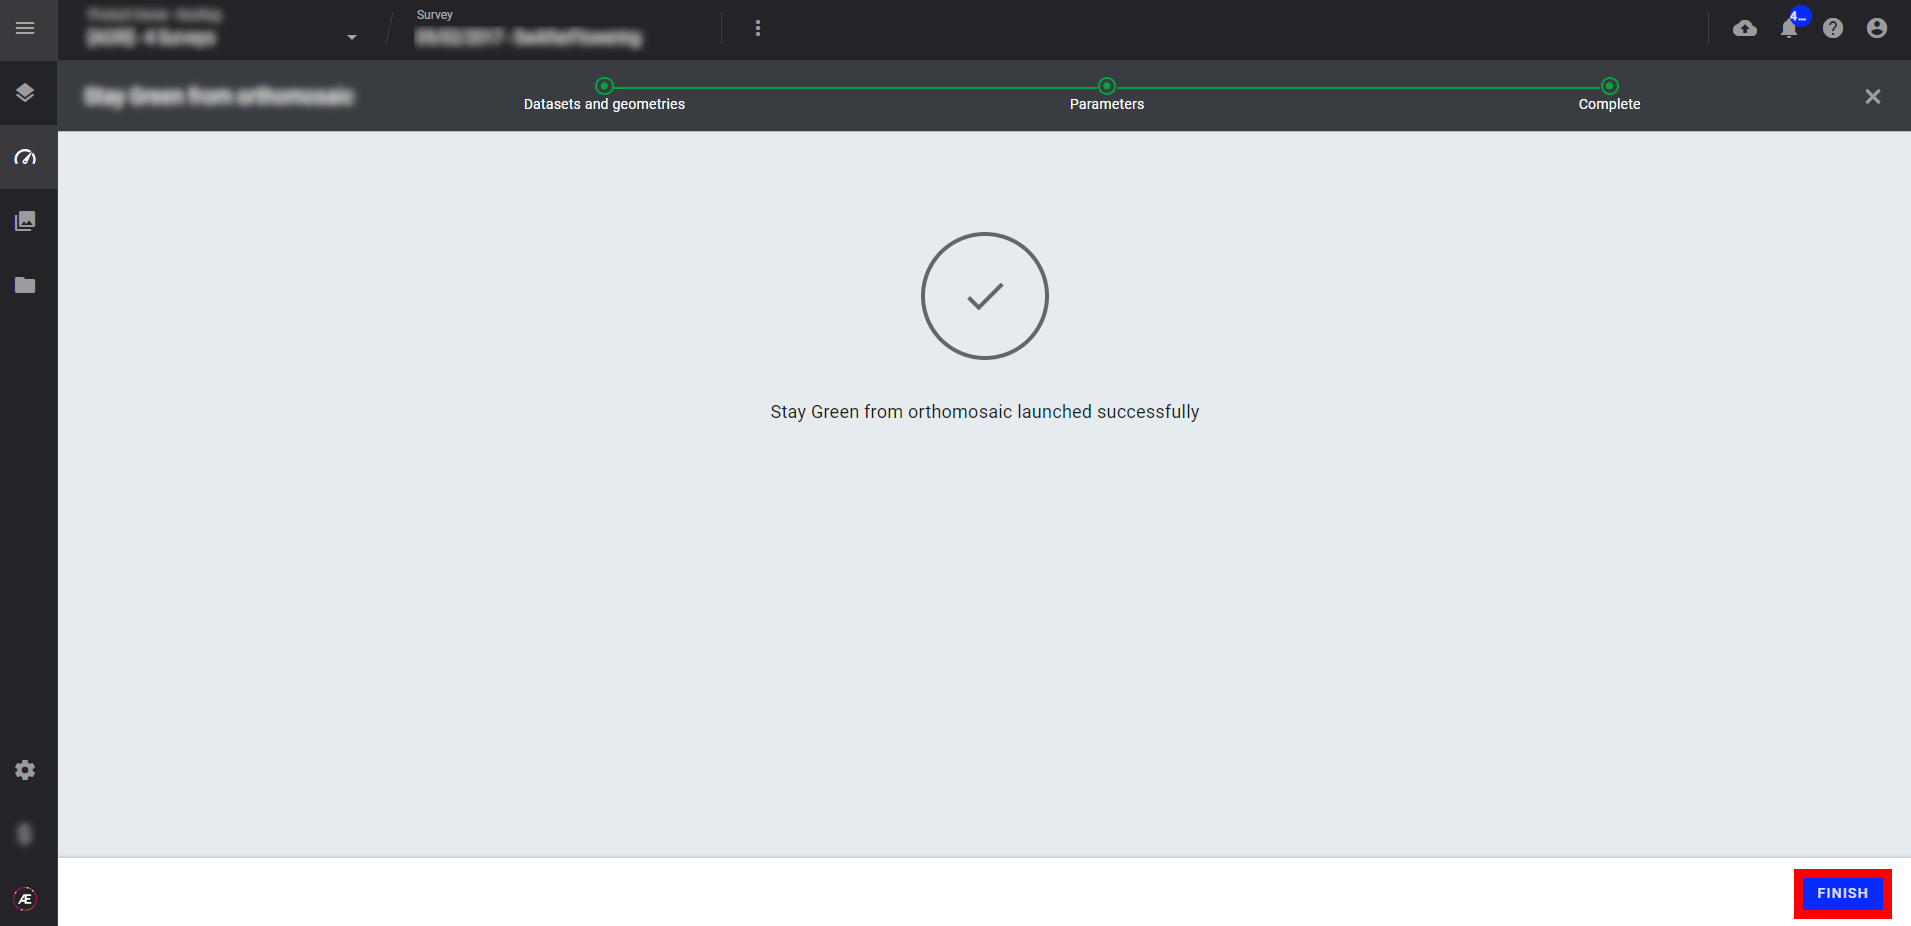
Step 5 - Click on "FINISH".
4. Status and Progression
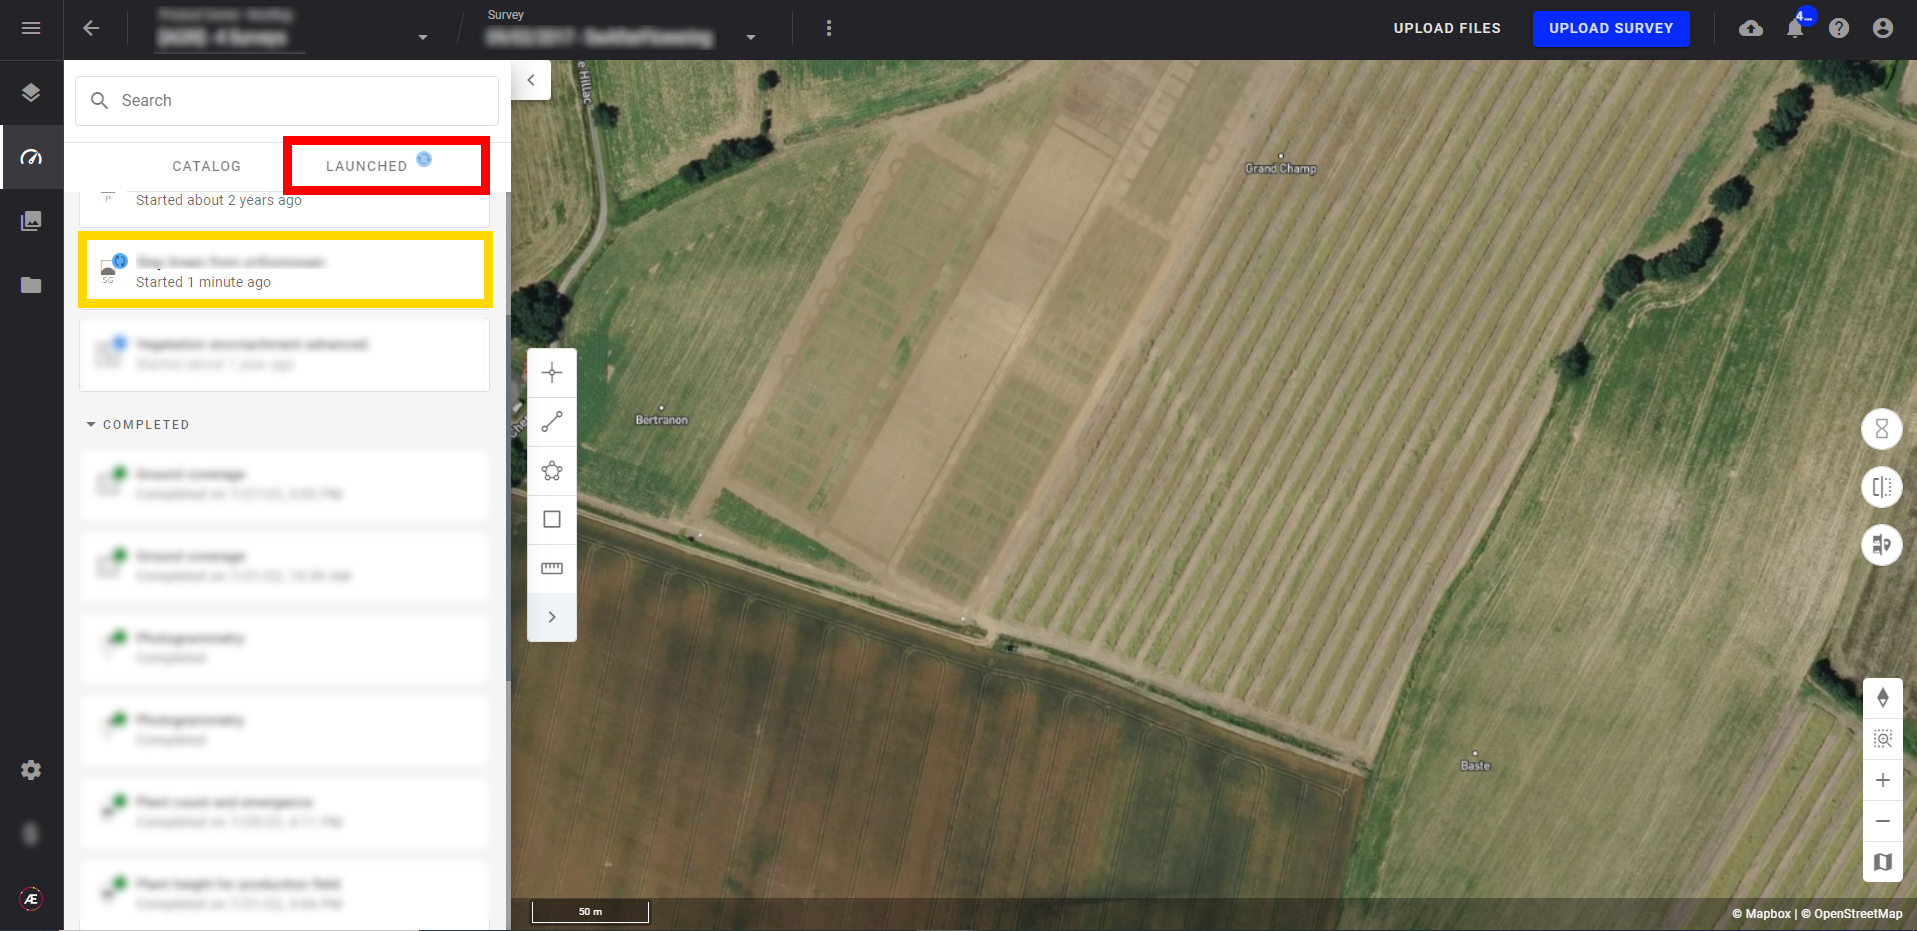
Check in the "LAUNCHED" tab that the analytics is in progress.
Aether will notify the user that the analytics results are available.
5. Results
5.1 View the risk map
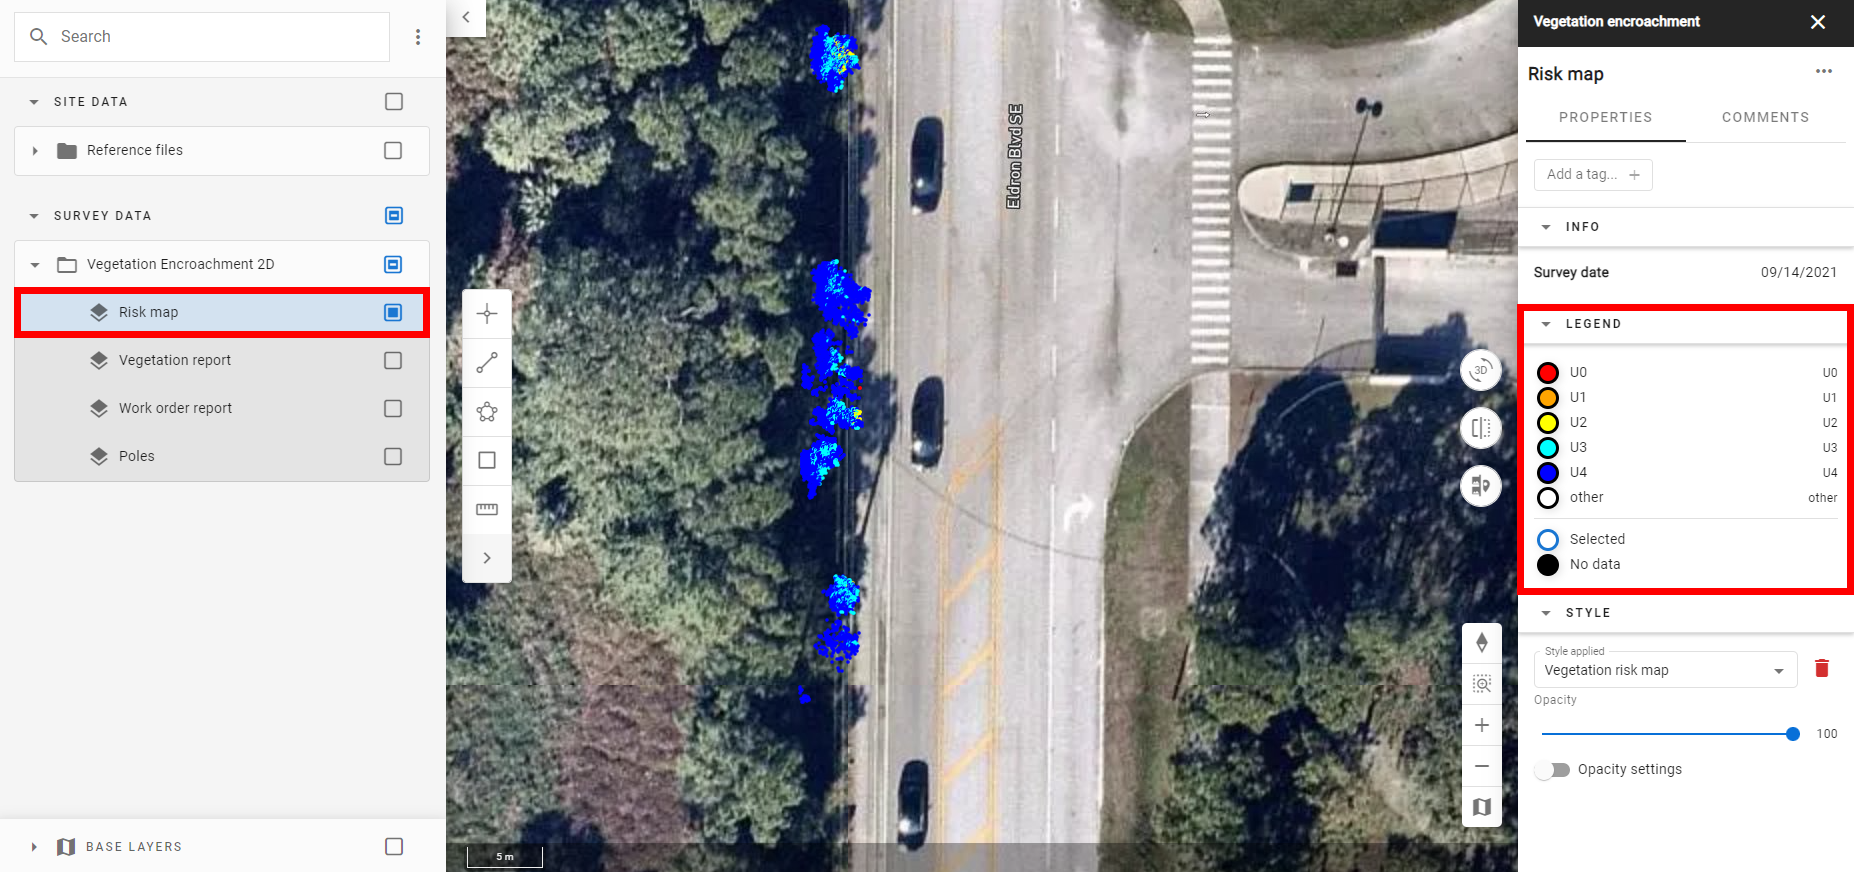
The risk map shows, with different colors, related to the trimming priority, all potential vegetation encroachments identified by the automated analysis.
The risk map can be seen in 2D and 3D. An example of a 2D view is provided below.
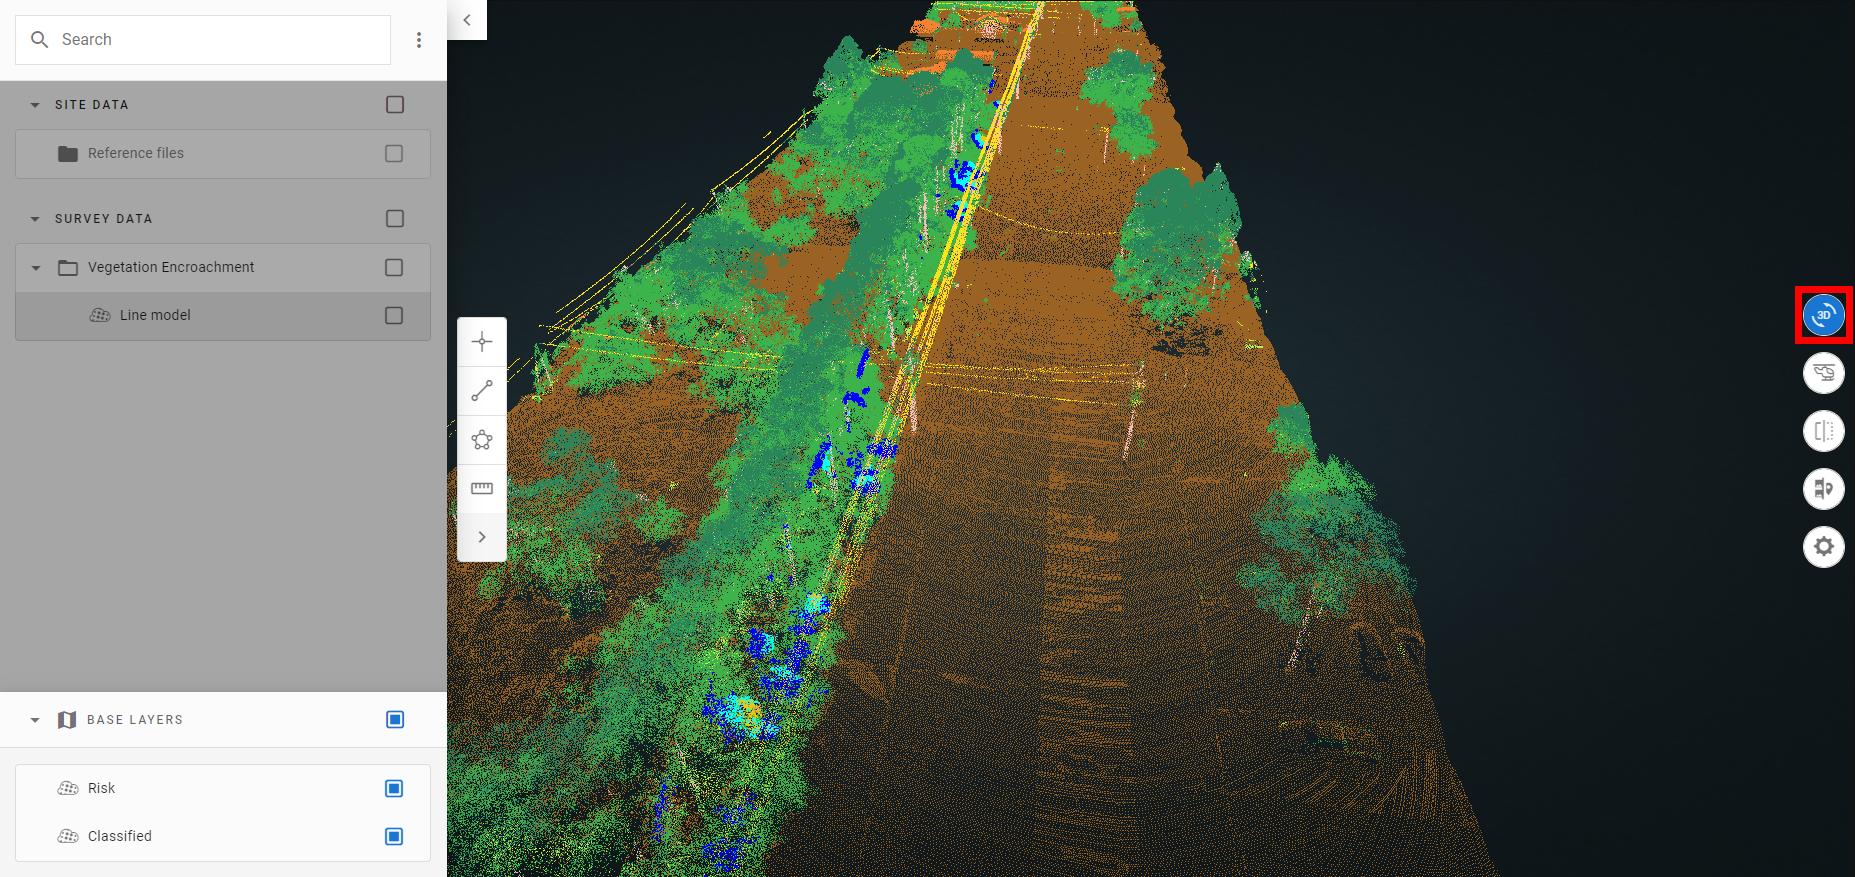
To view the risk map in 3D, within the survey, change the view from 2D to 3D by selecting 3D from the viewing menu on the right-hand side.
5.2 View the vegetation report and the work order report
To make trimming activities easier, the identified risk areas can also be represented with vegetation clusters each having a color related to the trimming priorities of trees inside.
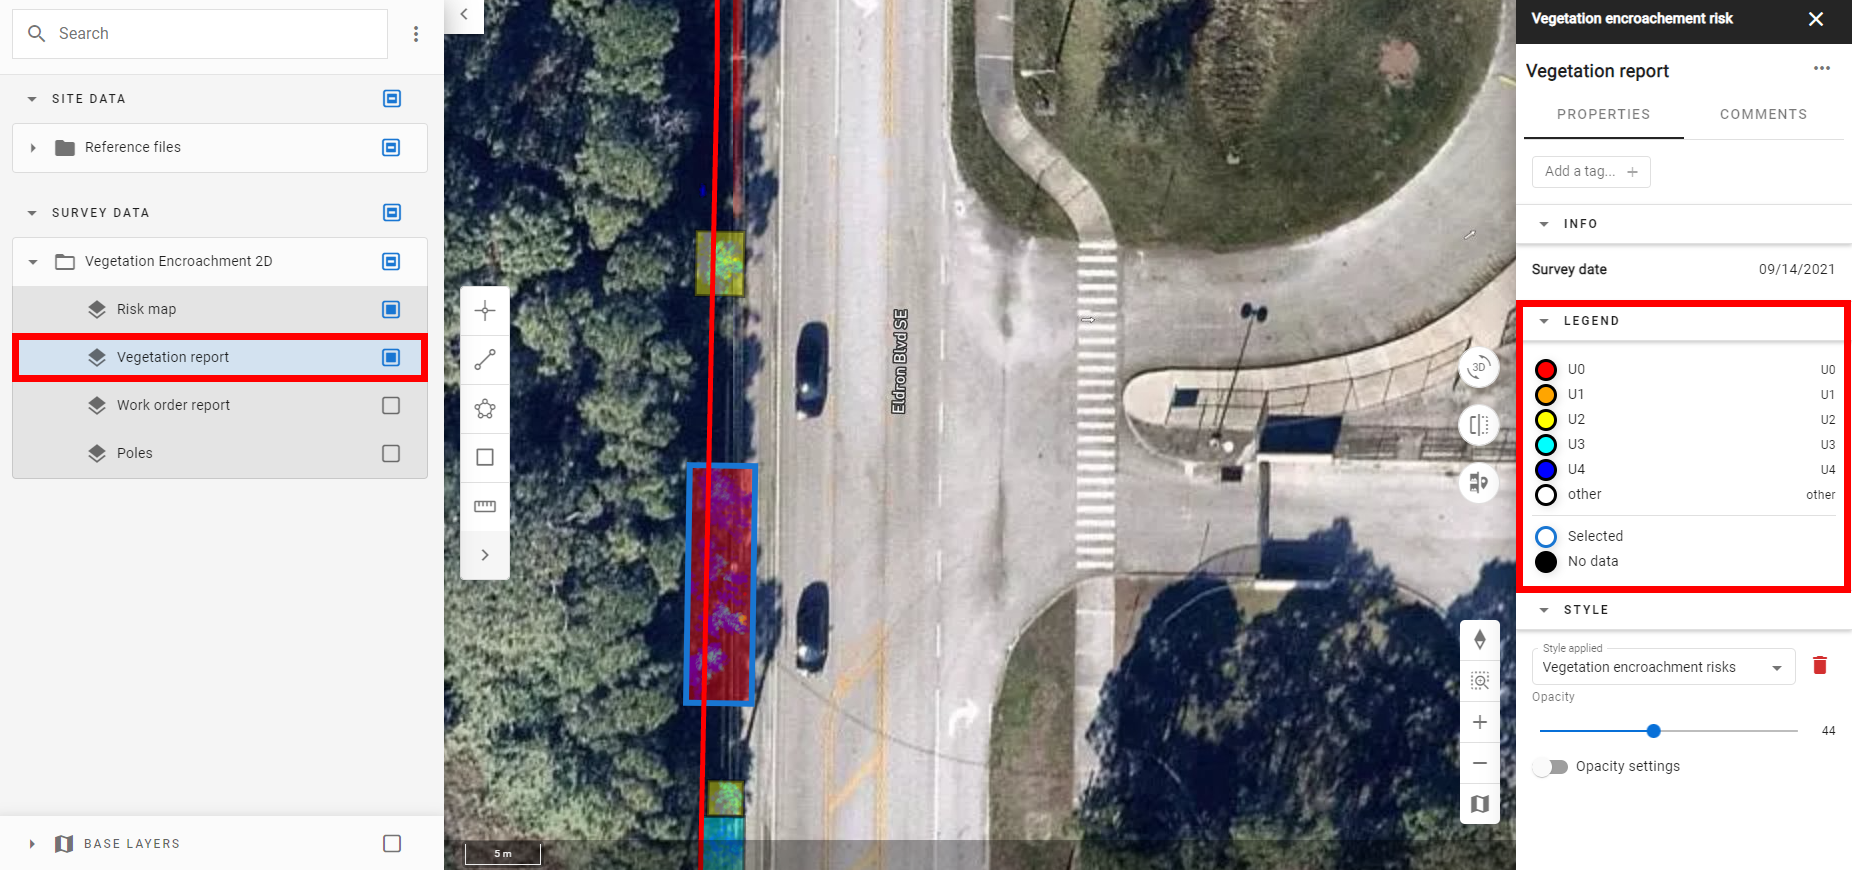
The colored clusters are vectors each having its attributes (like the trimming priority, the minimum distance to the power line, the volume of vegetation to trim, etc.), and can also be grouped following custom criteria related to O&M activities.
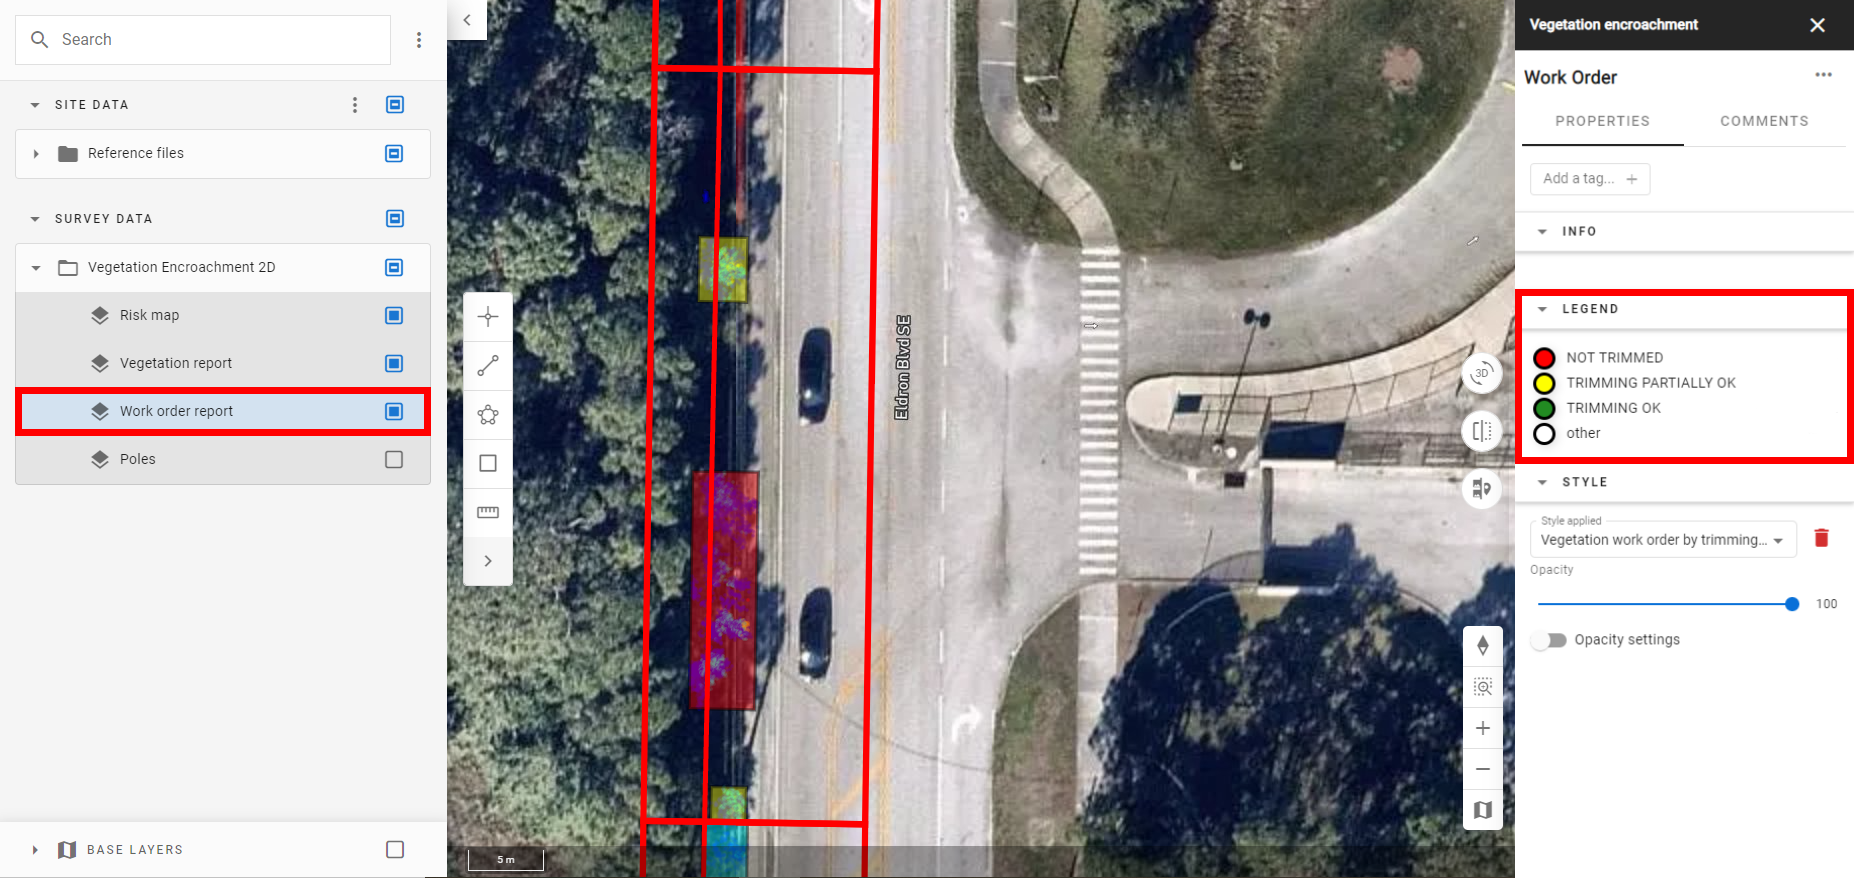
An example is represented by the "work order layer" that shows with each cluster a volume of activity that can be carried out by field teams. For each cluster, it is possible to define some attributes, like trimming status, to track the status of future trimming activities for the area
6. Deliverables
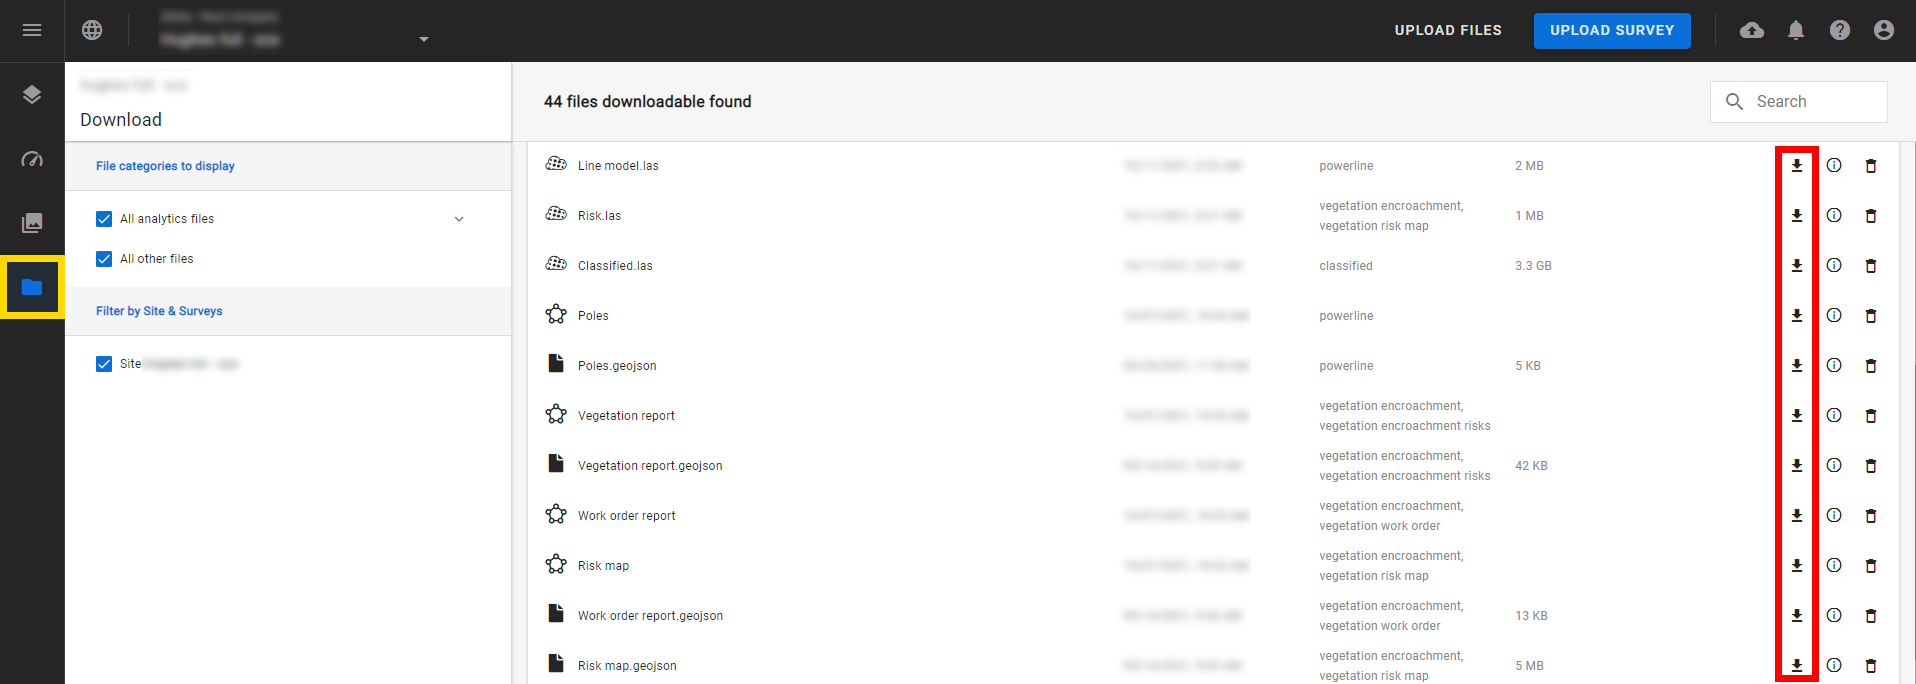
6.1 Exporting the data to a point cloud.
All the layers mentioned above are available in the download section.
Select the downloads icon from the left-hand menu. Select the project you're operating in, and select the download icon to the right of the vegetation encroachment (.las) file.
6.2 Outputs description
| Output type | Description |
| Risk Map | It is a vector showing punctually all the possible encroachment points identified by the automated vegetation encroachment analytics. |
| Vegetation Report | It is a vector report composed of clusters of vegetation, each representing some portions of vegetation to be cut. Clusters may have different sizes and shapes ( normally rectangular) and are provided with attributes ( like GPS coordinates of the point at the closest distance from the line or priority) that make them a deliverable ready to use for operations. |
| Work order Report | It is a vector report composed of clusters, each representing a volume of trimming activities. Each cluster of the work order report is provided with attributes like the priority of trimming or the trimming status that make the report ideal for managing and supervising trimming operations. |
