

Plant Height from LiDAR for Microplot
This analytic automatically estimates plant height from LiDAR Data in field trials.
1. Inputs
- Point Cloud in LAS format*
- Microplots vector file*
- Deliverables suffix
- Field trial start*: A point annotation made in Aether defining the field trial start
- Minimum Height: Minimum plant height to be used in the statistics computation
- Maximum Height: Maximum plant height to be used in the statistics computation
*Mandatory
2. Deliverables
- Plant height statistics CSV + suffix .csv: CSV file with plant height statistics at microplot level
- Plant height statistics +suffix .geojson: Vector file with plant height statistics at microplot level*
- Plant height +suffix .tif: Raster file with plant height at pixel level
- DTM.tif: Digital Terrain Model
- DSM.tif: Digital Surface Model
*Other format are available if needed (Shape file…)
3. Attributes
“Plant height statistics geojson output:
- Attributes from the input vector file (parent_id, block_plot_id,… if the vector is from Aether)
- max: Maximum plant height
- mean: Average plant height
- median: Median
- min: Minimum plant height
- count: Number of pixel in the polygon
- std-dev: Standard deviation
- var: Variance
- decile_1: decile 1
- decile_2: decile 2
- decile_3: decile 3
- decile_7: decile 7
- decile_8: decile 8
- decile_9: decile 9
- percentile_1: percentile 1
- percentile_5: percentile 5
- percentile_95: percentile 95
- percentile_99: percentile 99
“Plant height statistics CSV output:
- Attributes from the input vector file (parent_id, block_plot_id,… if the vector is from Aether)
- max-out_plant_height-b1: Maximum plant height
- mean-out_plant_height-b1: Average plant height
- min-out_plant_height-b1: Minimum plant height
- count-out_plant_height-b1: Number of pixel in the polygon
- std-dev-out_plant_height-b1: Standard deviation
- var-out_plant_height-b1: Variance
- decile_1-out_plant_height-b1: decile 1
- decile_2-out_plant_height-b1: decile 2
- decile_3-out_plant_height-b1: decile 3
- decile_7-out_plant_height-b1: decile 7
- decile_8-out_plant_height-b1: decile 8
- decile_9-out_plant_height-b1: decile 9
- percentile_1-out_plant_height-b1: percentile 1
- percentile_5-out_plant_height-b1: percentile 5
- percentile_95-out_plant_height-b1: percentile 95
- percentile_99-out_plant_height-b1: percentile 99
4. Workflow
Upload the point cloud (LAS file)
- Create a new project if there is no existing one (see here for more information on Project Creation )
- Click on "UPLOAD FILES".

- Select a new survey or select an existing one if any.
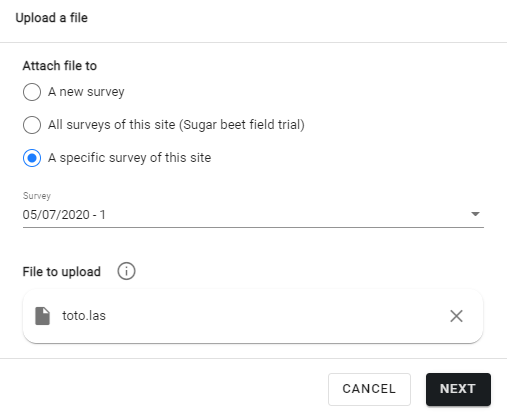
- On the next page, the Type “Point Cloud” is normally selected by default. Select “None” in Category.
- Define the CRS
- Click on Upload
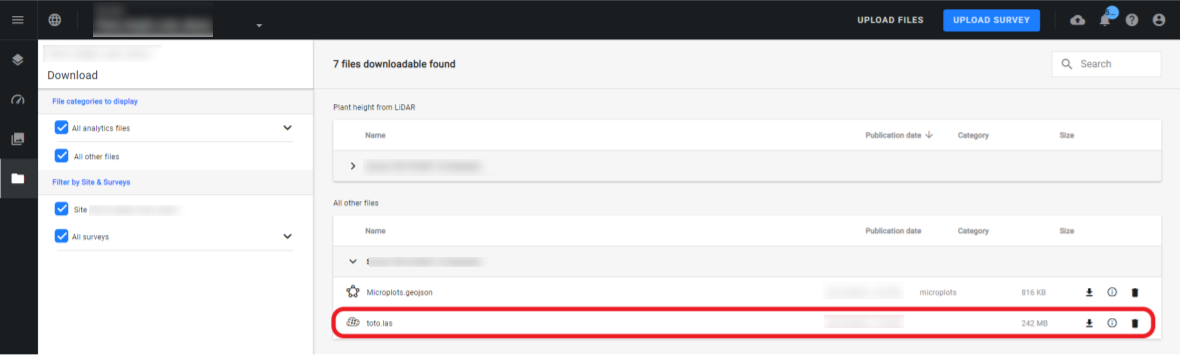
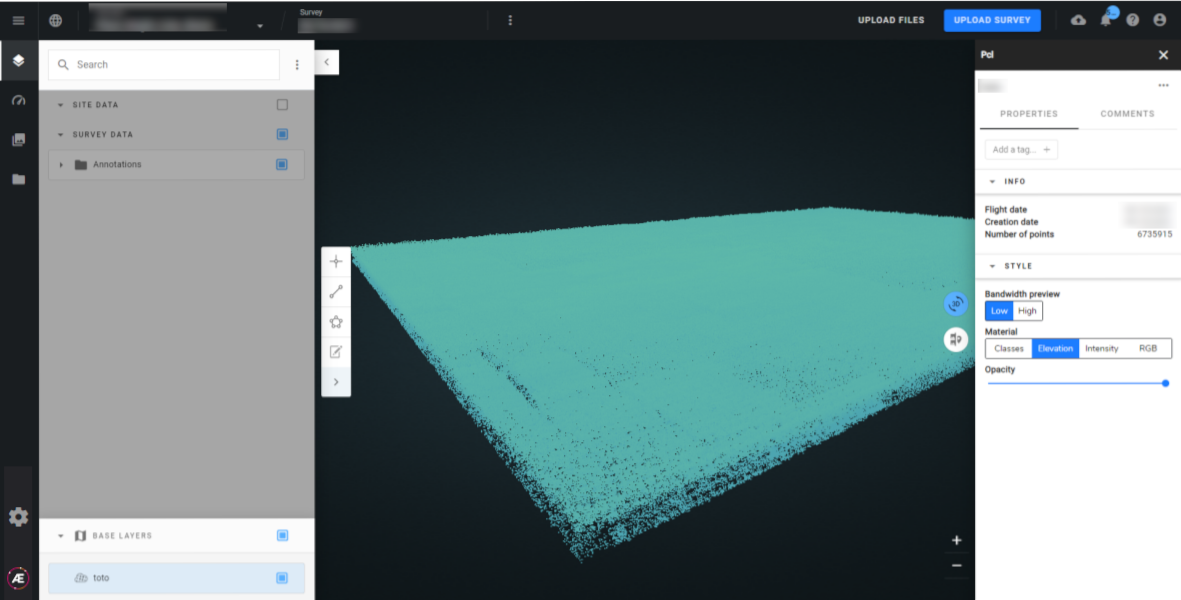
- Once the upload is complete, the file is visible in the download section and in the 3D view:
Upload the microplot vector file
- Click on "UPLOAD FILES"
- Select the same survey as the point cloud and click on “next”
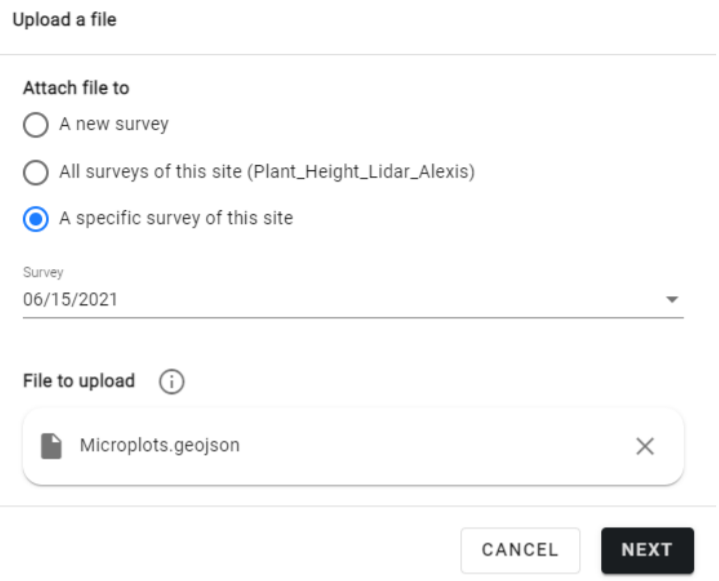
- Select Vector in Type and Microplots / Plots in Category
- If not automatically defined, select the CRS of the microplot file and click on Upload.
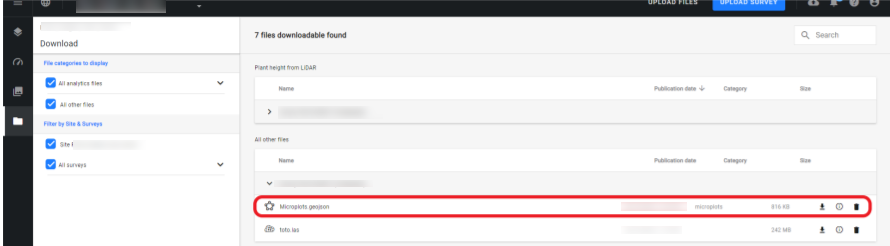
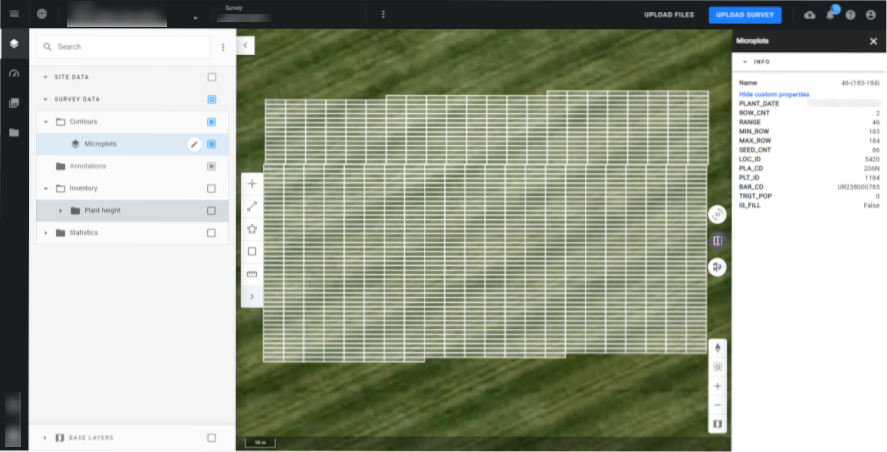
- Once the upload is complete, the microplot file is visible in the download section and in the 2D view
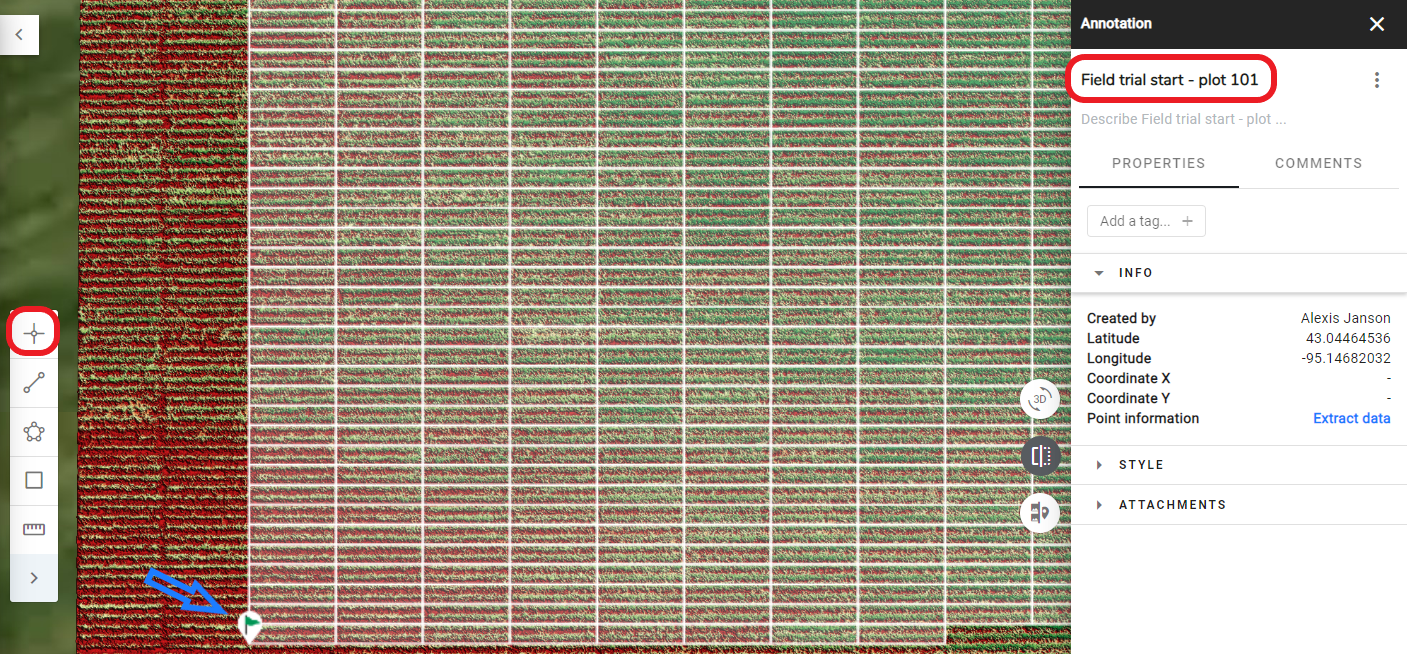
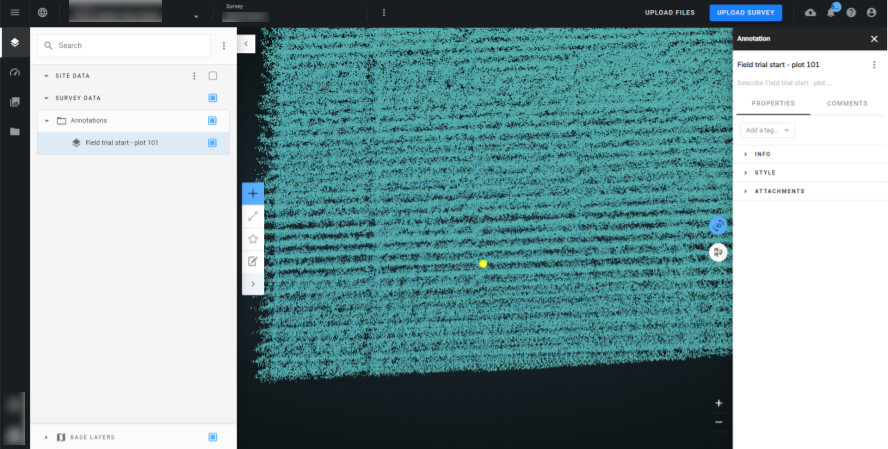
Definition of the field trial start
Case 1: a RGB map (or NDVI / VARI Index) is available in the survey
- Display the 2D map
- Select the Point annotation tool
- Add a point at the corner of the first plot of the trial.
- Change the name of the annotation (Field trial start - “first plot name”) then click on Enter to validate
- You can change the icon (green flag for example)
Case 2: I only have a point cloud and a microplot vector file (no 2D map available).
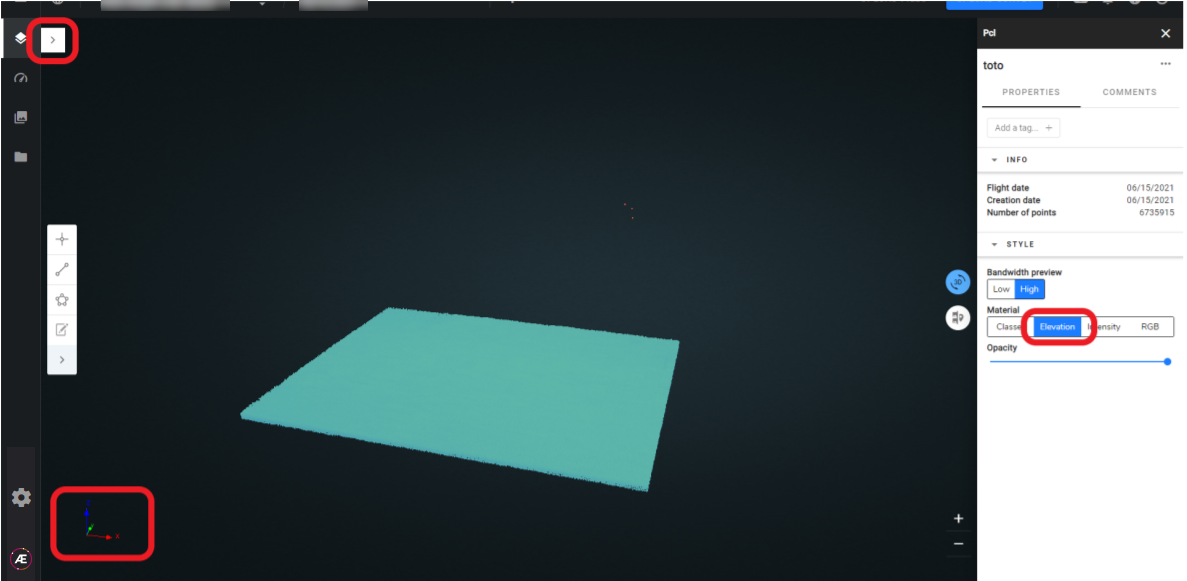
- Display the point cloud in the 3D view, select “Elevation” in Material (cf above)
- Select the Point annotation tool
- Add a point at the corner of the first plot of the trial.
- Change the name of the annotation (Field trial start - “first plot name”) then click on Enter to validate
- Back to 2D view
Adding custom attributes to the microplot file (optional)
Please read the following article for more information: Vector Attribute Addition
Launch the analytics
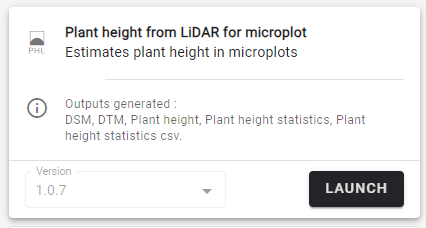
In the "Analytics" tab, search and select the “Plant height from LiDAR for microplot” in the "VEGETATION ASSESSMENT" section and click on "LAUNCH".
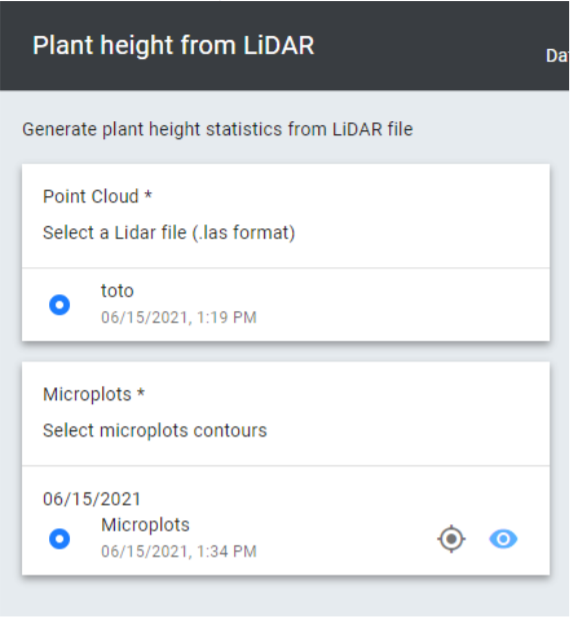
Select the Point Cloud and the Microplot vector.
On the next page, add a suffix for the deliverables (optional) and indicate the Minimum height and Maximum height to be used in the statistics computation. Then click on launch.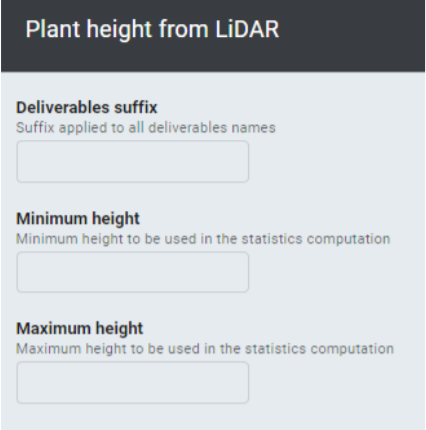 Once the task is finished, the results will be available in the 2D view and Export section
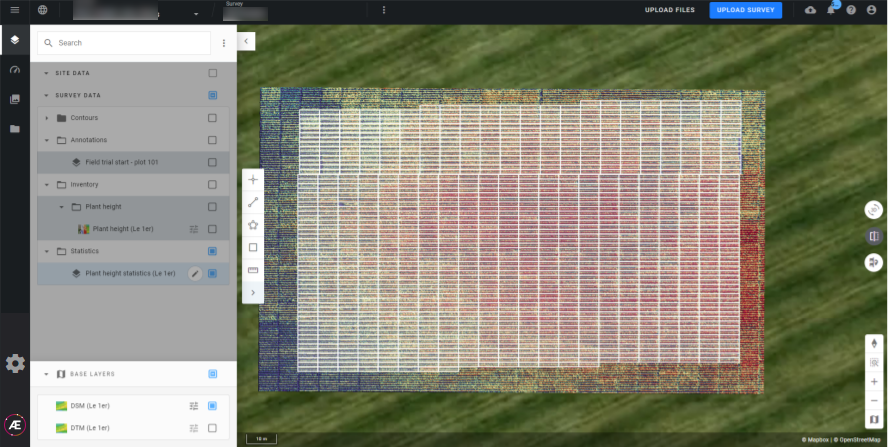
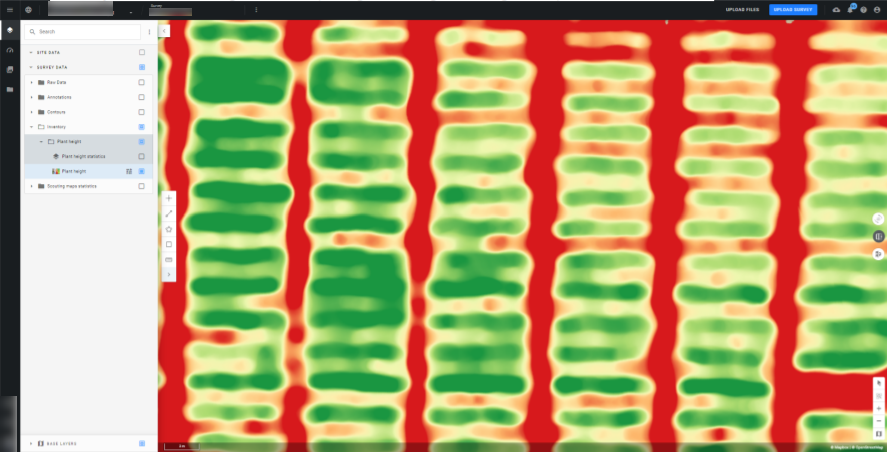
5. How to value the results
The 2 main outputs are the “Plant Height map” and “Plant Height statistics”
- If the "Plant height" layer is displayed, a map with a color scale appears: the highest vegetation is displayed in green. Low vegetation tends towards yellow or red. Clicking on “Value at point” gives the vegetation height in a specific location of the field
- If the "Plant height statistics" layer is displayed, the microplot vector appears. Clicking on a microplot gives statistics associated with this microplot.
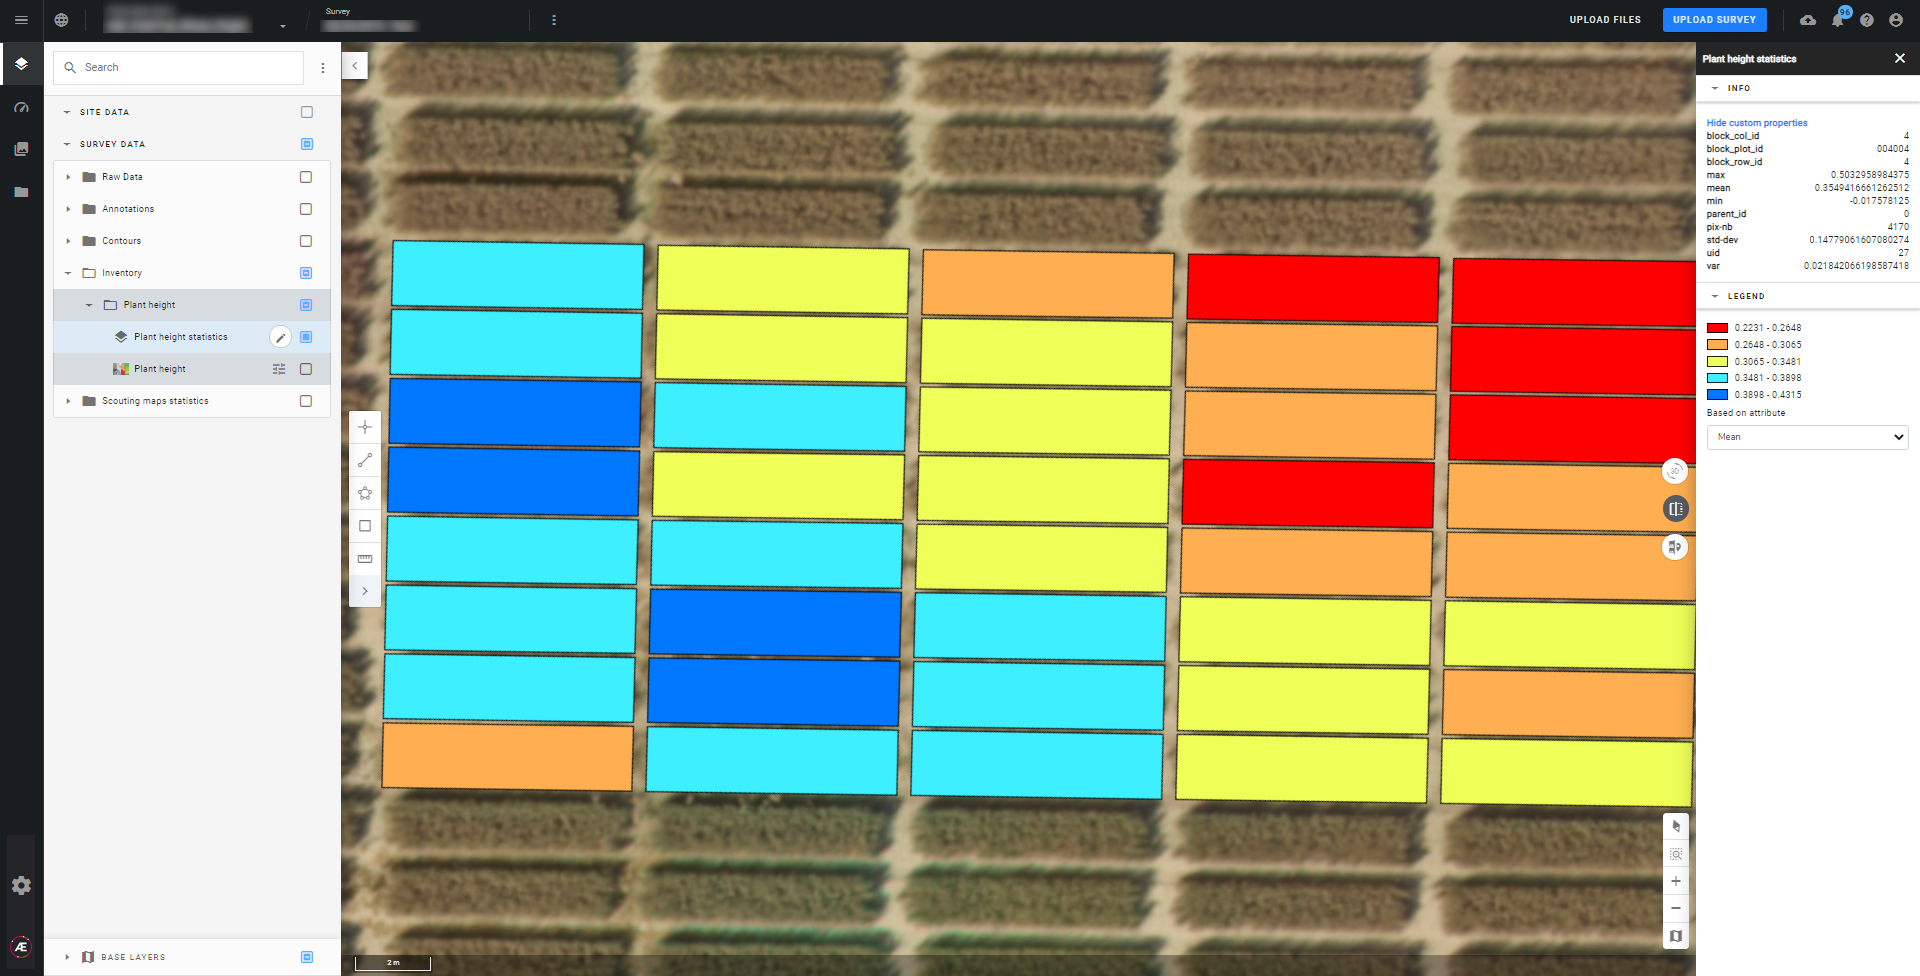
Another color scale can also be displayed such as Mean, Min, Max…
