

Spectral Index Maps
1. Description
Aether provides a wide range of basic to advanced spectral index maps for field monitoring and analysis. It is also possible to generate custom spectral index maps based on custom formulas.
This article provides details about spectral index maps and explains how to analyze the maps.
2. Generating spectral index maps?
There are different ways to generate spectral index maps:
- The Photogrammetry process: in the settings of the photogrammetry, it is possible to select basic and advanced spectral index maps that will be generated within the process (for multispectral only).
- The Spectral index map analytic allows the generation of basic and advanced spectral index maps from an orthomosaic (multispectral or RGB)
- The Custom Spectral Index Map analytic allows the generation of custom spectral index maps from an orthomosaic (multispectral or RGB) based on a specific formula.
3. Generic spectral index maps provided by Aether
3.1 Basic spectral index maps
| MAP | DESIGNATION | DESCRIPTION | FORMULA |
| RGB | Bird View | Bird View | Composition: red, green, blue |
| NDVI | Normalized Difference Vegetation Index |
Crop Vigor: Map to analyze vigor, which is a mix of biomass development and crop health. The basic tool to scout for field anomalies. NDVI gives an indication of the photosynthetic activity, and crop vigor and helps spot anomalies.
|
NDVI = (nir-red)/(nir+red) |
| NDRE | Normalized Difference Red Edge |
Chlorophyll Content: Map to analyze chlorophyll content. Correlates well with chlorophyll. The basic tool for nitrogen recommendation is based on chlorophyll analysis. NDRE is used to assess field chlorophyll content, and thus nitrogen content or stress detection (at the earliest stage possible, before NDVI).
|
NDRE = (nir-red_edge)/(nir+red_edge) |
| VARI | Visible Atmospherically Resistant Index | Greenness: Map to discriminate green plants from the remaining, soil as an example. | VARI = (green-red)/(green+red-blue) |
| MCARI2 | Modified Chlorophyll Absorption Index Ratio 2 | Green Biomass: Map that is a good predictor of green leaf area index to analyze biomass development. | MCARI2 = 1.5*(((2.5*(nir-red))-1.3*(nir-green))/sqrt(((2*nir+1)^2)-(6*nir-5*sqrt(red))-0.5)) |
| PRI | Photochemical Reflectance Index | The map that values spectral bands where photosynthetic pigments might be affected by water stress conditions such as chlorophyll and carotenoids. | PRI = (green_b531-green) / (green_b531+green) |
3.2 Advanced spectral index maps
MAP |
DESIGNATION | DESCRIPTION | FORMULA |
| MSAVI2 | Modified Soil-Adjusted Vegetation Index 2 | Soil-Ajusted Crop Vigor: Map to analyze crop vigor, that is mix of biomass development and crop health to scout for field anomalies. The main difference with NDVI is that it removes partly the effect of soils. Thus, this index is more suitable to use at an early stage of crop development or where the canopy is not closed. Combination of red and NIR infrared. |
MSAVI2 = (2*nir+1-sqrt(((2*nir+1)^2)-8*(nir-red)))/2 |
| CIR | Colored Infra-Red | The false color photograph highlights vegetation. | Composition: nir, red, green |
| CCCI | Canopy Chlorophyll Content Index | The map that is correlated to N Status / Chlorophyll concentration and can be valued to benchmark chlorophyll status or feed nitrogen variable rate maps. | CCCI = (nir+red)*(nir-red_edge)/((nir-red)*(nir+red_edge)) |
4. Exploring and analyzing maps
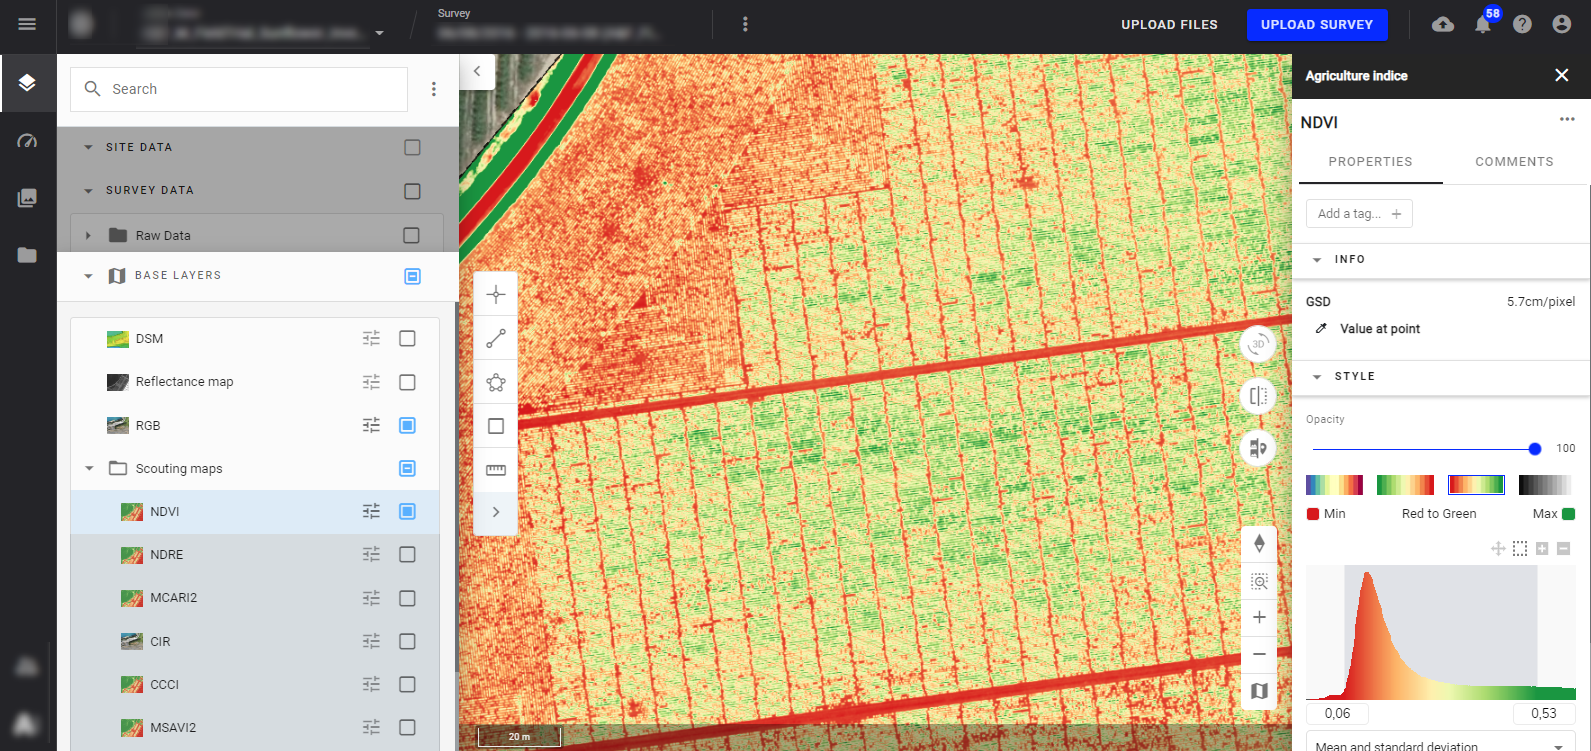
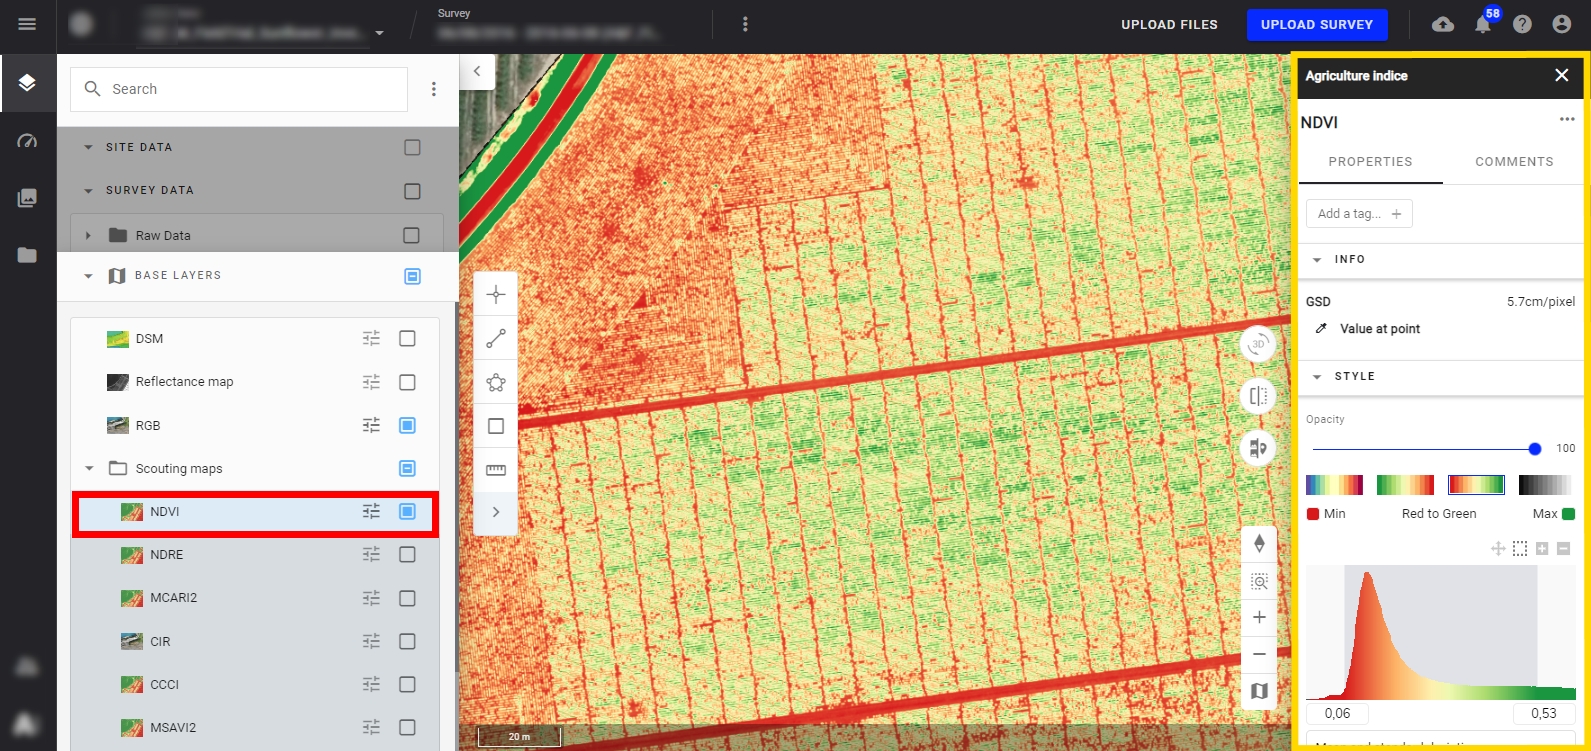
Open your project and survey, and from the left panel, go to the "BASE LAYERS" section. Rearrange this layer organization if needed (read Browsing and Arranging Layers).
Click on the layer name, an information panel appears on the right side with different tools to analyze the map.
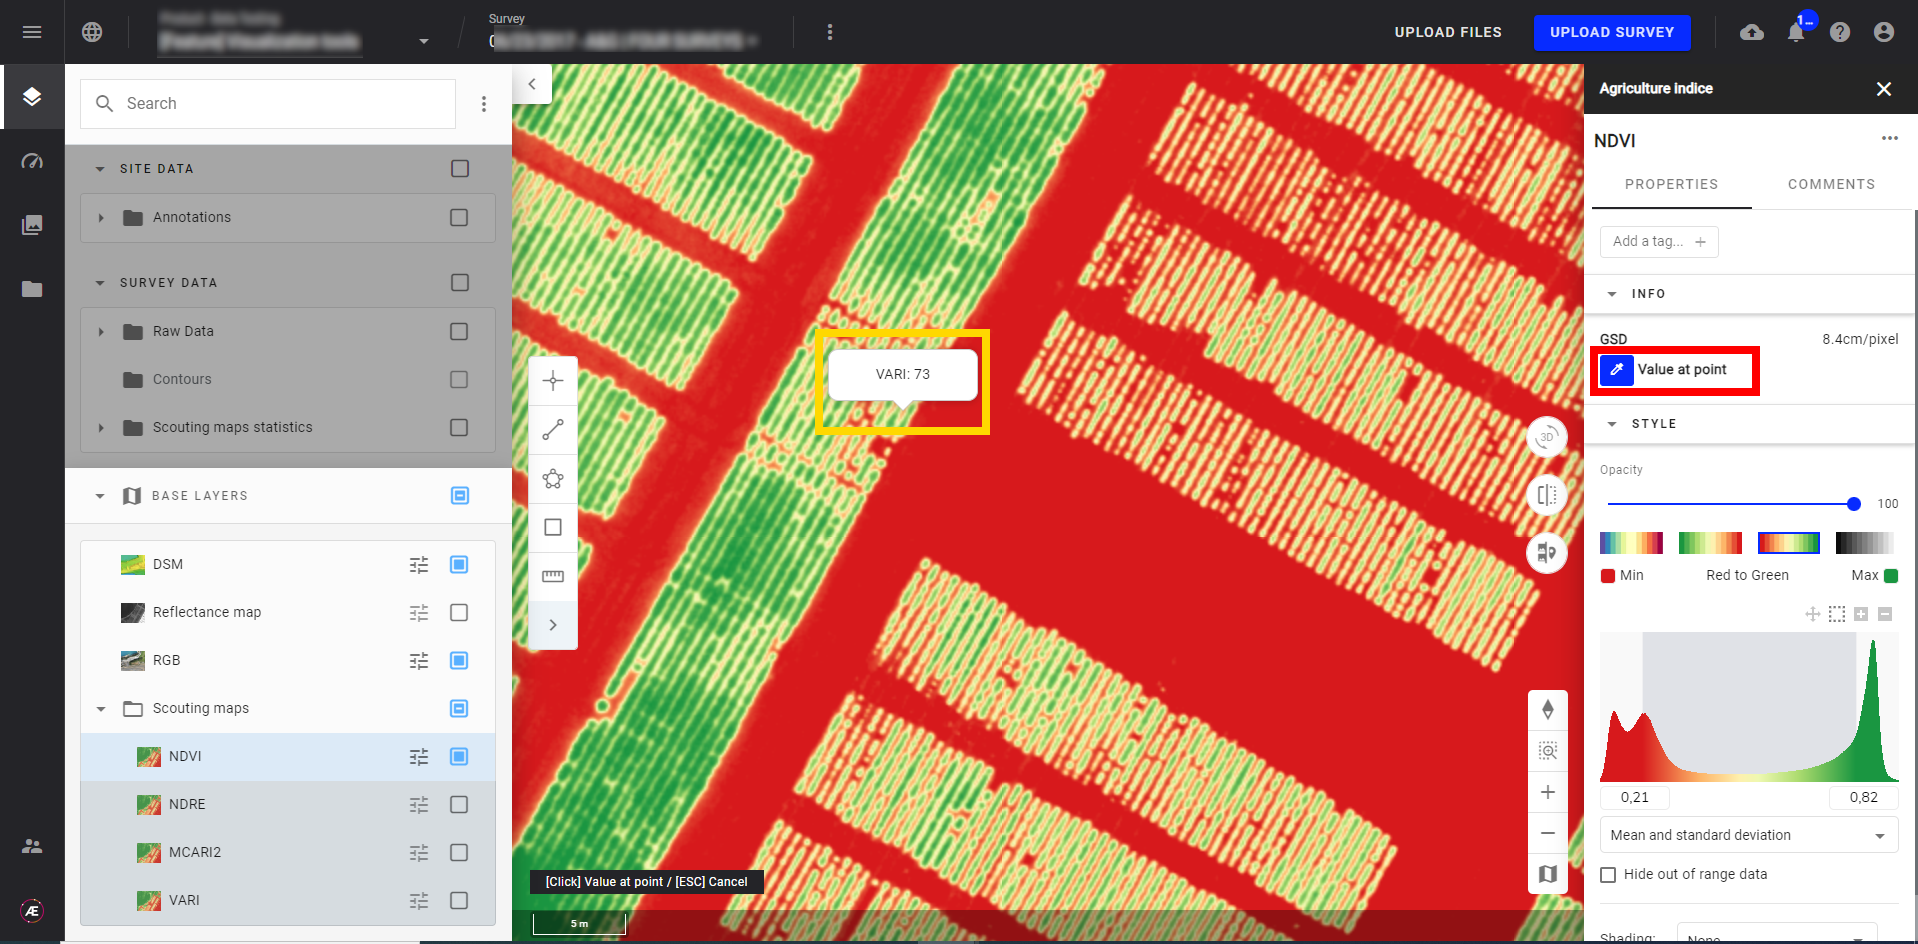
4.1 Value at point
This tool allows checking spectral index map value at any point of the map.
- Click on "Value at point" and click on the map view
- Press "ESC" to cancel.
4.2 Changing opacity and style
The opacity and color gradient of the map can be customized.
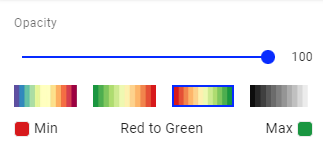
The color chart options are the following:
- Spectral
- Green-Yellow-Red (i.e. lower values are in green)
- Red-Yellow-Green
- Grayscale
4.3 Spectral index map pixel distribution and display
Visualize the distribution of the pixel values (ex NDVI value) in the graph below and interact with this graph to adjust the display on the map.
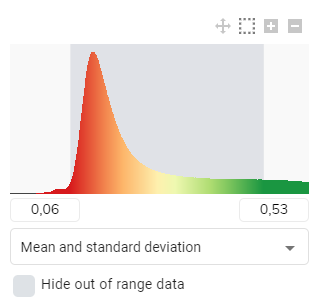
The spectral index map display can be customized with the options described in the table below. Values out of the selected range will be displayed with the edge color (for example red and green if the scale "Red-Yellow-Green" is selected).
| Mean and standard deviation (by default) | The color scale is centered on the mean and 1 standard deviation is discarded at each extremity |
| Absolute | All pixels are included in the color scale. |
| Cumulative % cut | Lower and upper values are discarded. You can set the % of value to discard (default is +/- 3%). |
| Custom | Select the range of values on which you want to display the color scale
|
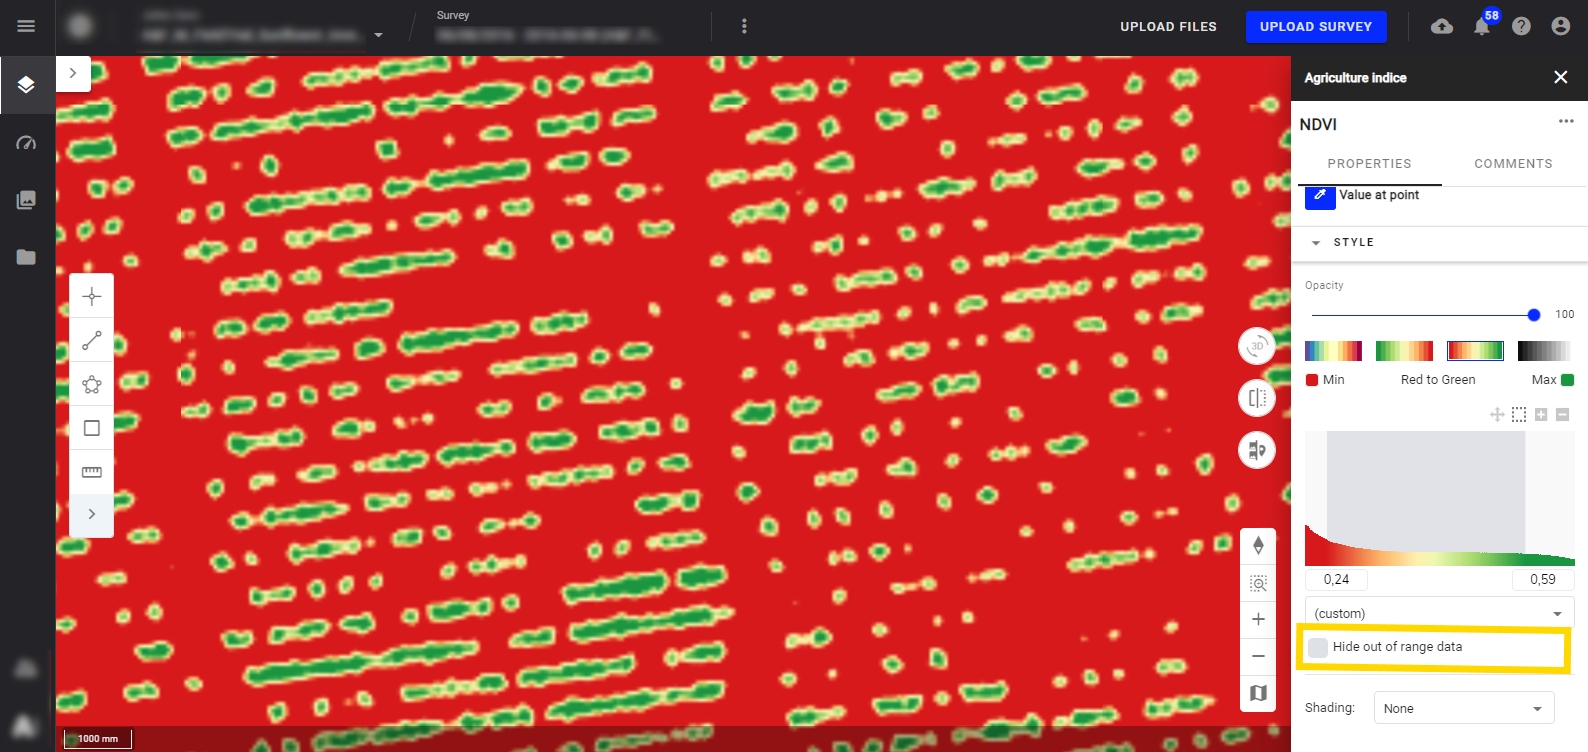
4.4 Hide out-of-range data
- The button "Hide out of range data" is empty, pixels outside the range will be displayed with the edge color of the graph.
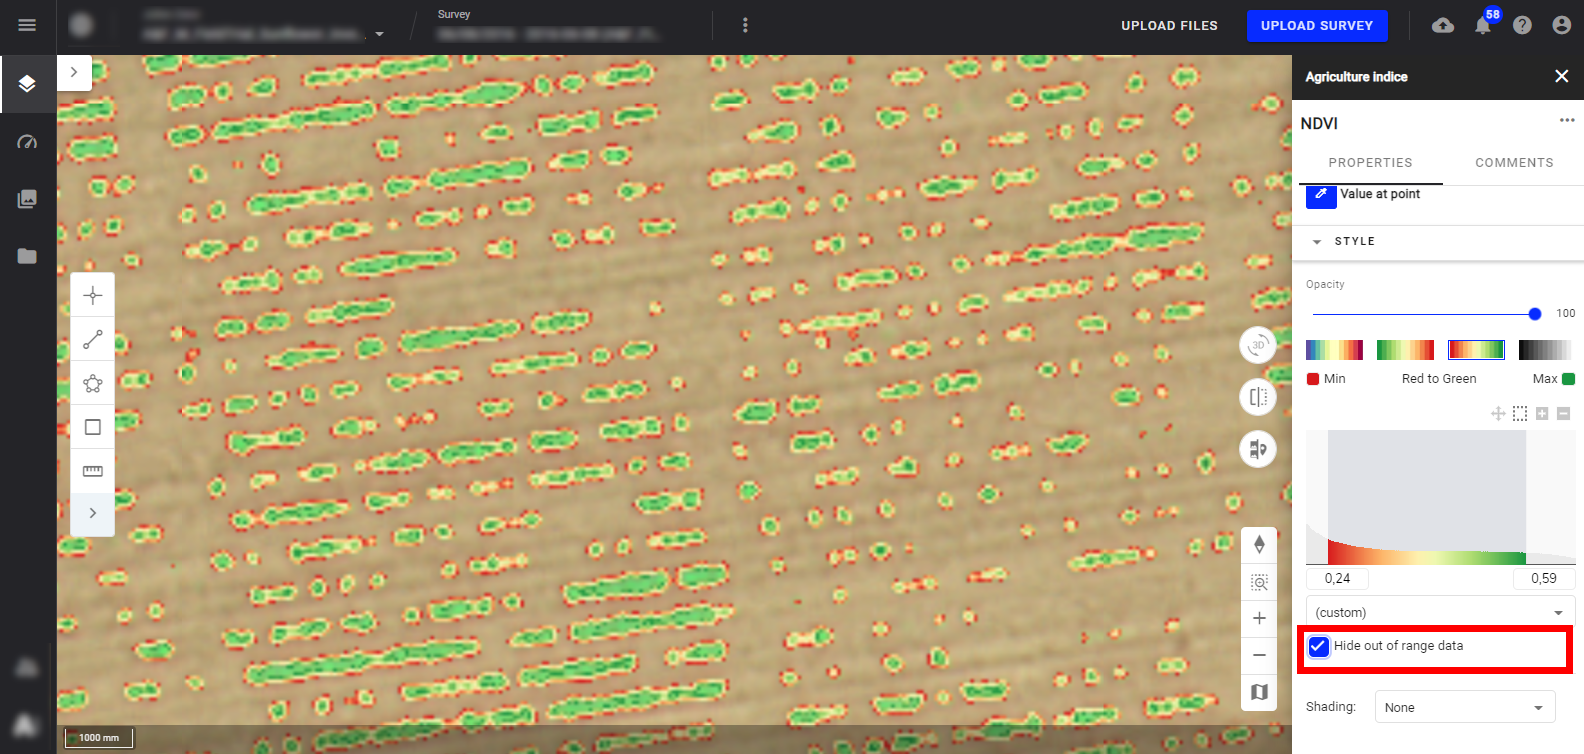
- Tick the button "Hide out of range data", the pixels outside the range won't be displayed on the map and the other maps selected in the background will be visible.
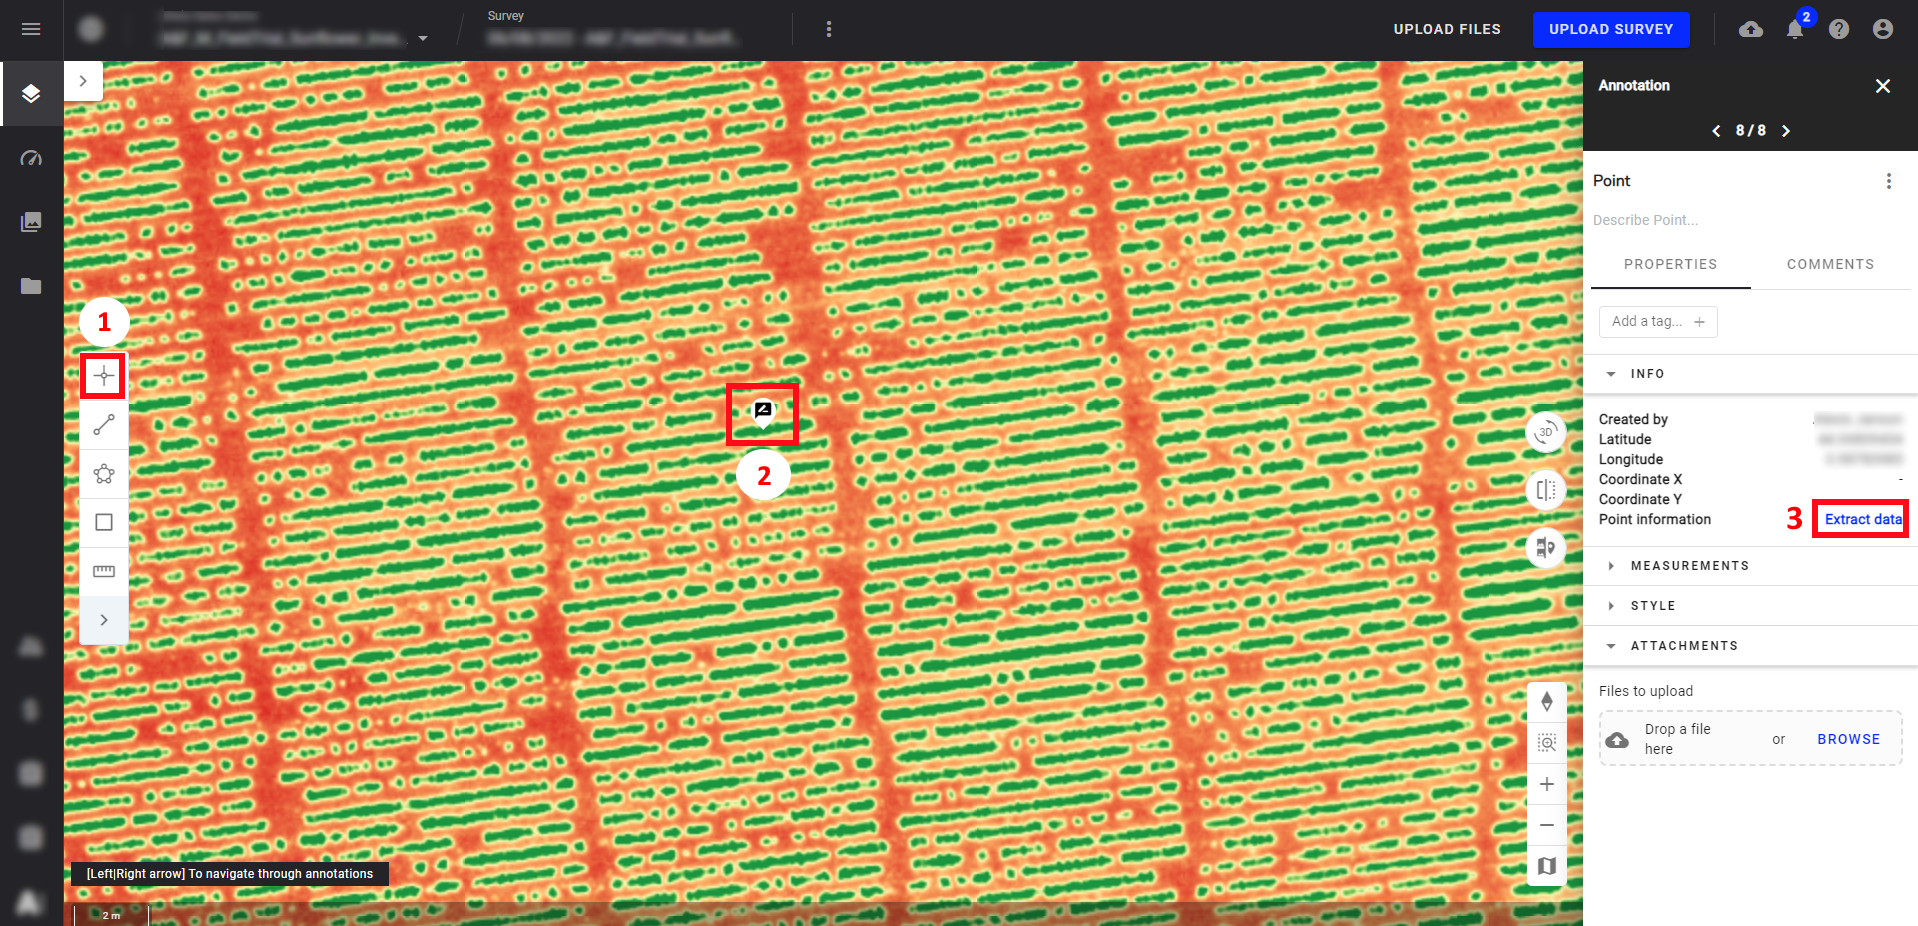
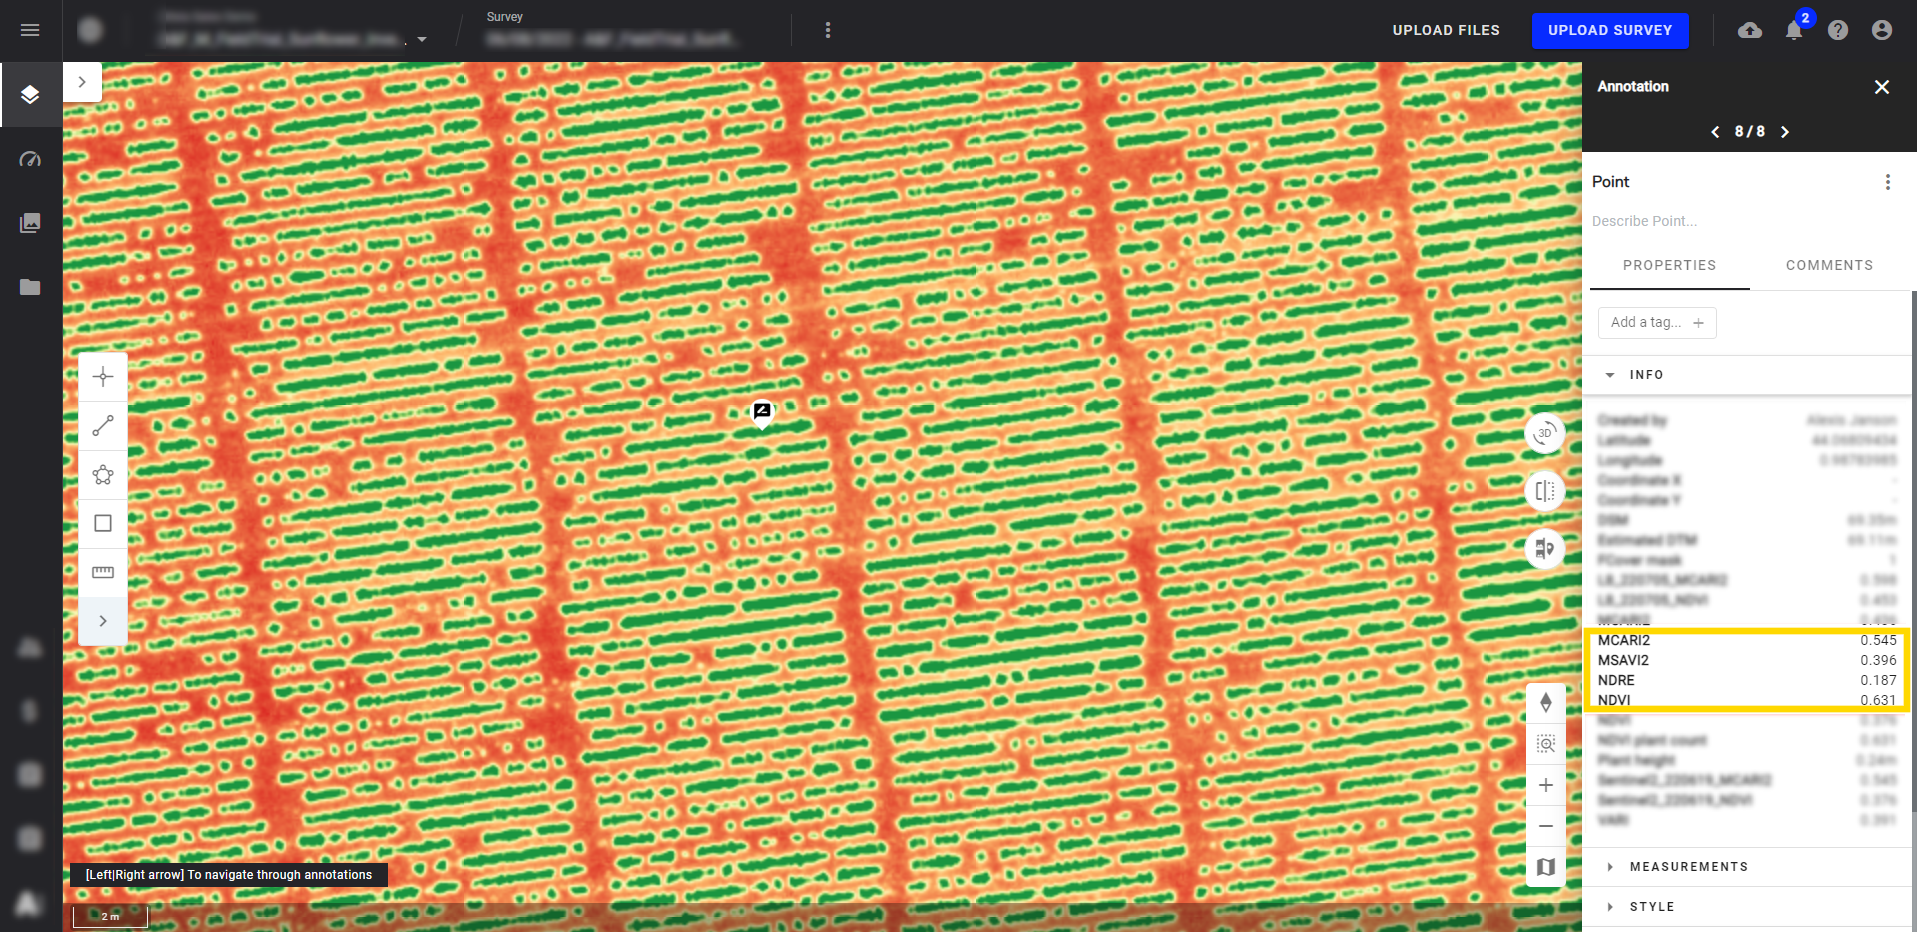
4.5 Data Extraction from a point annotation
Draw a point annotation (1) & (2) and press "Extract data" (3) from the information panel. All available indices values at the point will be displayed.
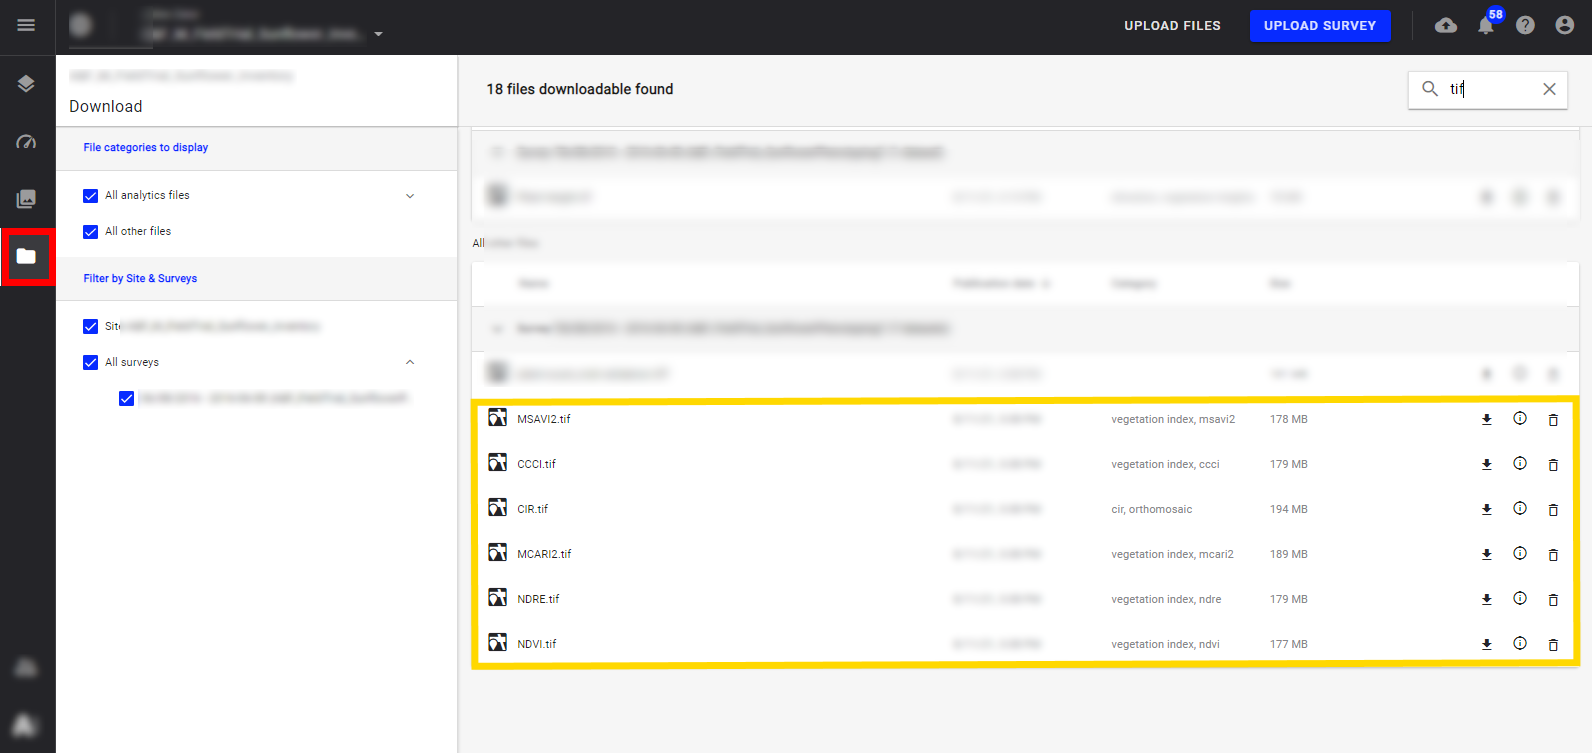
5. Exporting spectral index maps & statistics
All generated Maps can be exported from the Downloads section. Maps are available in tif format.
Learn more:
- Field Boundaries Creation
- Microplot Digitization
- Statistics (including for spectral index maps)
