Row Vectorization
These analytics automatically identify rows within fields in order to assist with field counting or help guide farming equipment. they detect, digitize, and measure rows.
1. Inputs
These analytics are available for crops planted in rows and where bare soil is visible in between the rows.
Row vectorization for microplot:
- Microplots *
- Basic scouting map (NDVI selected by default)*
- Deliverables suffix
Row vectorization for field:
- Field Boundaries* (learn more: Field Boundaries Creation)
- Basic scouting map (NDVI selected by default)*
- Row spacing*
- Deliverables suffix
*Mandatory
2. Deliverables
Row vectorization for microplot:
- Rows + suffix.geojson
Row vectorization for field:
- Rows + suffix.geojson
3. Attributes
Rows digitization with the following attributes:
Row vectorization for trial field and production field:
- parent_id: unique id of a group of microplots.
- block_plot_id: 6 figure number composed by block_row_id and block_col_id
- row_id: id of the row
- row_length: Length of the row in meter
- row_anomaly: text that indicates an anomaly during the vectorization
4. Workflow
Step 1: Select the vegetation indice that will be used to process the row vectorization (by default: NDVI is selected).
Step 2 - Select the vector file* that will be used as a basis for row vectorization.
Step 3 - Select the row spacing number. This value has to be consistent in all the fields.
Step 4 - Launch row vectorization.
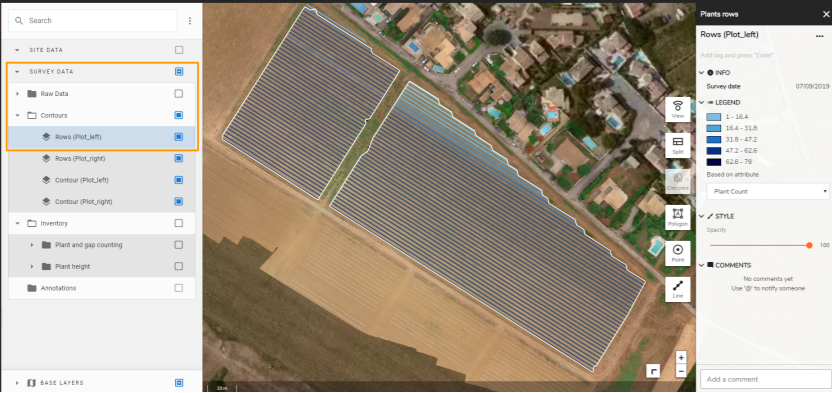
5. Display
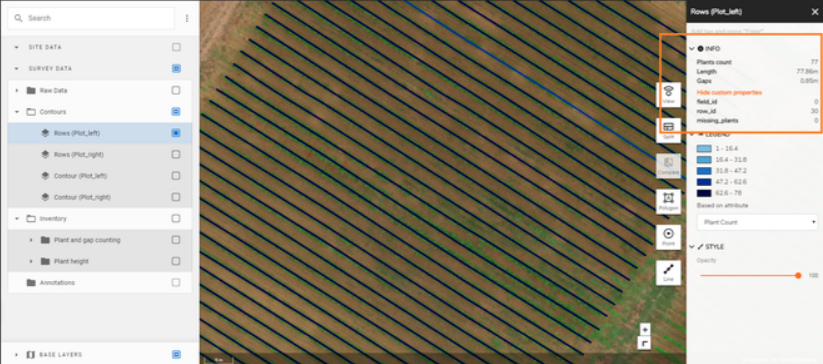
Open Contours in the "SURVEY DATA" section on the left panel and then display the rows. Click any row on the map to open its information panel on the right side. Clicking the custom properties will also show the row length, field id, row id...
This info can be downloaded in multiple formats.
Learn more: Download and Export Data.