

SDK Use Case Example
There are many possibilities for what can be done with Alteia's SDK. In this article, we cover just one example, showing how a developer can apply custom analytics over the digital twin of an existing asset, reconstructed in Aether. Thus, using the available tools, you can integrate industrial machine data with site geospatial data to create a complete picture of the asset.
Addressing the issue
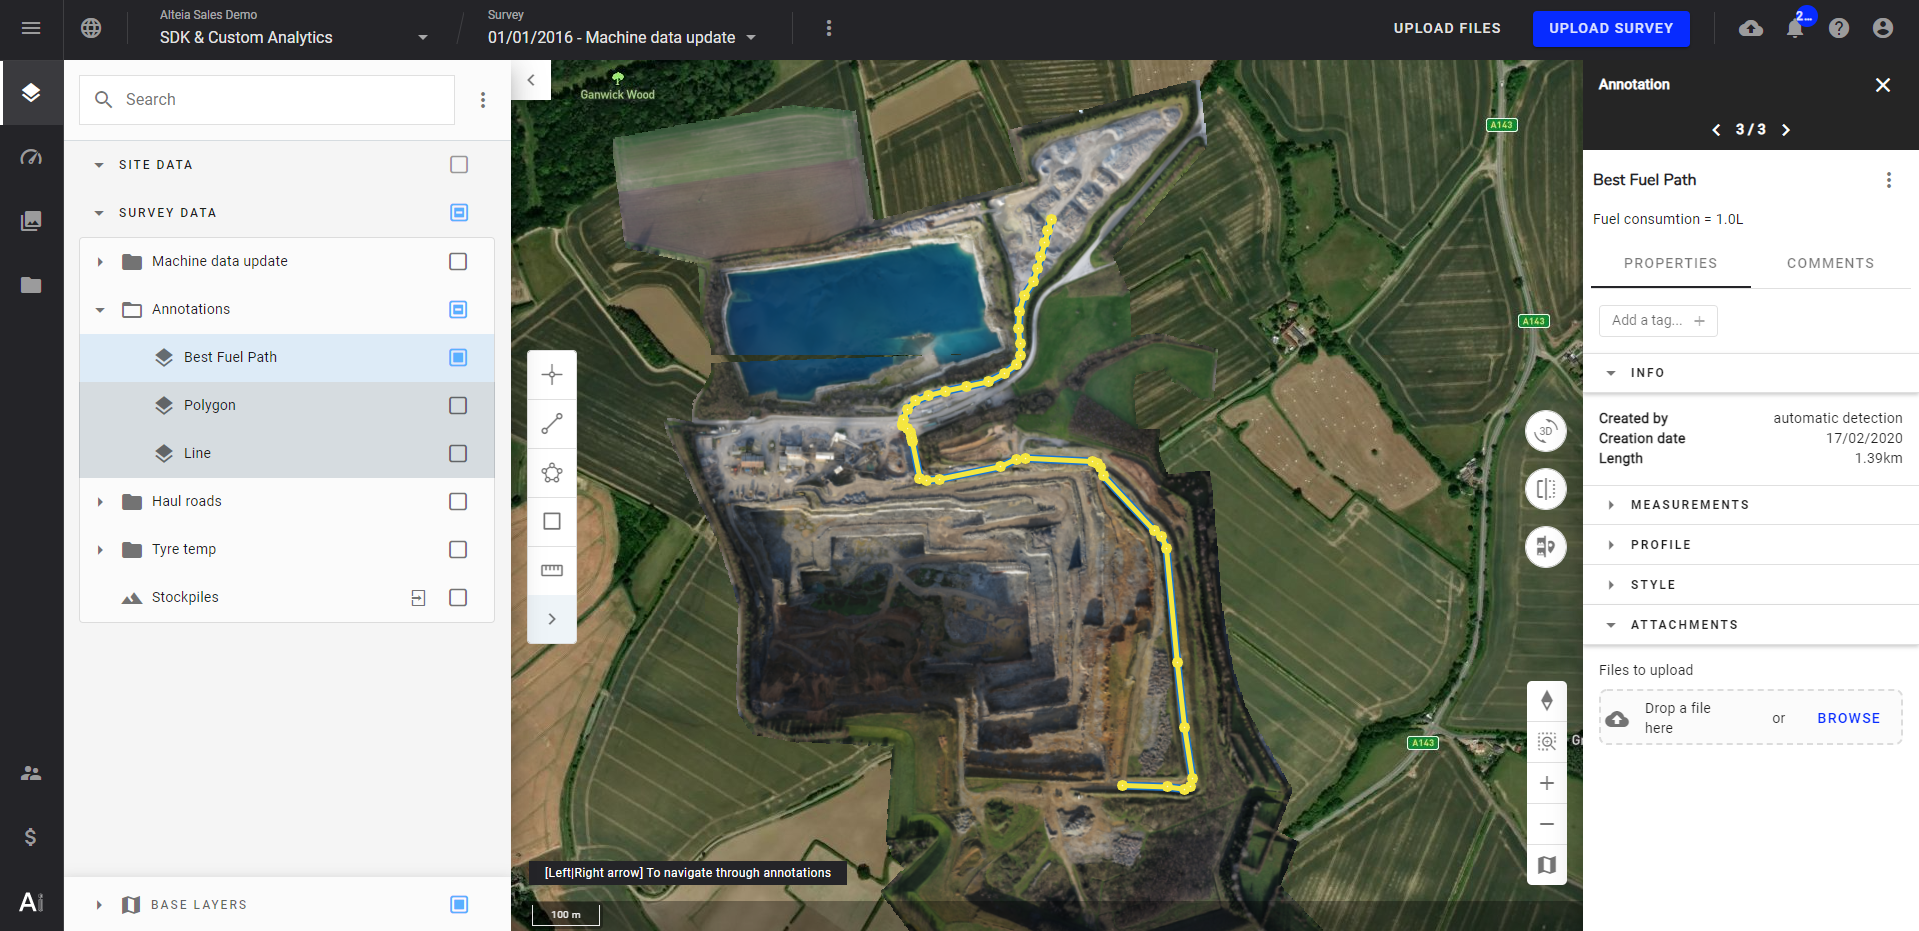
In this instance, a quarry manager wants to use the most efficient routes on his site to move material from point A to point B, from the loading area in the pit to the crusher.
We consider this a question of optimization and address it using modelization.
To do this, you create a layer in Aether that shows the 3D geospatial data of the quarry along with a model of the fuel consumption of the haul trucks. Let's look at the steps involved.
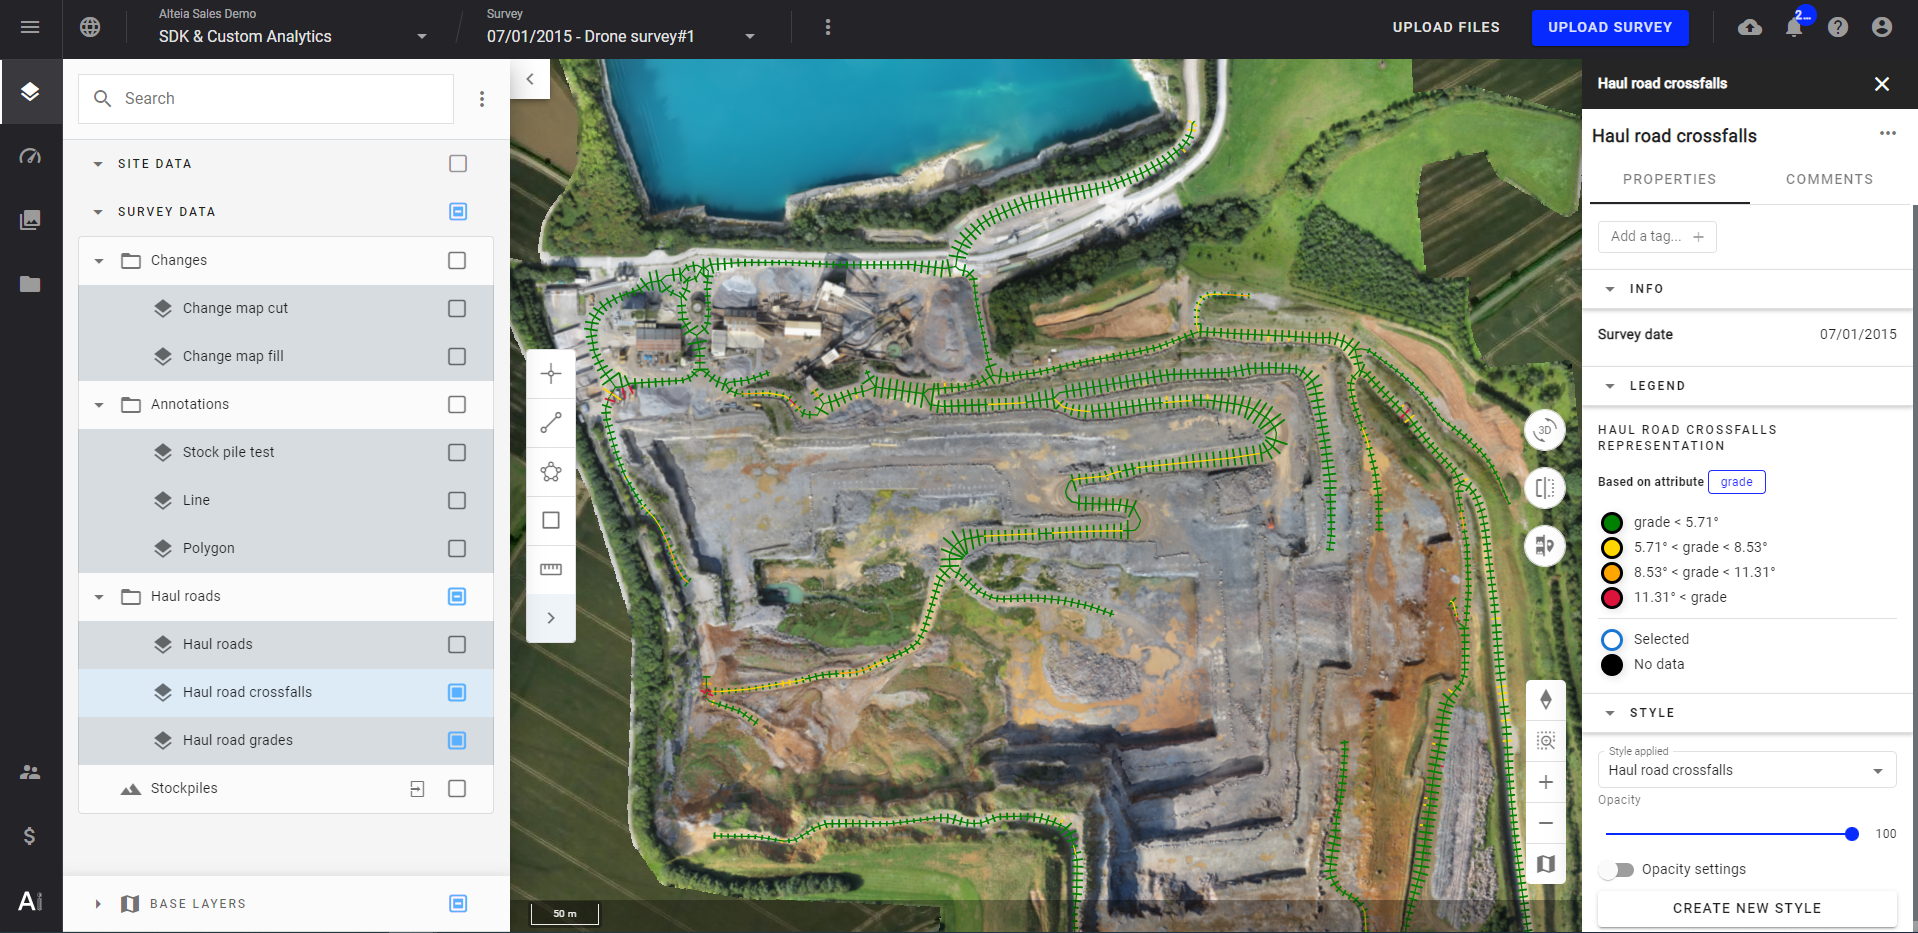
Generate the haul roads
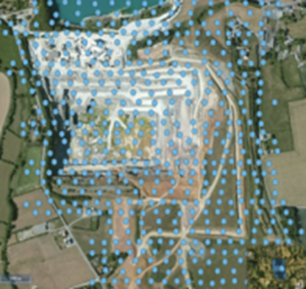
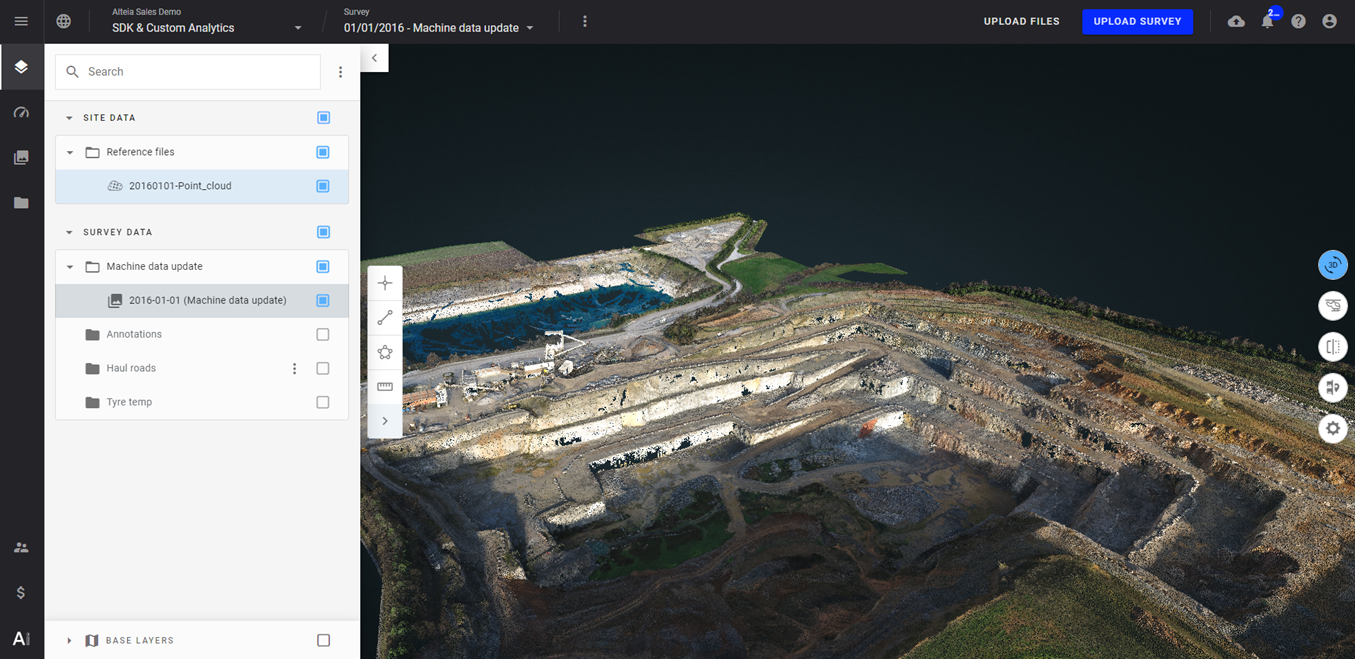
The first step is to generate the quarry haul roads in Aether. Drones capture raw images, which are then processed in 2D or 3D, either within Aether or externally. Once uploaded and processed, Aether will detect and extract the haul roads from the images.
Define fuel consumption
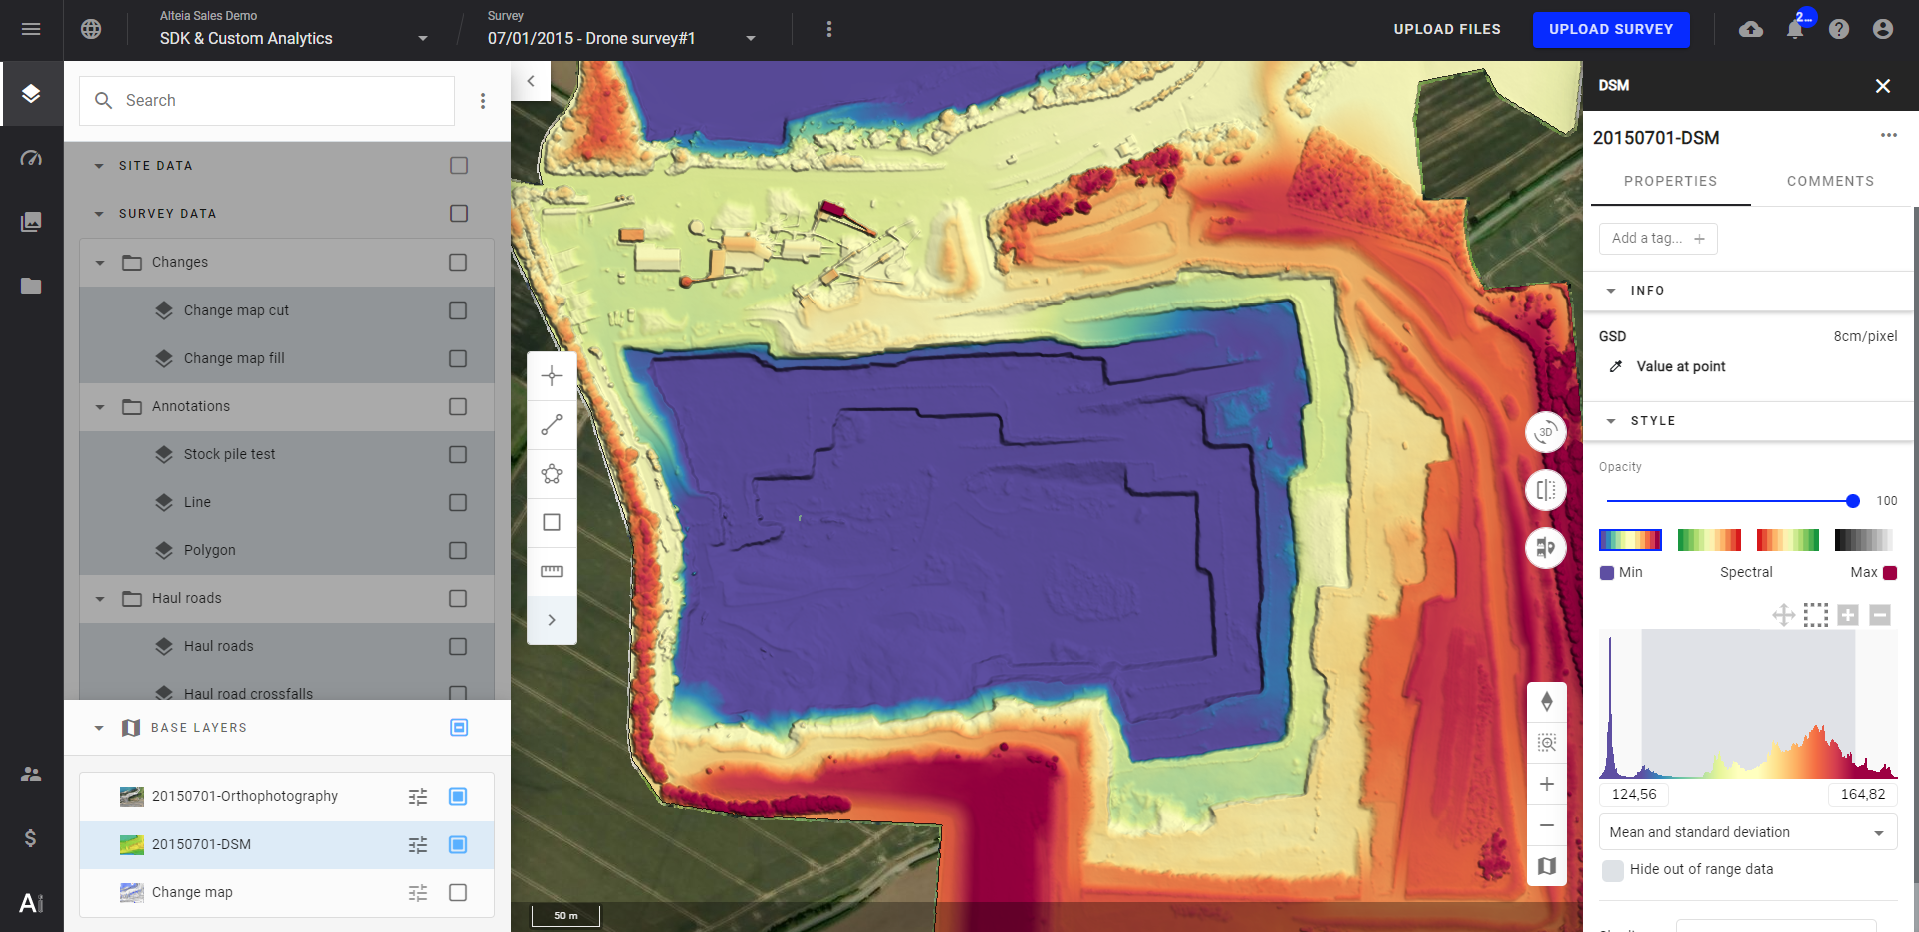
Next, you need to define the fuel consumption between any two points. Two pieces of data help us create a complete picture. Vehicle-related data, such as rolling resistance and load weight, and drone-related data, such as lengths and elevation differences computed from the 3D models within Aether.
def fuel_consumption(load, length, delta_z):
return max(C_h*(1-RR)*(20000+load)/20000*length + C_v*(20000+load)
/20000*delta_z,0)
Utilizing the Alteia SDK
Finally, using the Alteia SDK and a short Python script allows you to bring all the data together.
- defines the KPI to be generated (fuel consumption)
- calls the haul roads pattern as an input
- calls the SDK functions
- generates a visual map (.tiff)
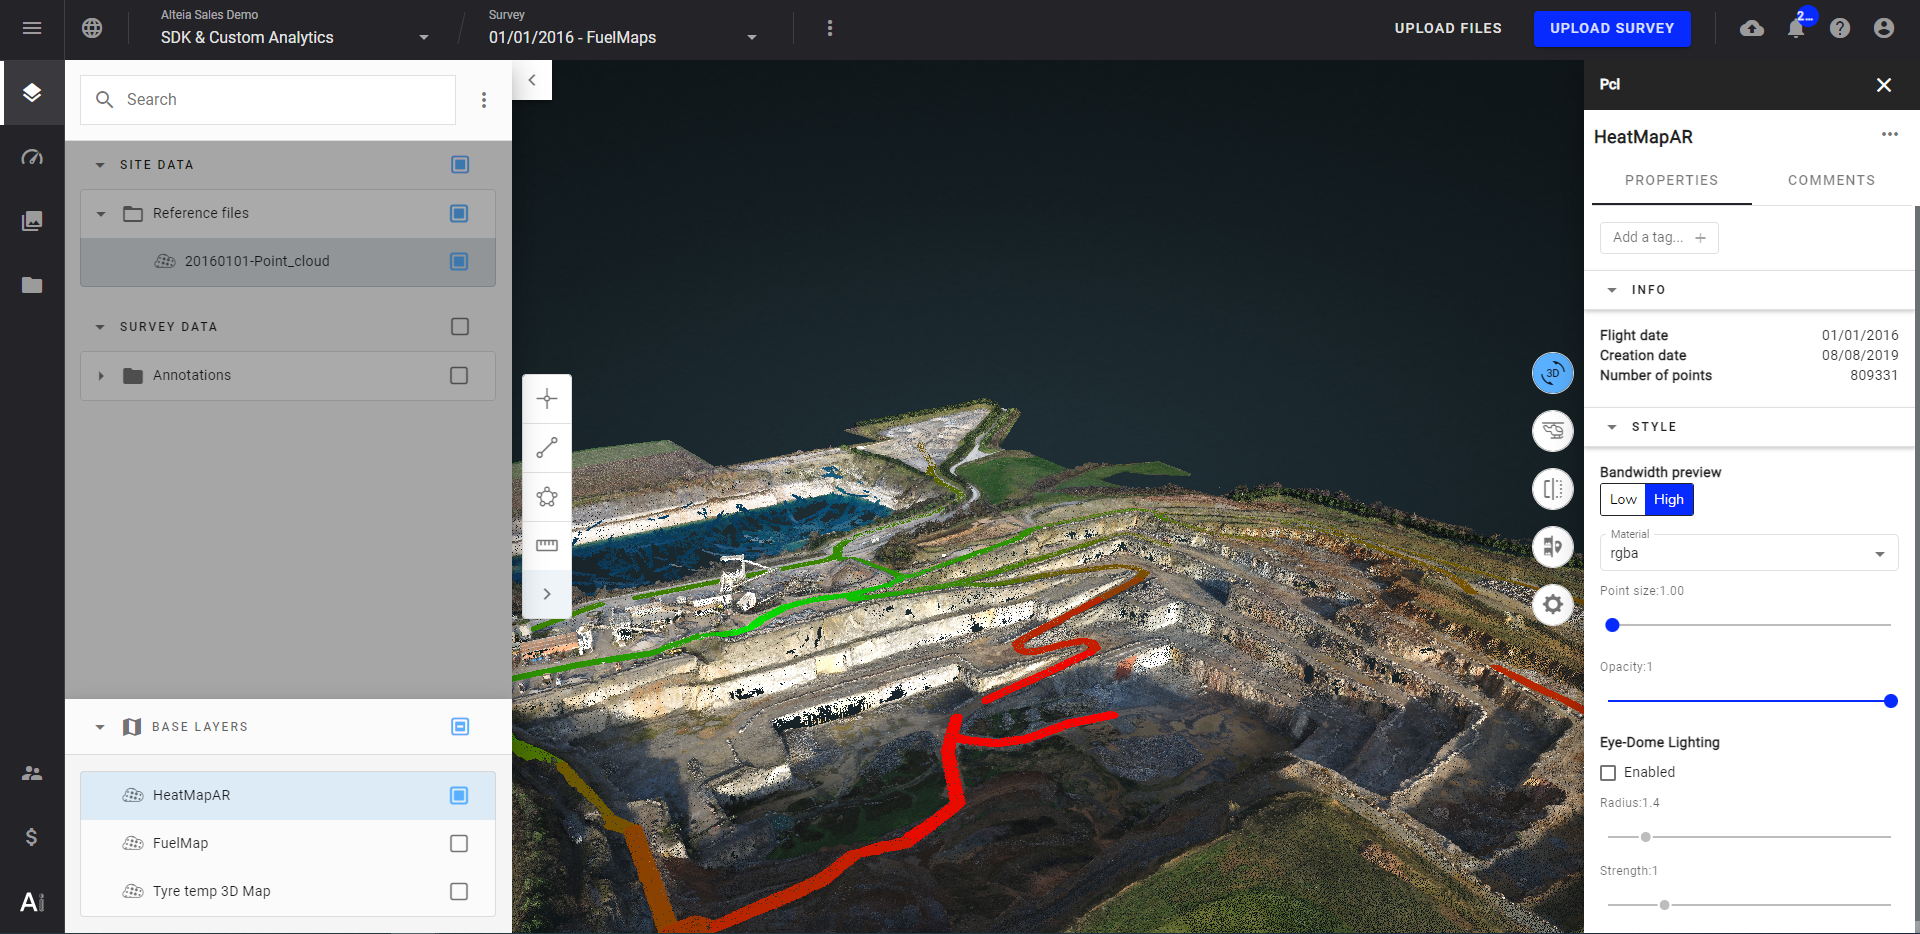
In conclusion, it was possible to simulate the fuel cost associated to a certain positioning of the crusher versus the loading area.
