

Thermal Mapping
1. Description
This process creates a thermal map from thermal LWIR or MWIR pictures using photogrammetry. Generated thermal layer can be browsed for temperature readings in inspection cases, or serve as an input for analytics like Automated Solar Plant Thermal Inspection. Time-series survey comparison is available for thermal maps using Compare View.
2. Thermal Map Display
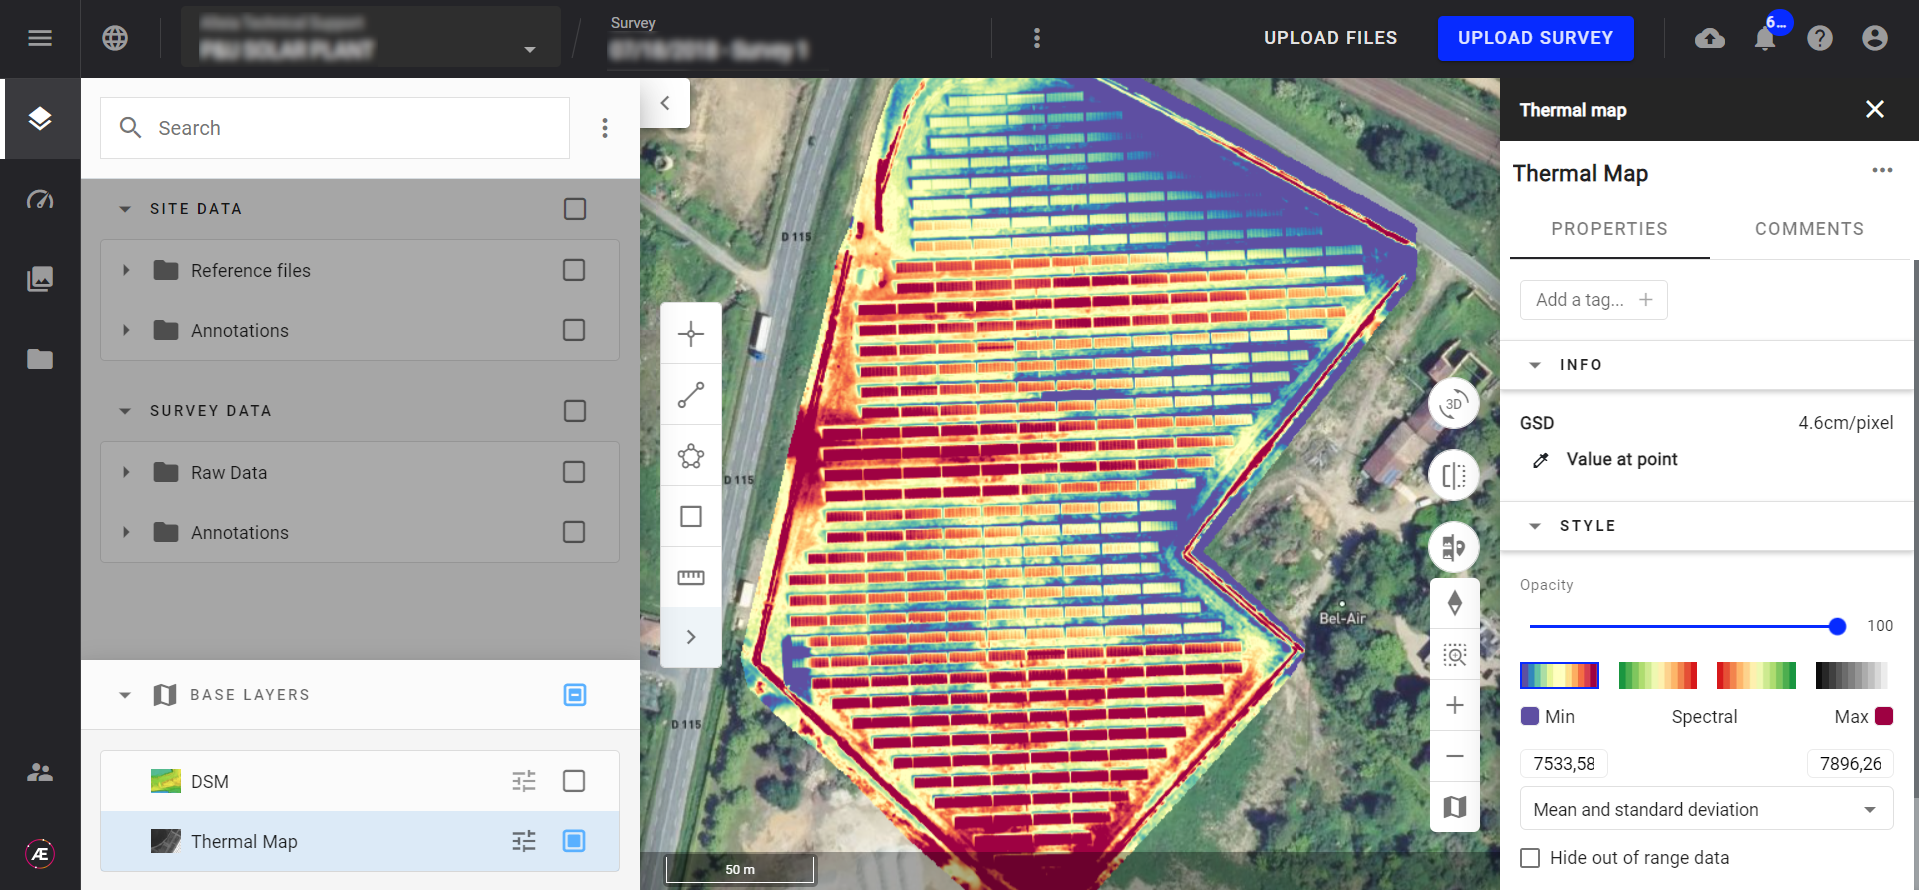
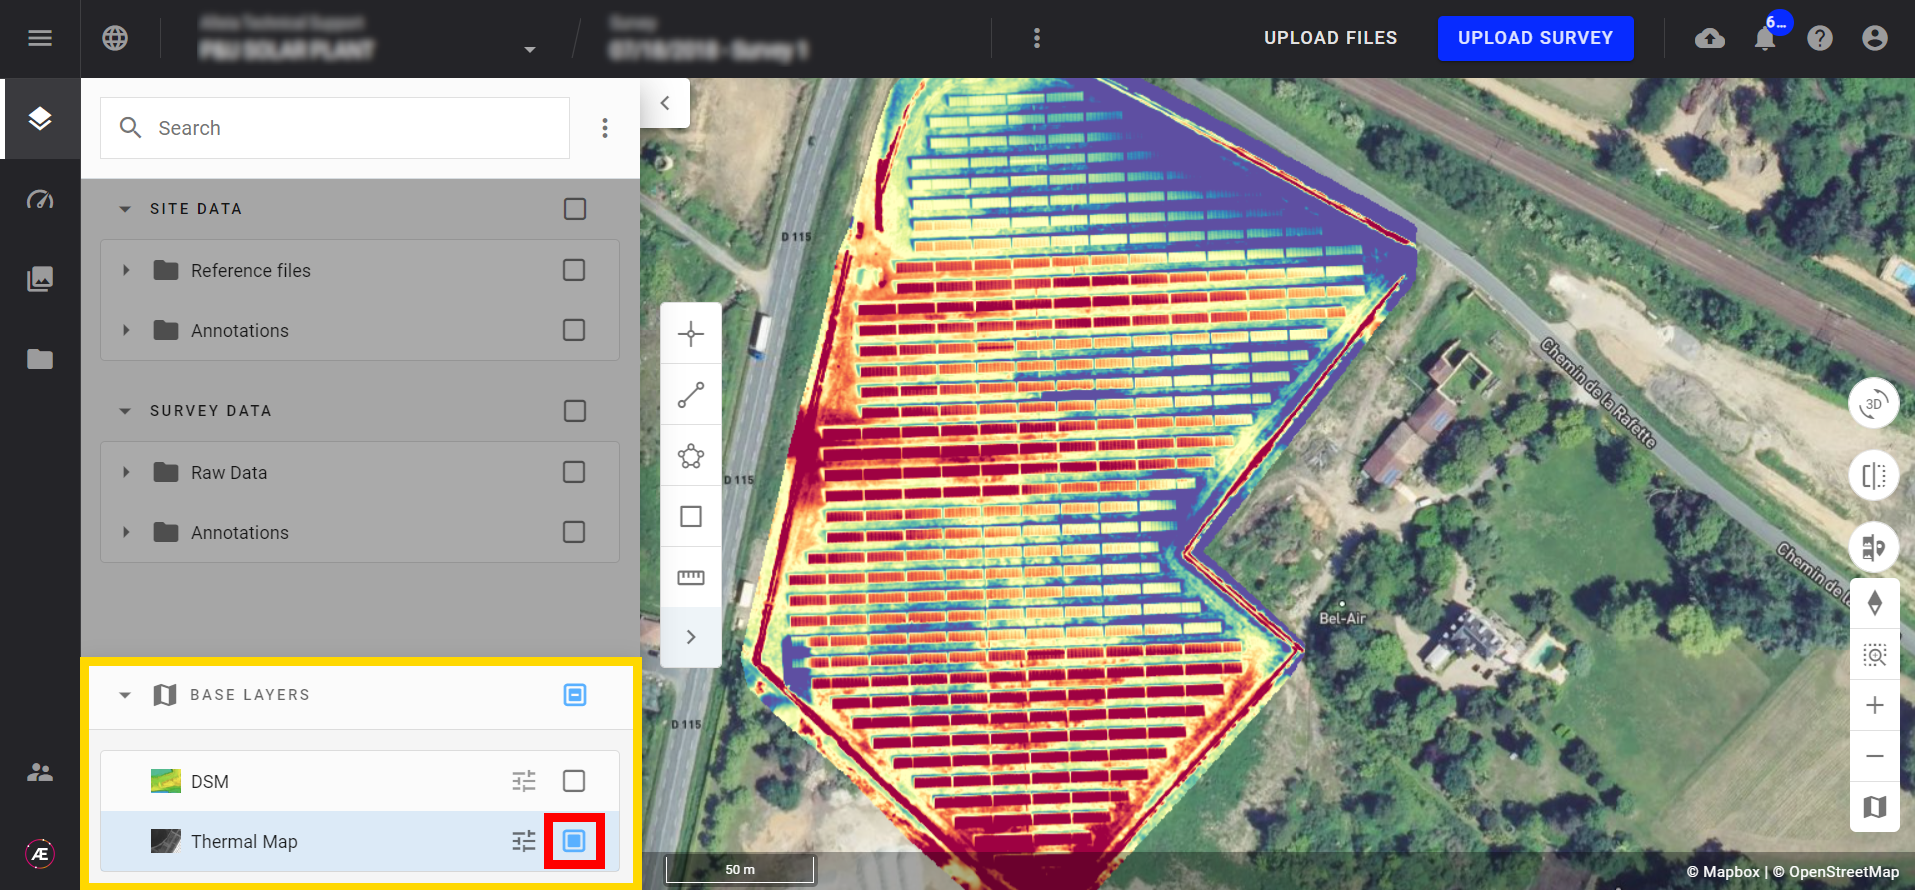
A thermal map is a 2D layer on Aether, it can be displayed or hidden from the Base Layers section in the layers panel.
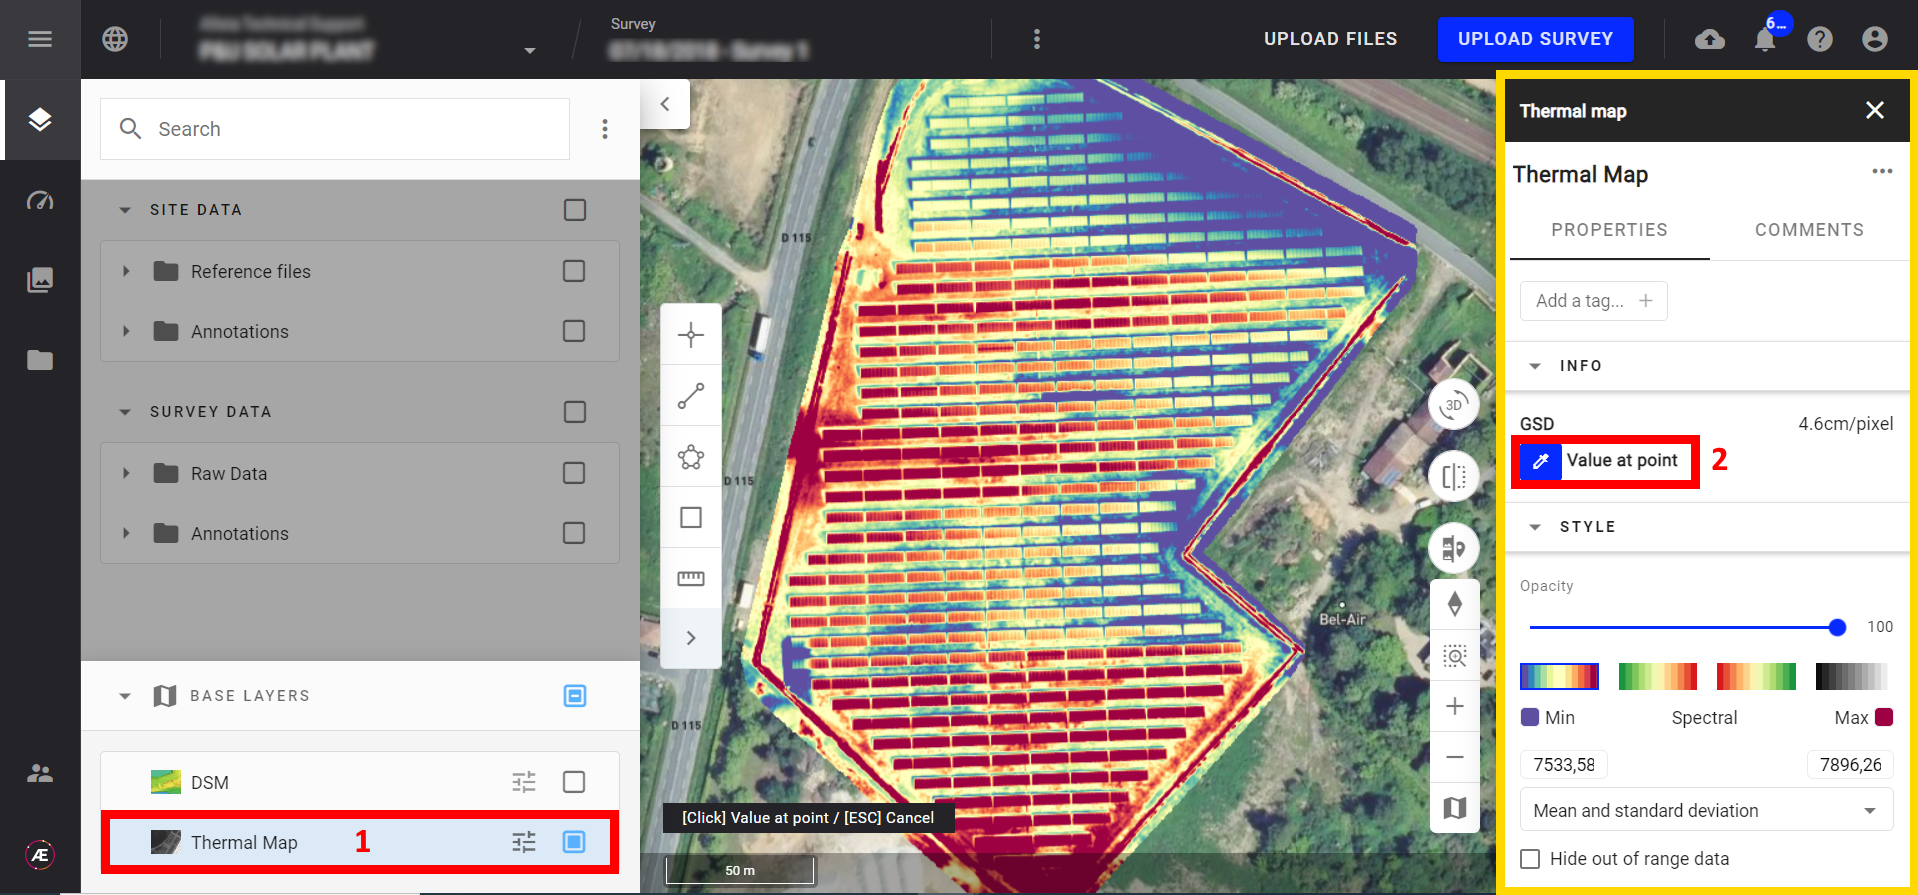
3. Temperature Reading
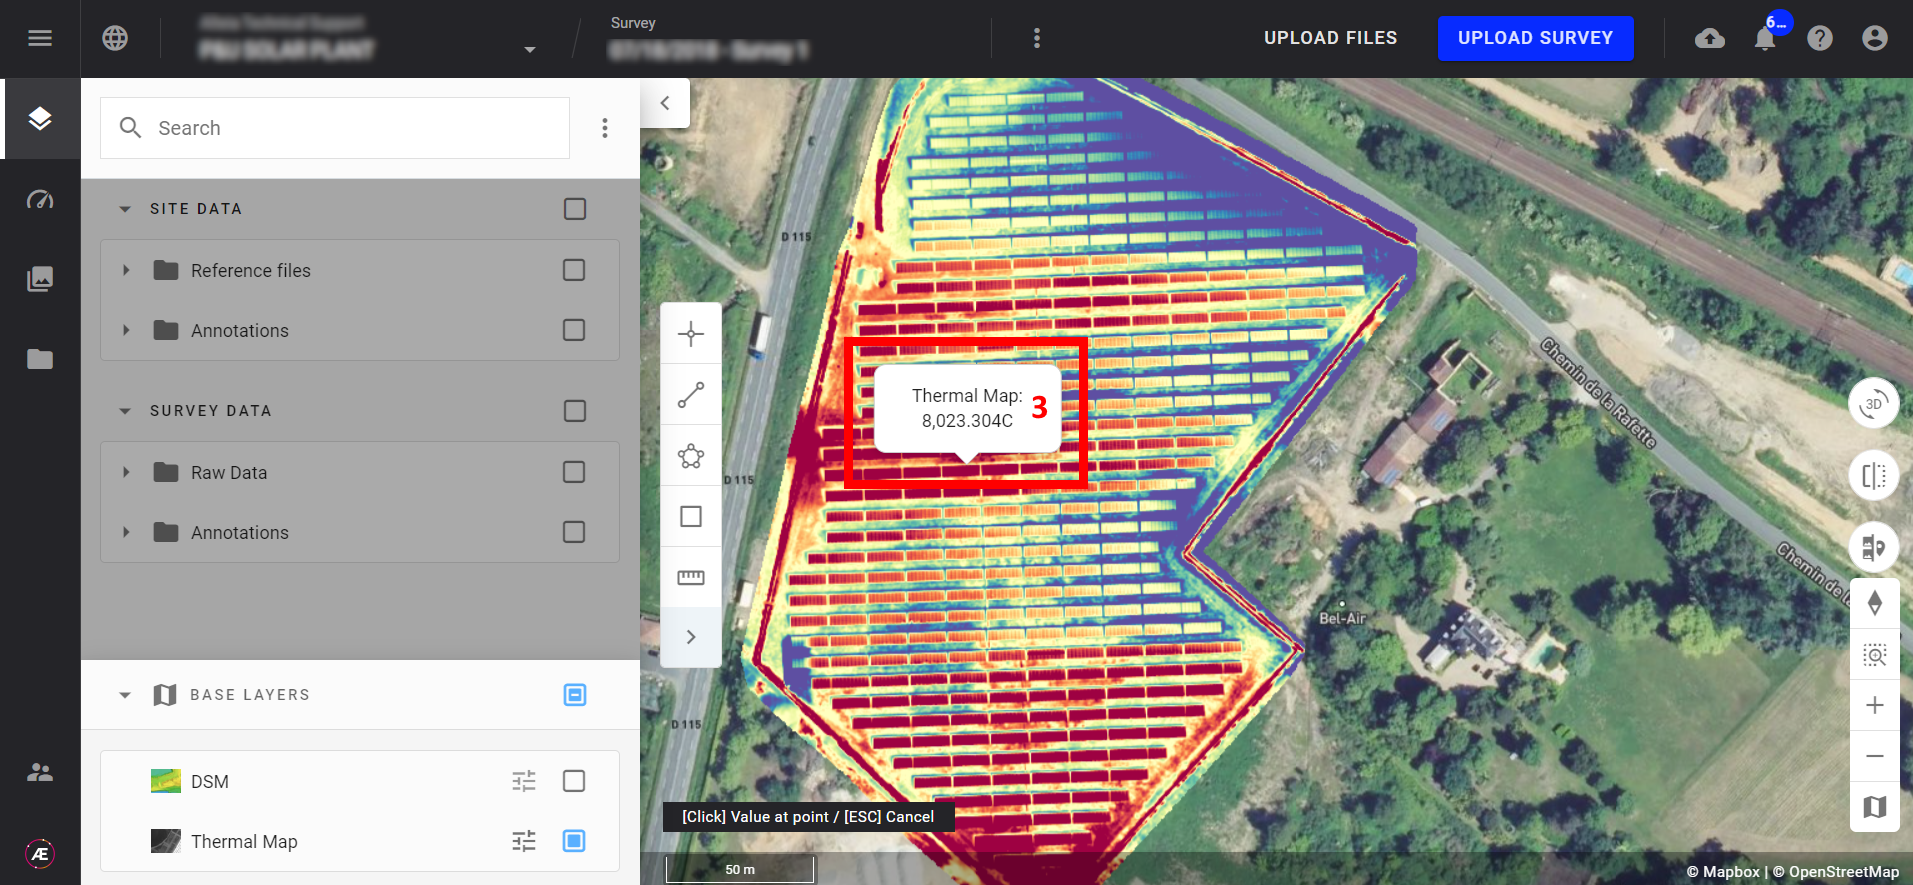
To read the temperature information recorded at any point of the map, click on the Thermal Map layer (1) to open its information panel, select "Value At Point tool" (2), hover over the map, and click at the desired location to display the temperature reading (3).
4. Supported Sensors
The supported thermal sensors list can be found here.
5. Hot Spot Detection
Read here a use case based on a thermal map input to deliver a solar plant inspection.
