Elevation Change Map
1. Description
Using the "Elevation change map" tool is a convenient way to compare and analyze two different time-series DSMs from successive aerial surveys over the same location. It's a great tool for monitoring changes to volume measurements, especially for quarries, open-pit mines, and extracted materials. Moreover, it is used for construction progress monitoring and landfill sites to measure the volume of waste added to a cell.
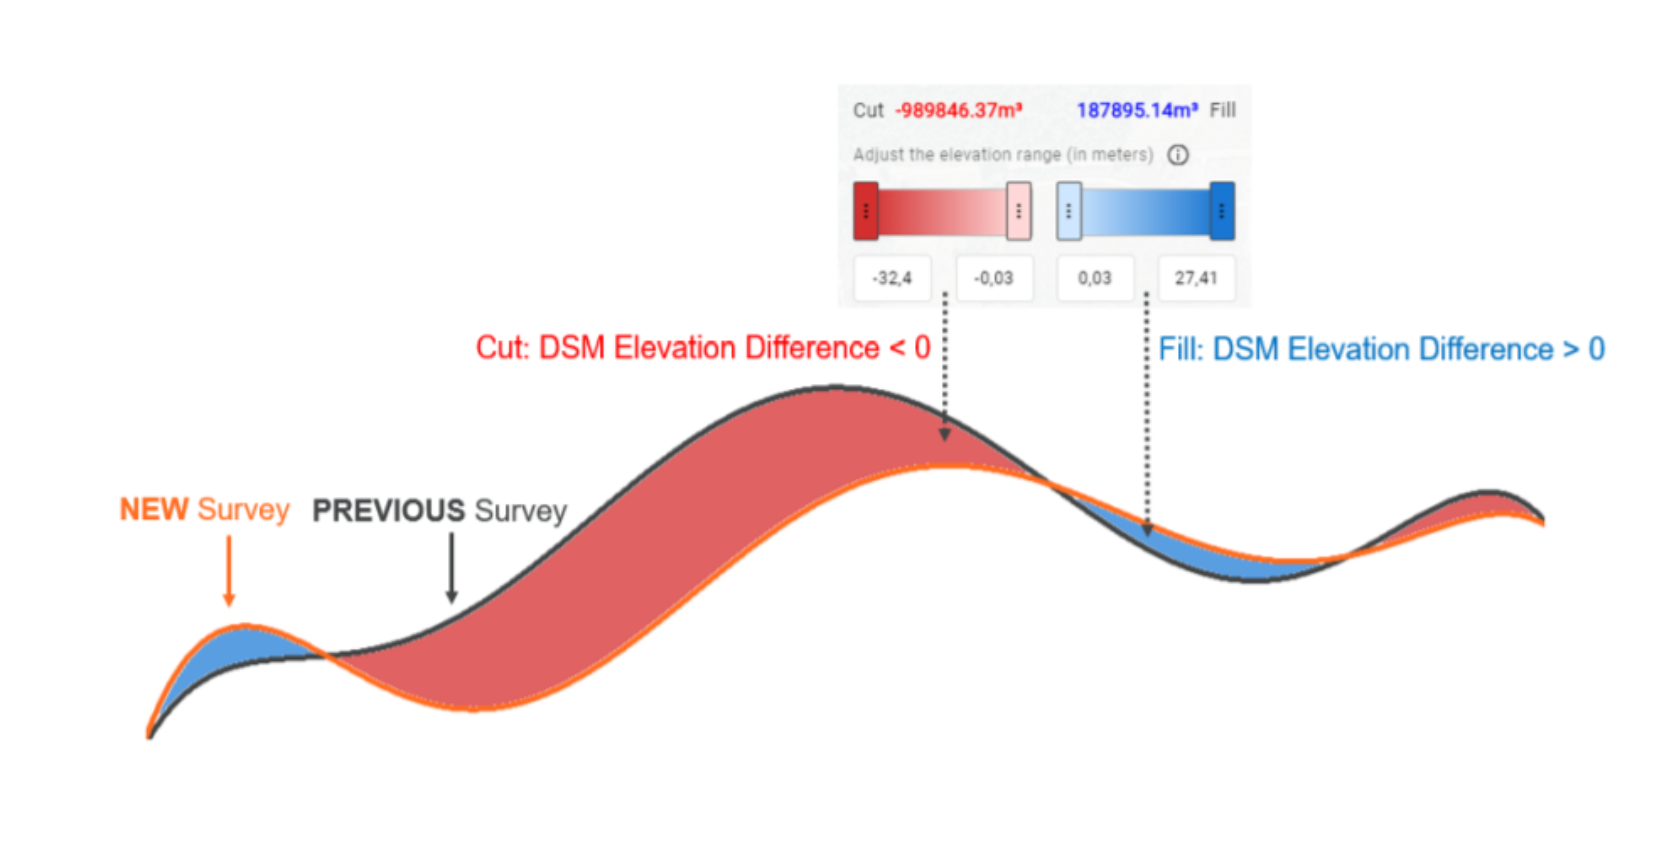
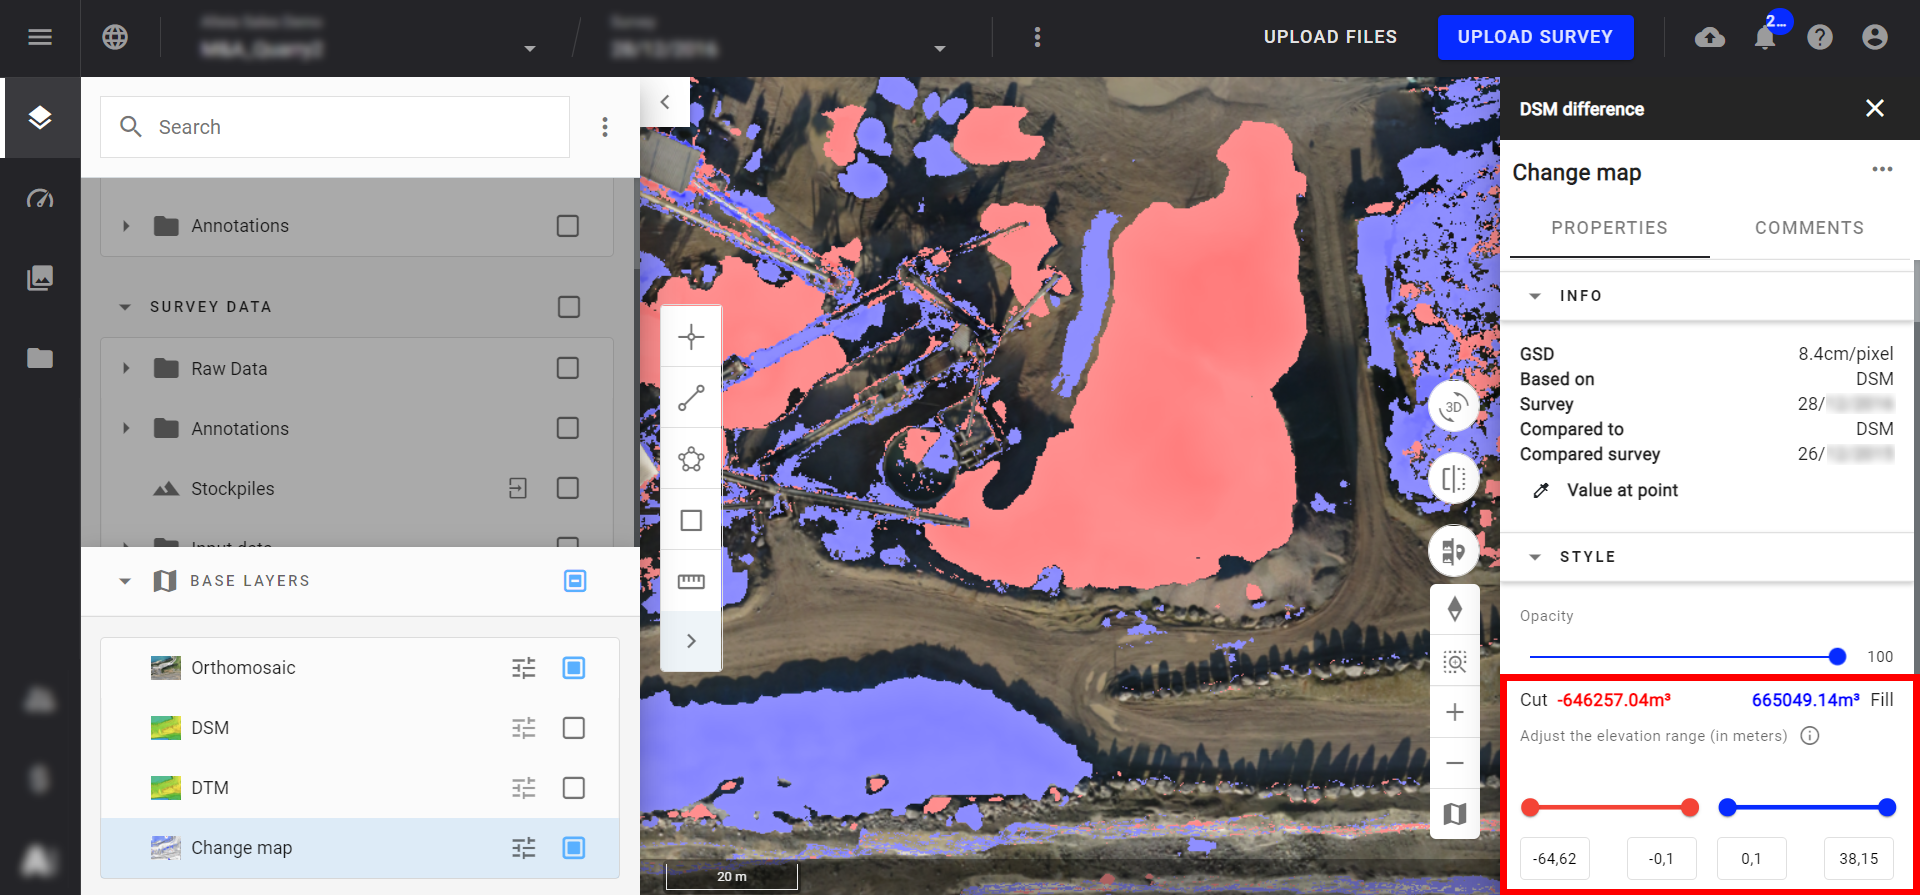
When viewing the color scale, the red areas represent those that are negative (cut) values while blue represents positive (fill) values.
Shown in another way:
2. Inputs
The project needs to contain at least two DSMs for the same location, having each DSM in a separate survey, in order to compute the change over time from the same geographical location.
3. Workflow
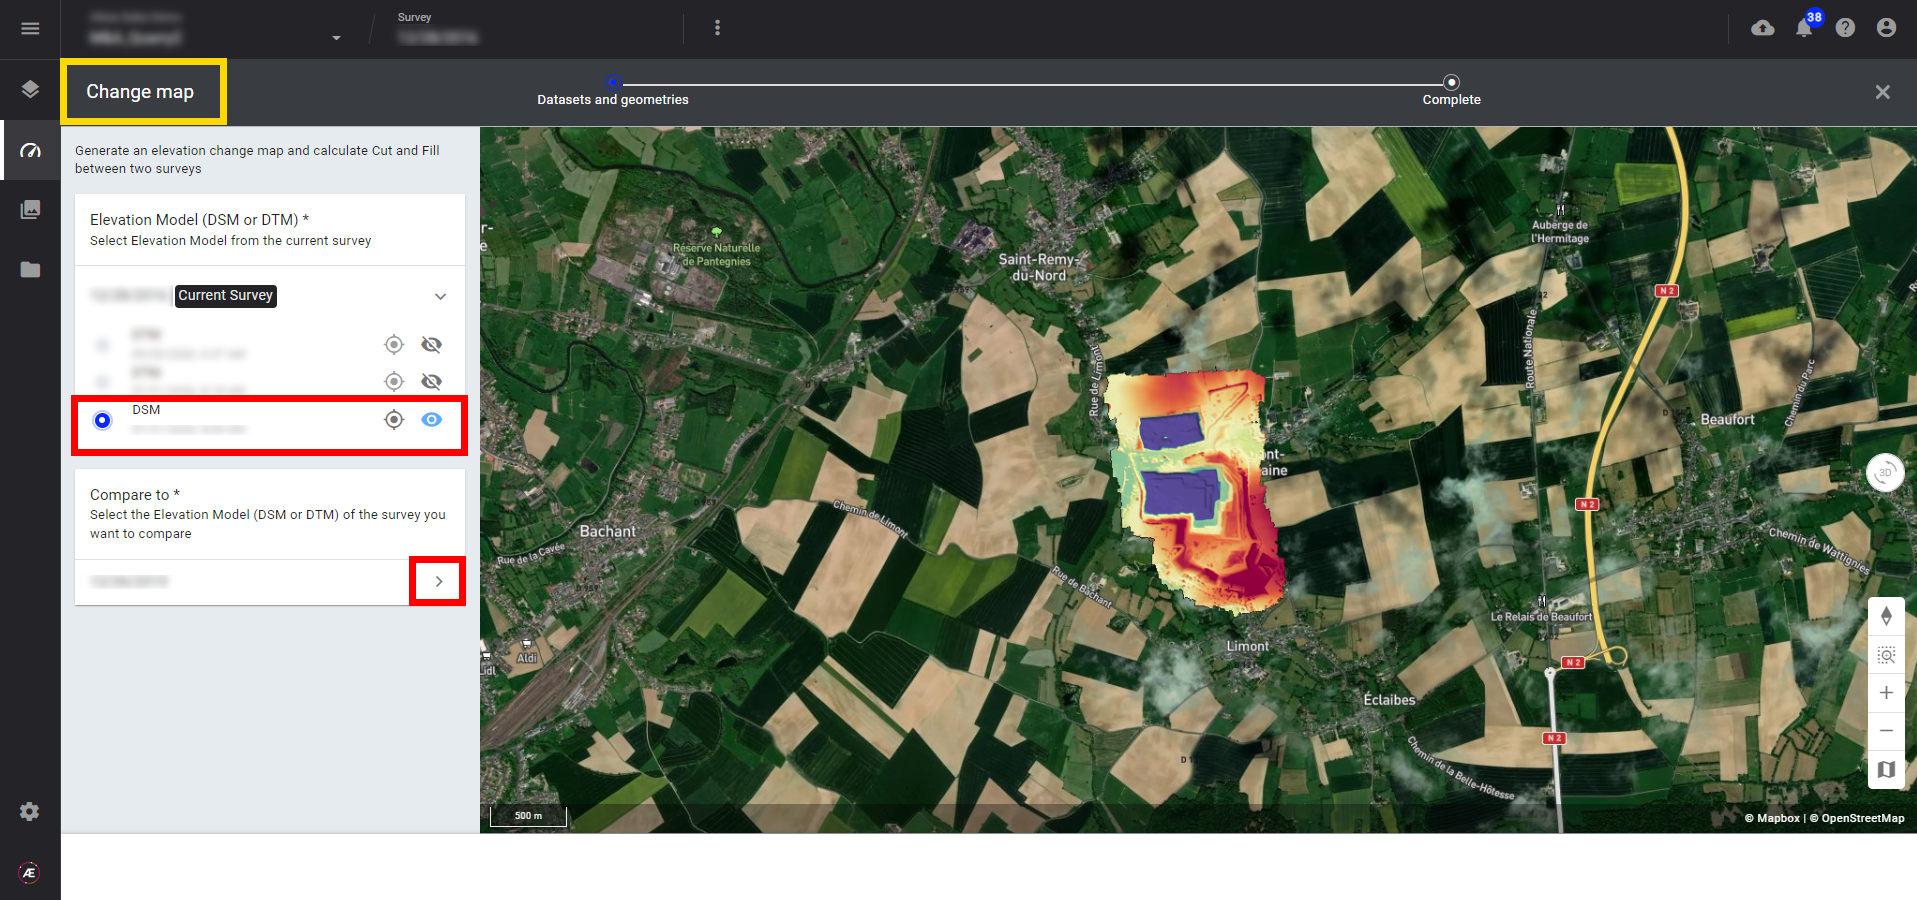
Step 1 - Select a survey that contains a DSM layer.
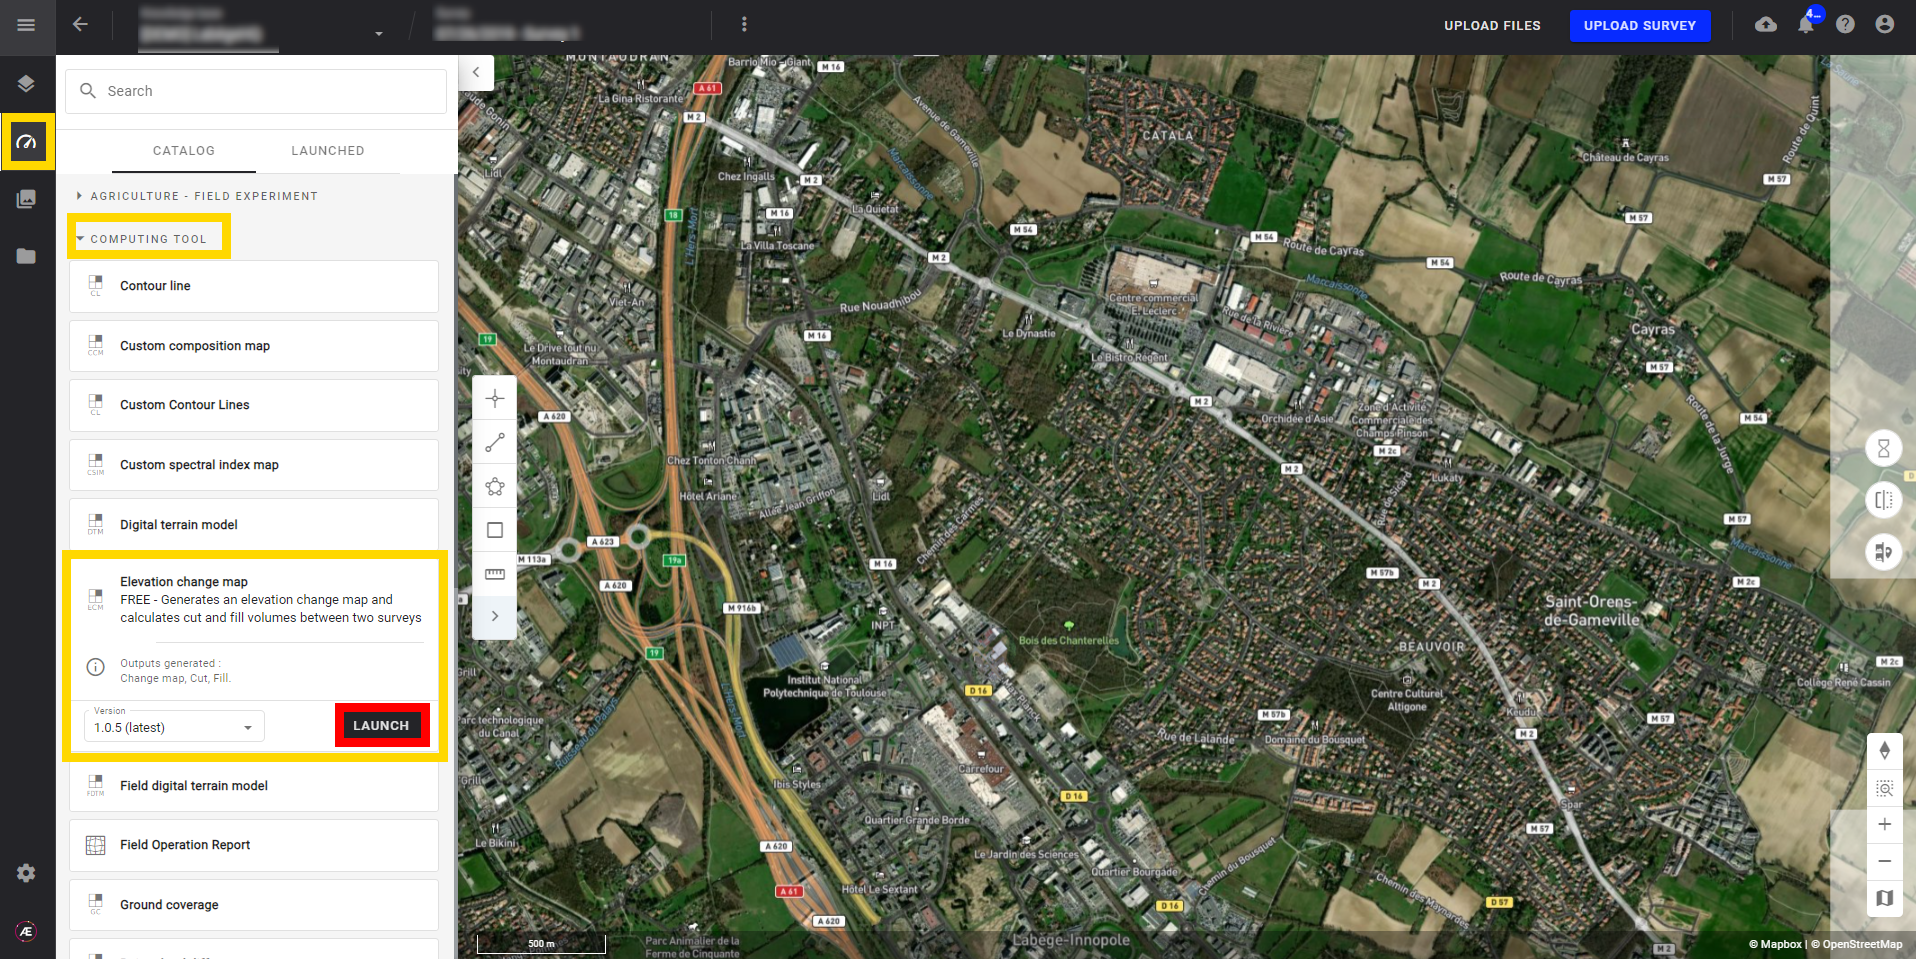
Step 2 - From the "Tools" menu search and select "Elevation change map".
Step 3 - Click on "Launch".
Step 4 - Select the DSMs to be compared.
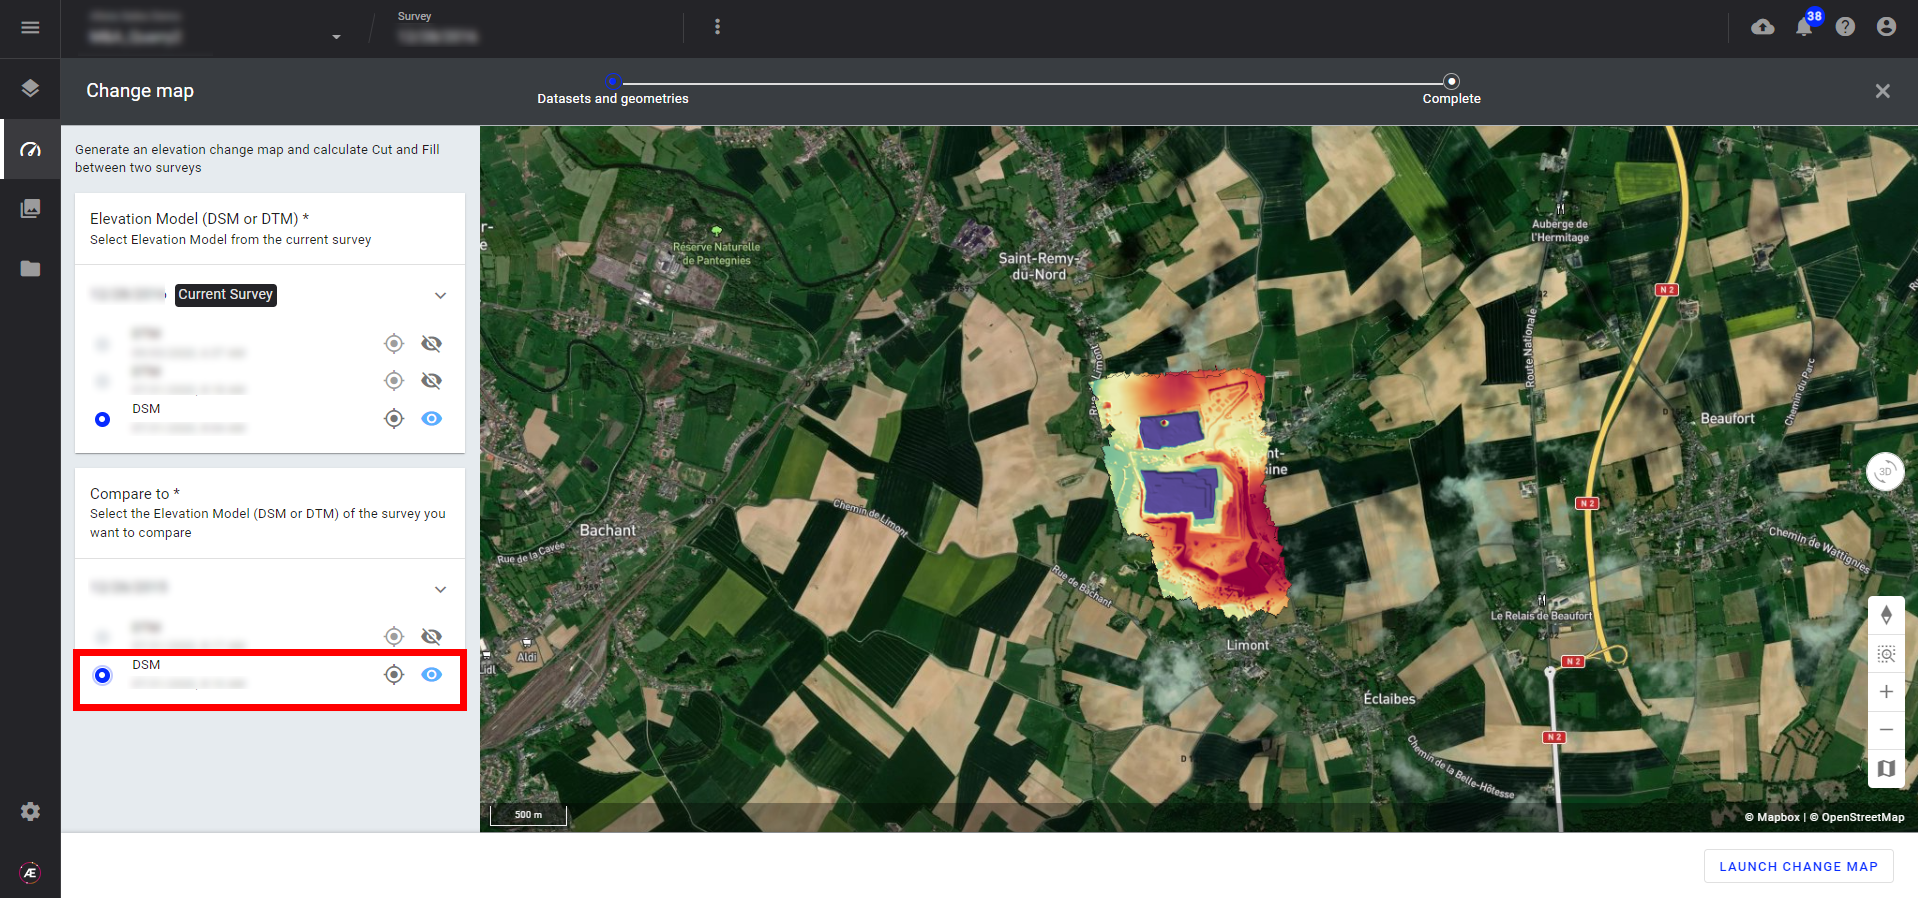
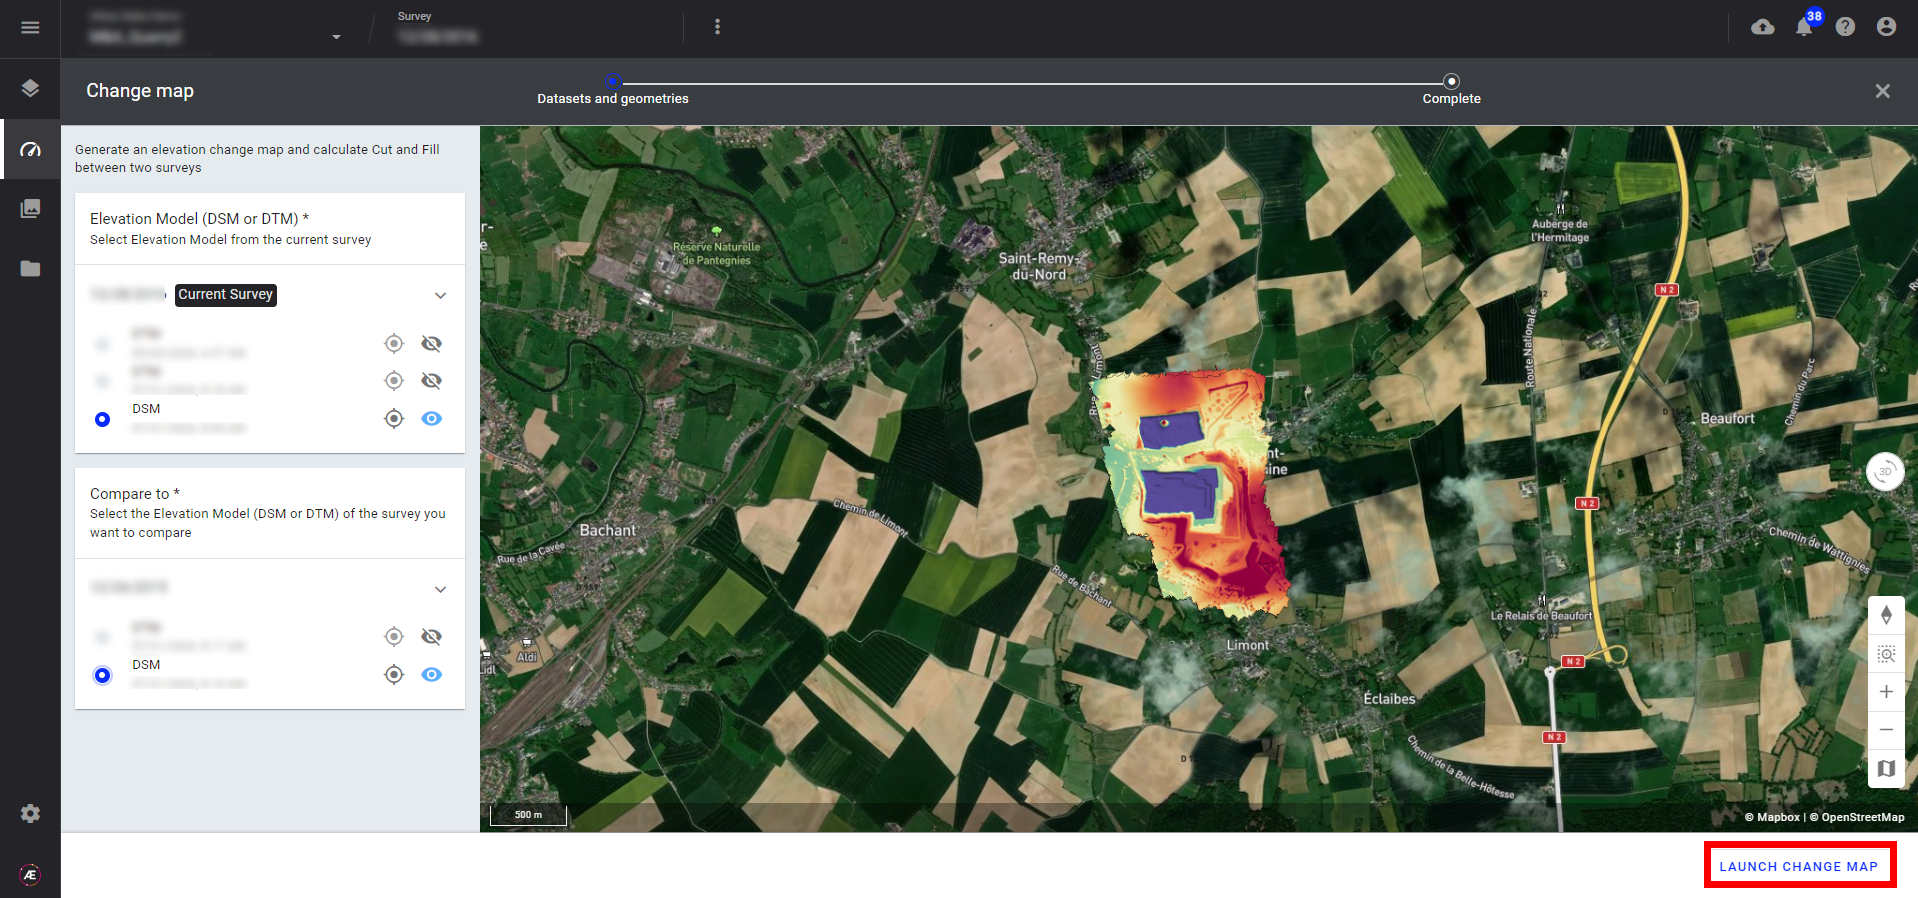
Step 5 - Click on "LAUNCH ELEVATION CHANGE MAP".
4. Results
When it is done check the Notification Center. A folder "Changes" is created in the survey data and a layer "change map" is created in the BASE LAYERS tab.
4.1 The "Changes" folder
This folder includes two vector files representing the Cut and Fill areas. These two vectors are for the measure of the differential volume in each area of the project.
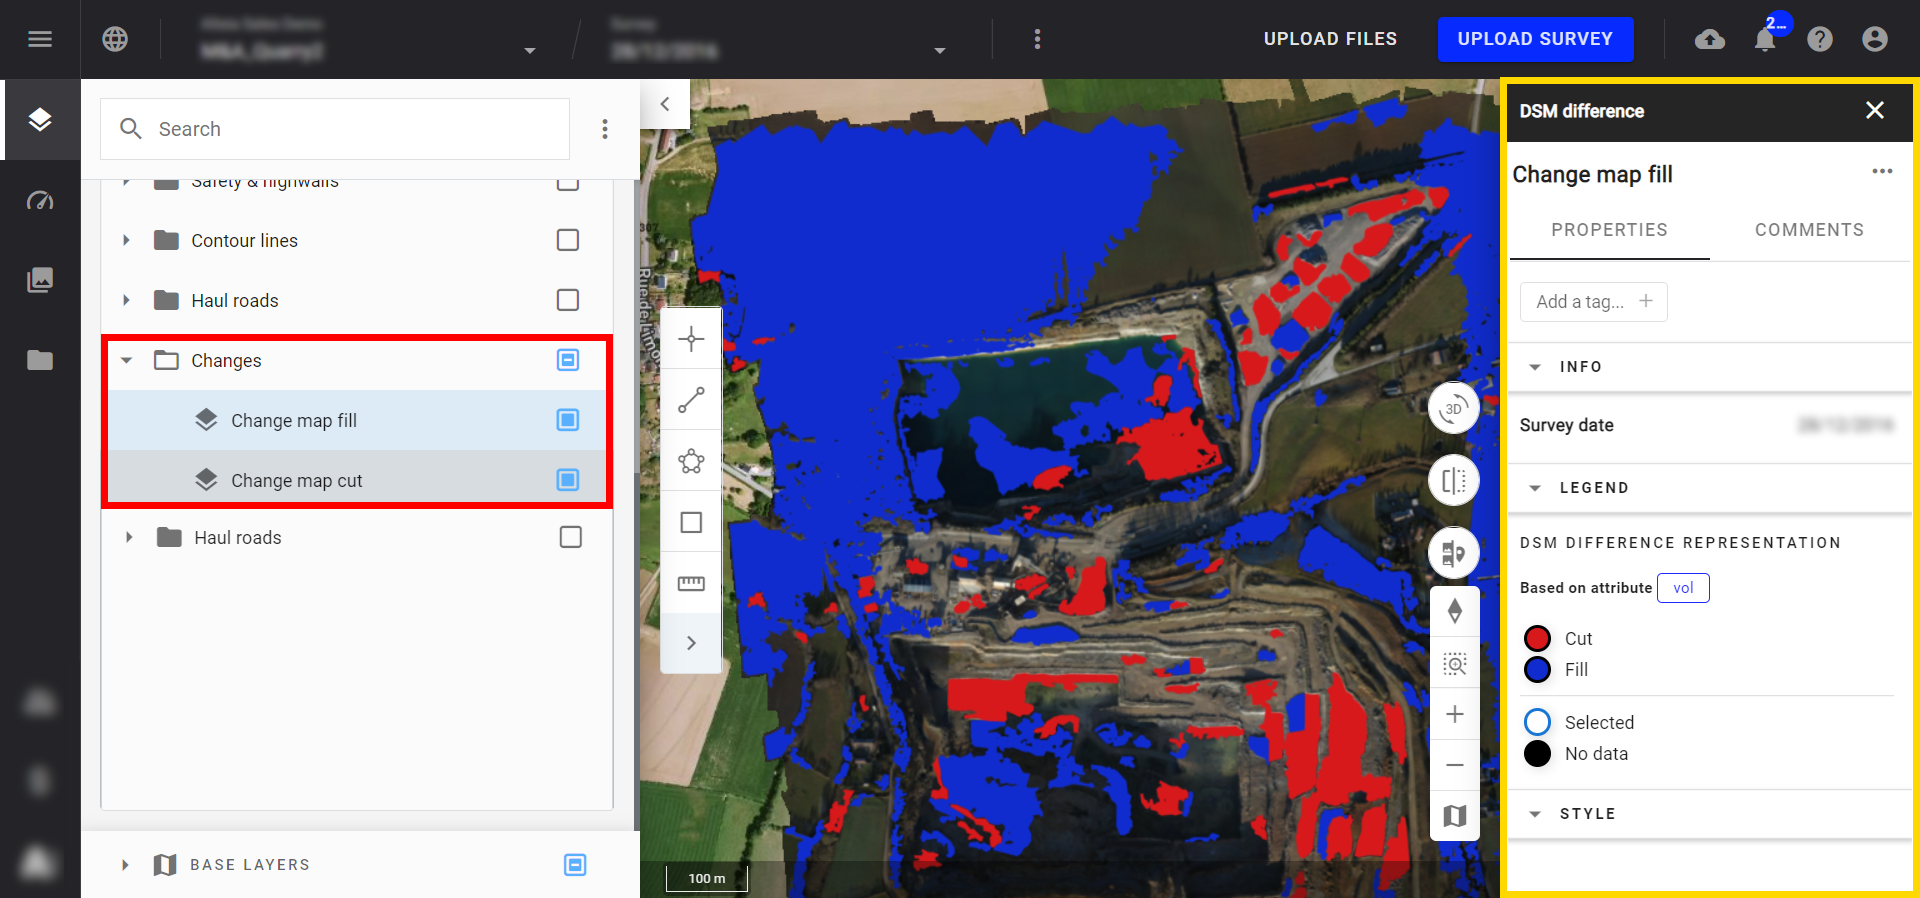
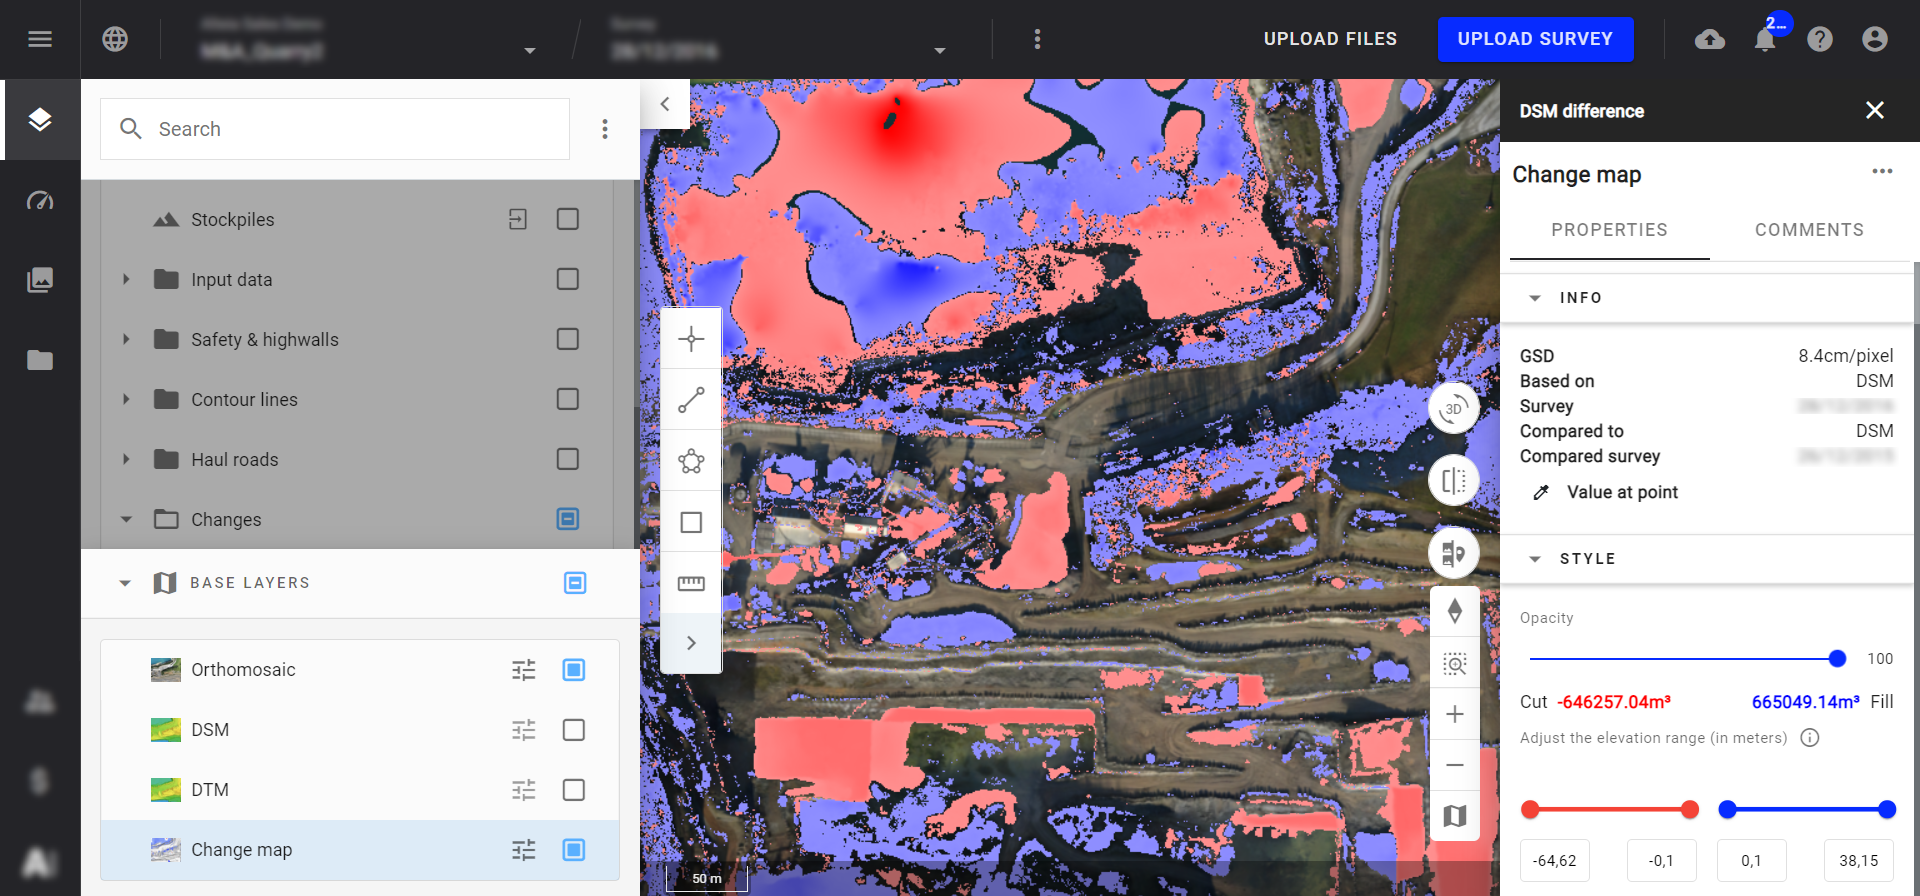
4.2 The "Change Map"
This map appears in the "Base Layers" tab.
To display the map, check the box and click the name "Change map" to open the right panel.
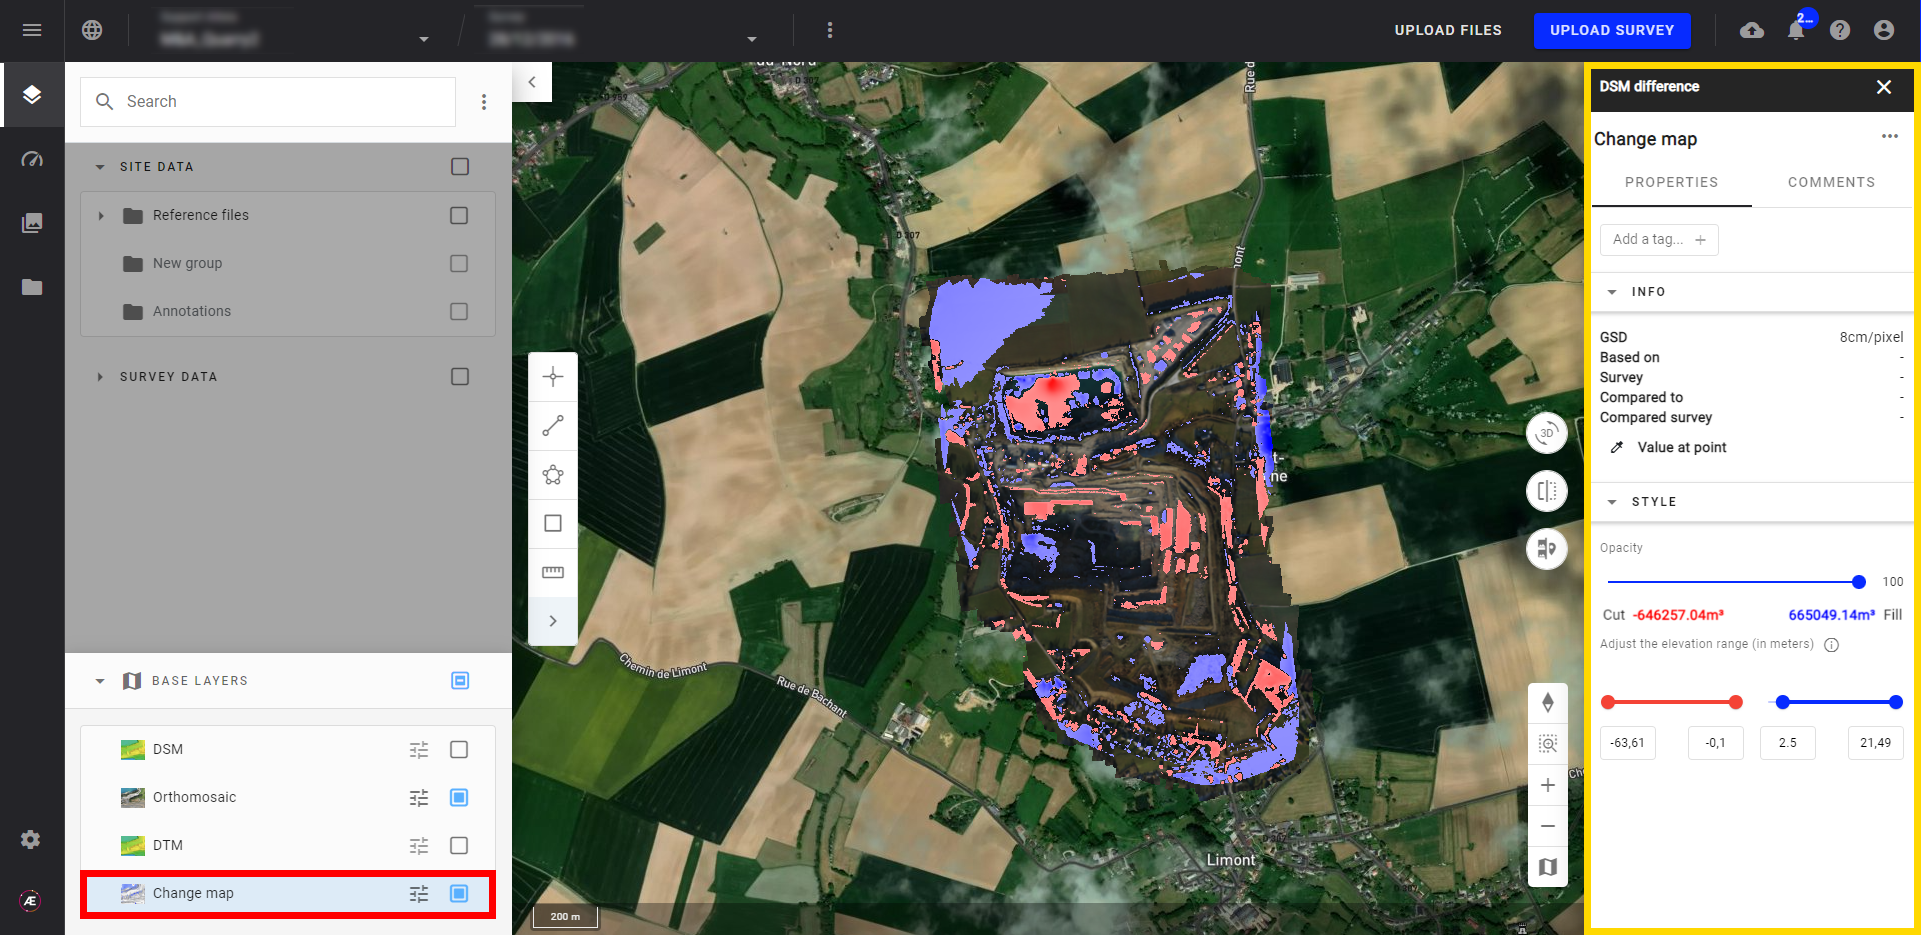
The right panel will display relevant information between the dates selected to issue the Change Map:
- Negative (Cut) values are displayed in red scale
- Positive (Fill) values are displayed in blue scale
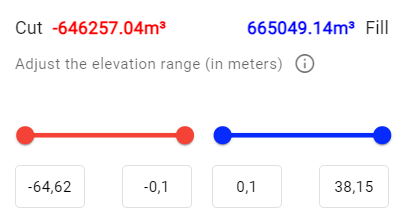
4.2.1 Elevation difference range adjustment
It is possible to adjust the range of visible elevation difference computed between the two surveys. It will update the change map displayed with the associated Cut and Fill volumes indicated by the range specified. You can either use the slider bars on Cut and Fill or manually input a value.
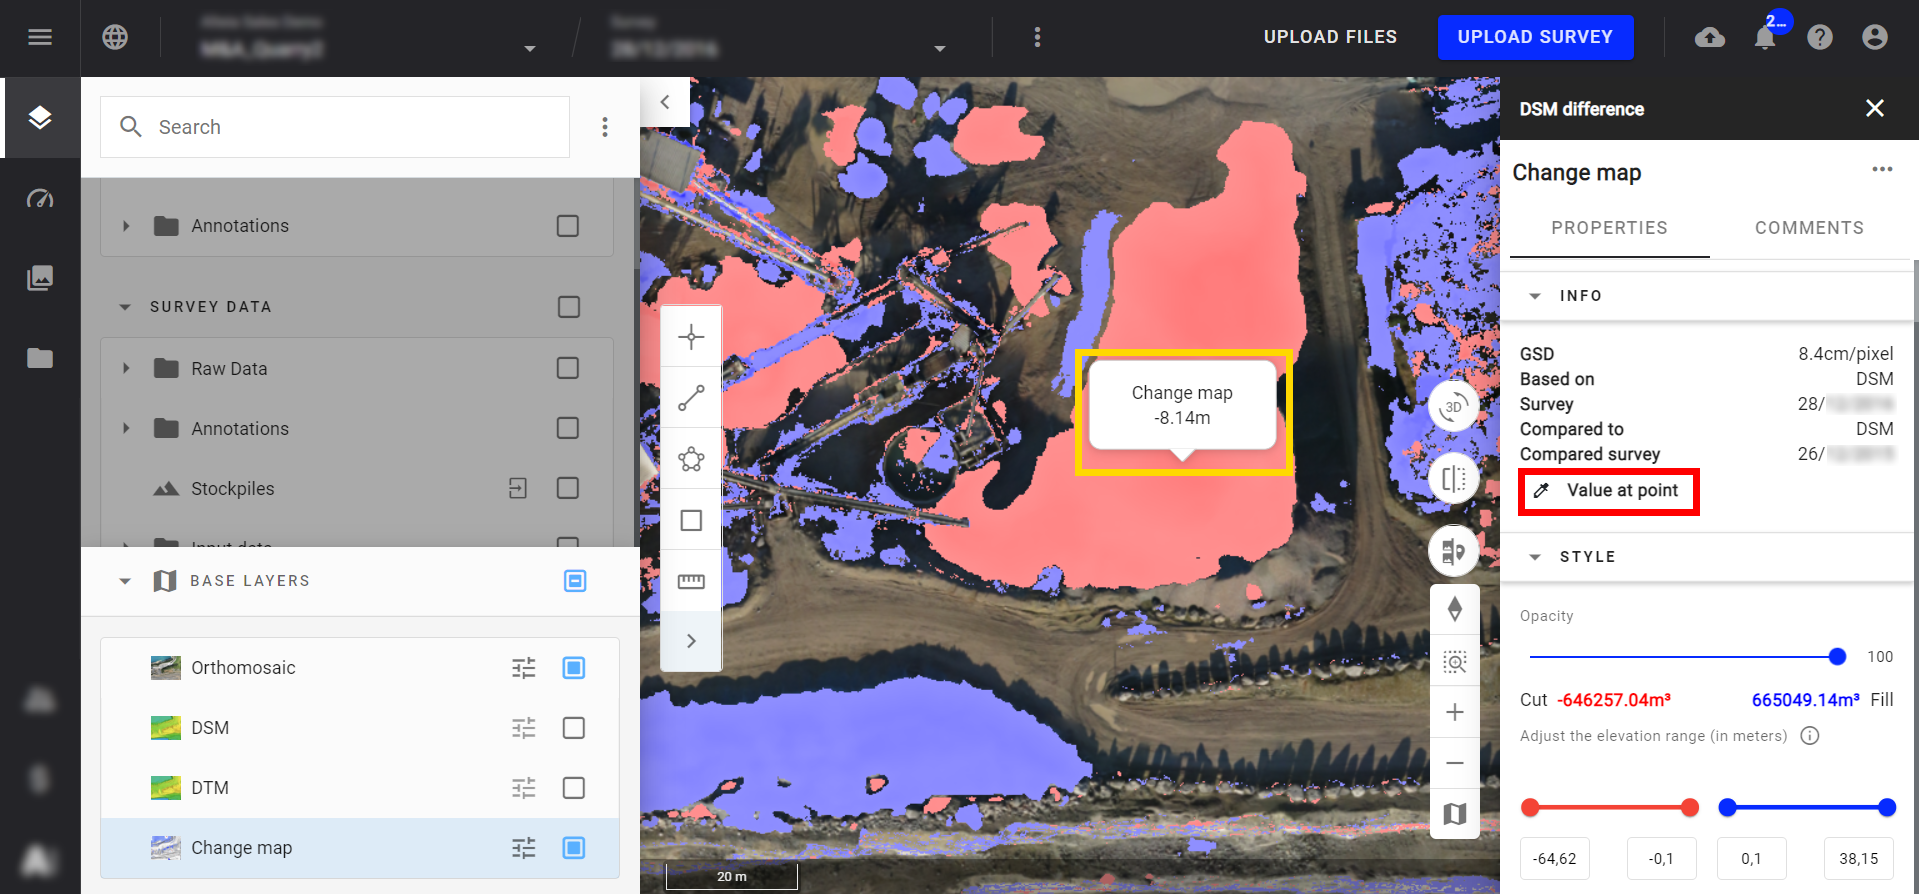
4.2.2 Value at Point
Use the “Value at point” feature to request the raster value (elevation difference) by clicking on any point of the map. Click on a red or blue polygon, it will show the elevation difference compared to the survey selected in the change map.
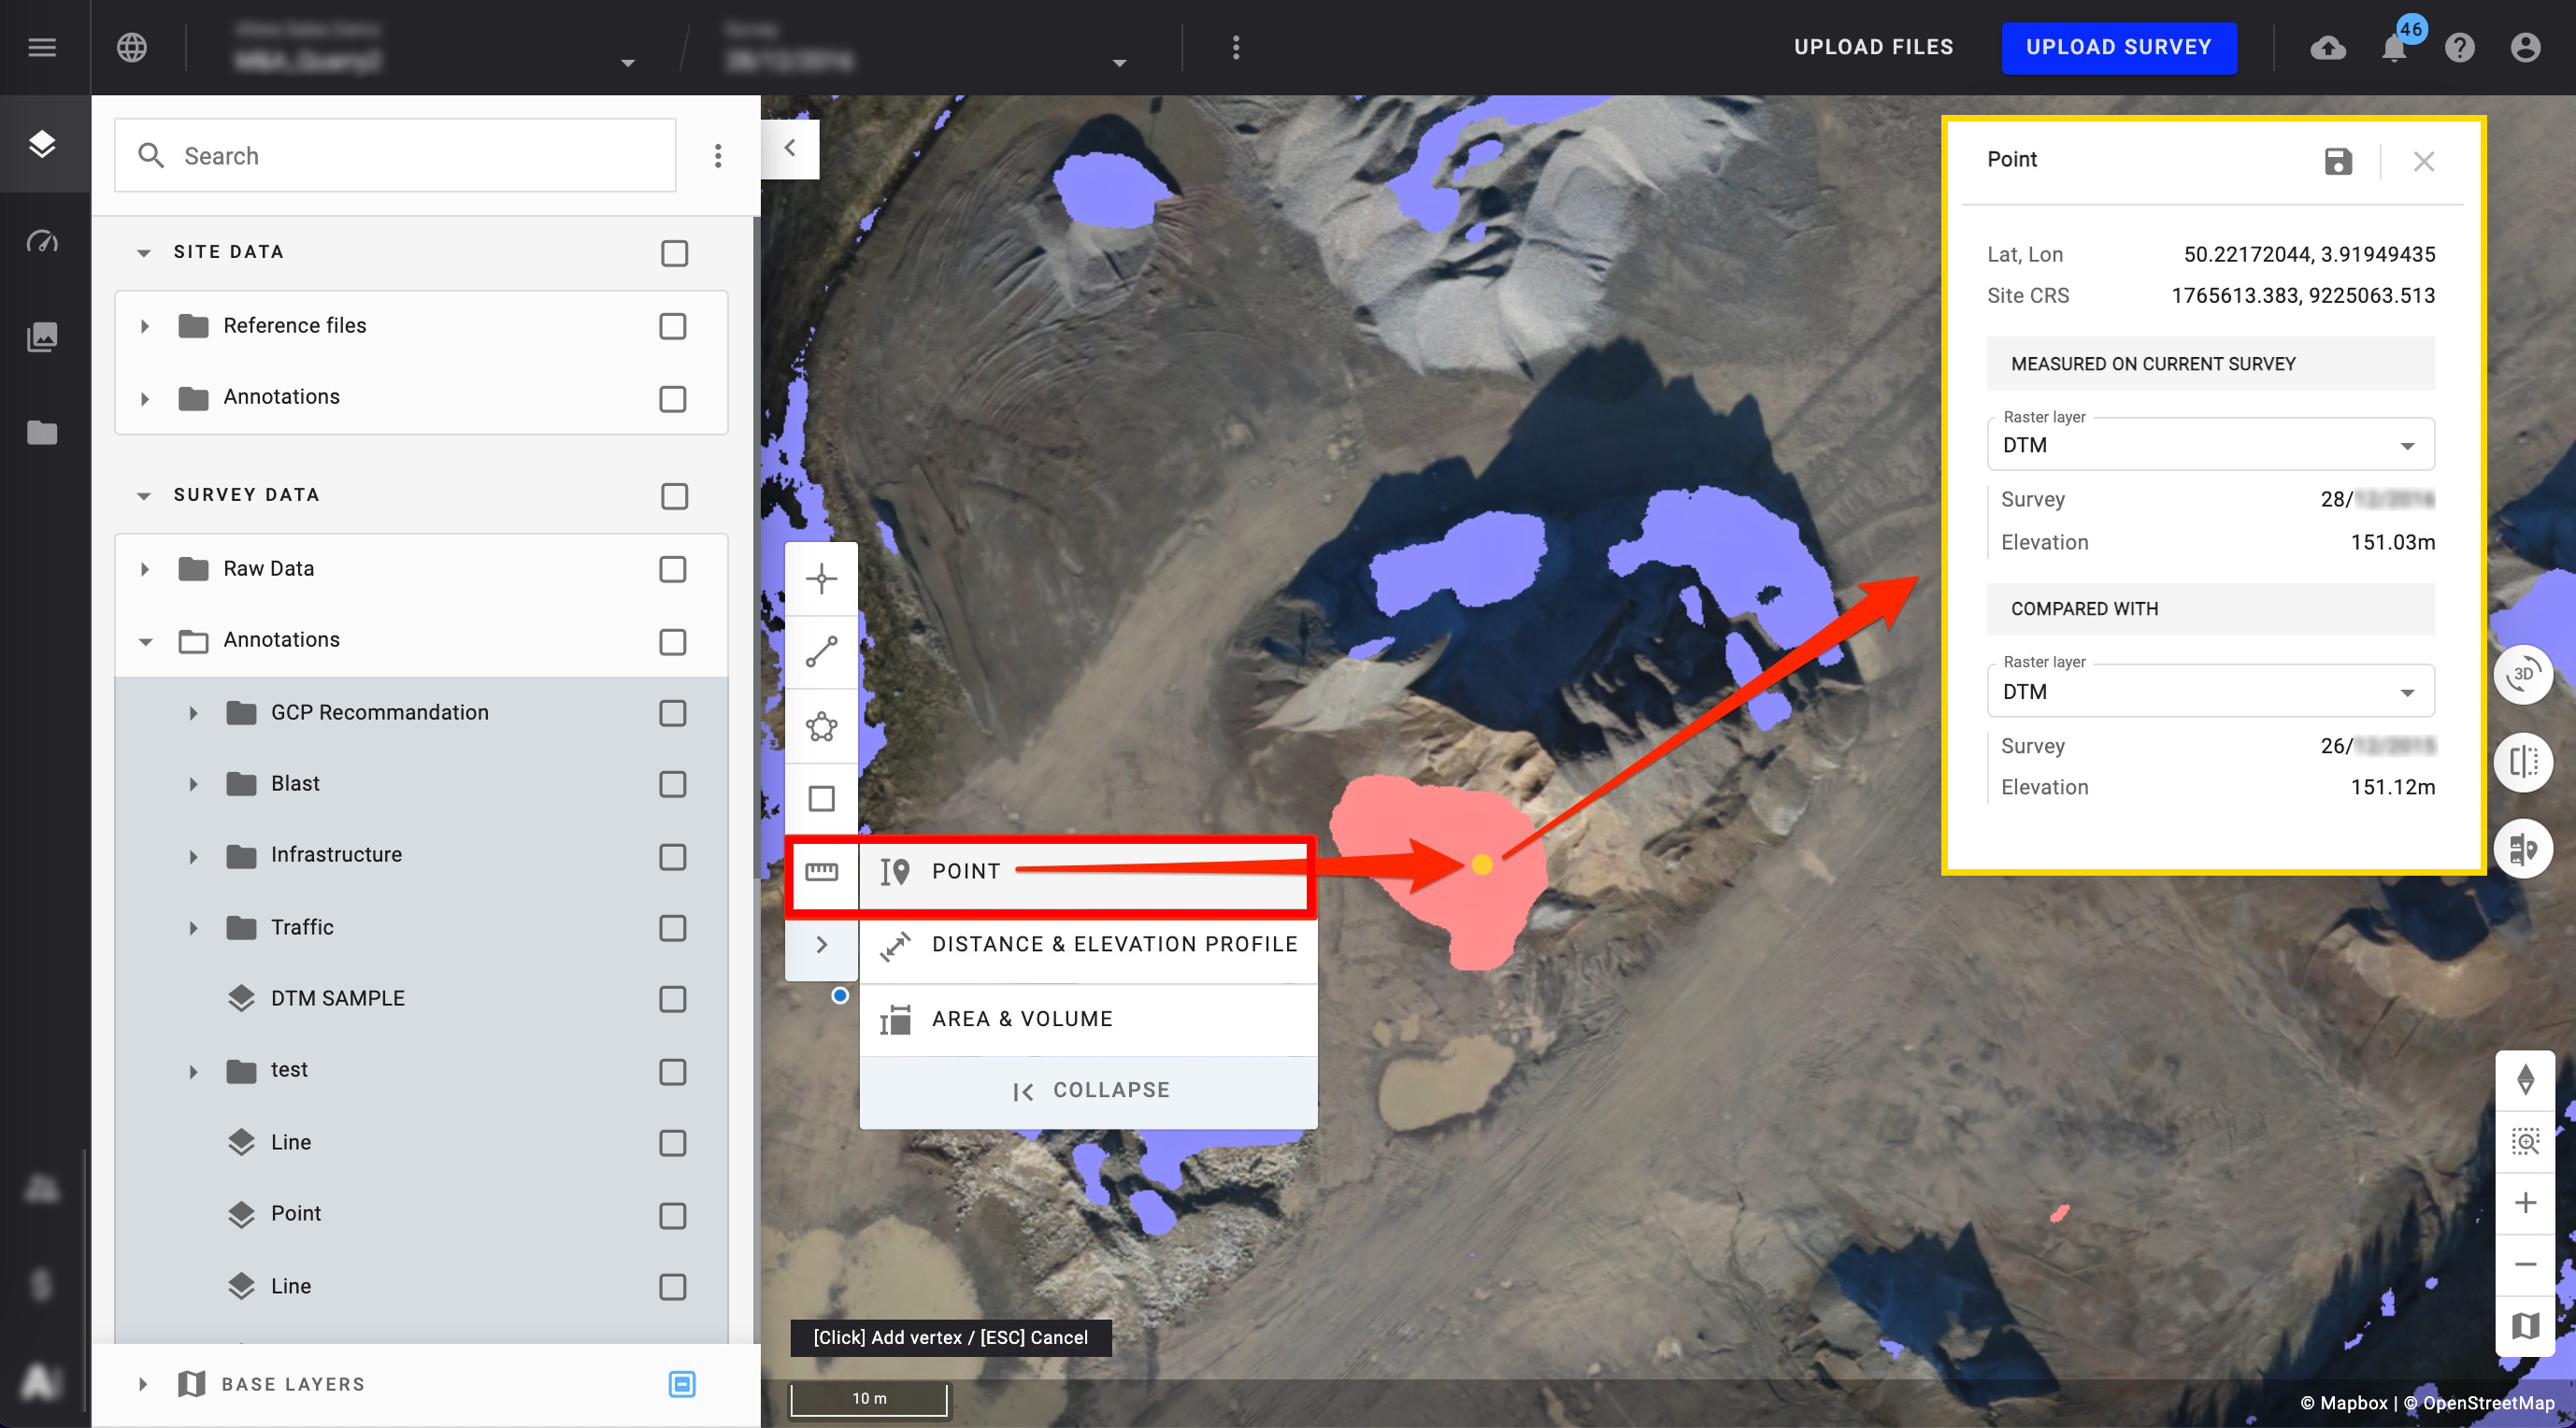
4.2.3 Annotation
Use a point annotation to extract all raster values under the point and compare the DSM values.
Open the point annotation from the measure panel > Drop a point where needed > a pop-up window will appear with the relevant information. If necessary, save the point to keep that information.
4.2.4 PDF export
Step 1 - Click on "Generate report"

A window will be displayed. The following options will be displayed:
- Size: A4 landscape
- Format: PDF
- Feature type : Annotation / Vector
Step 2 - Select "Vector" as feature type, then click on "NEXT"
Step 3 - Select the layers to be exported, then click on "EXPORT REPORT"
The report preview is displayed. It contains a maximum of 100 features. Each feature is shown, with their properties and their values.

Step 4 - Click on "DOWNLOAD" to download the PDF report
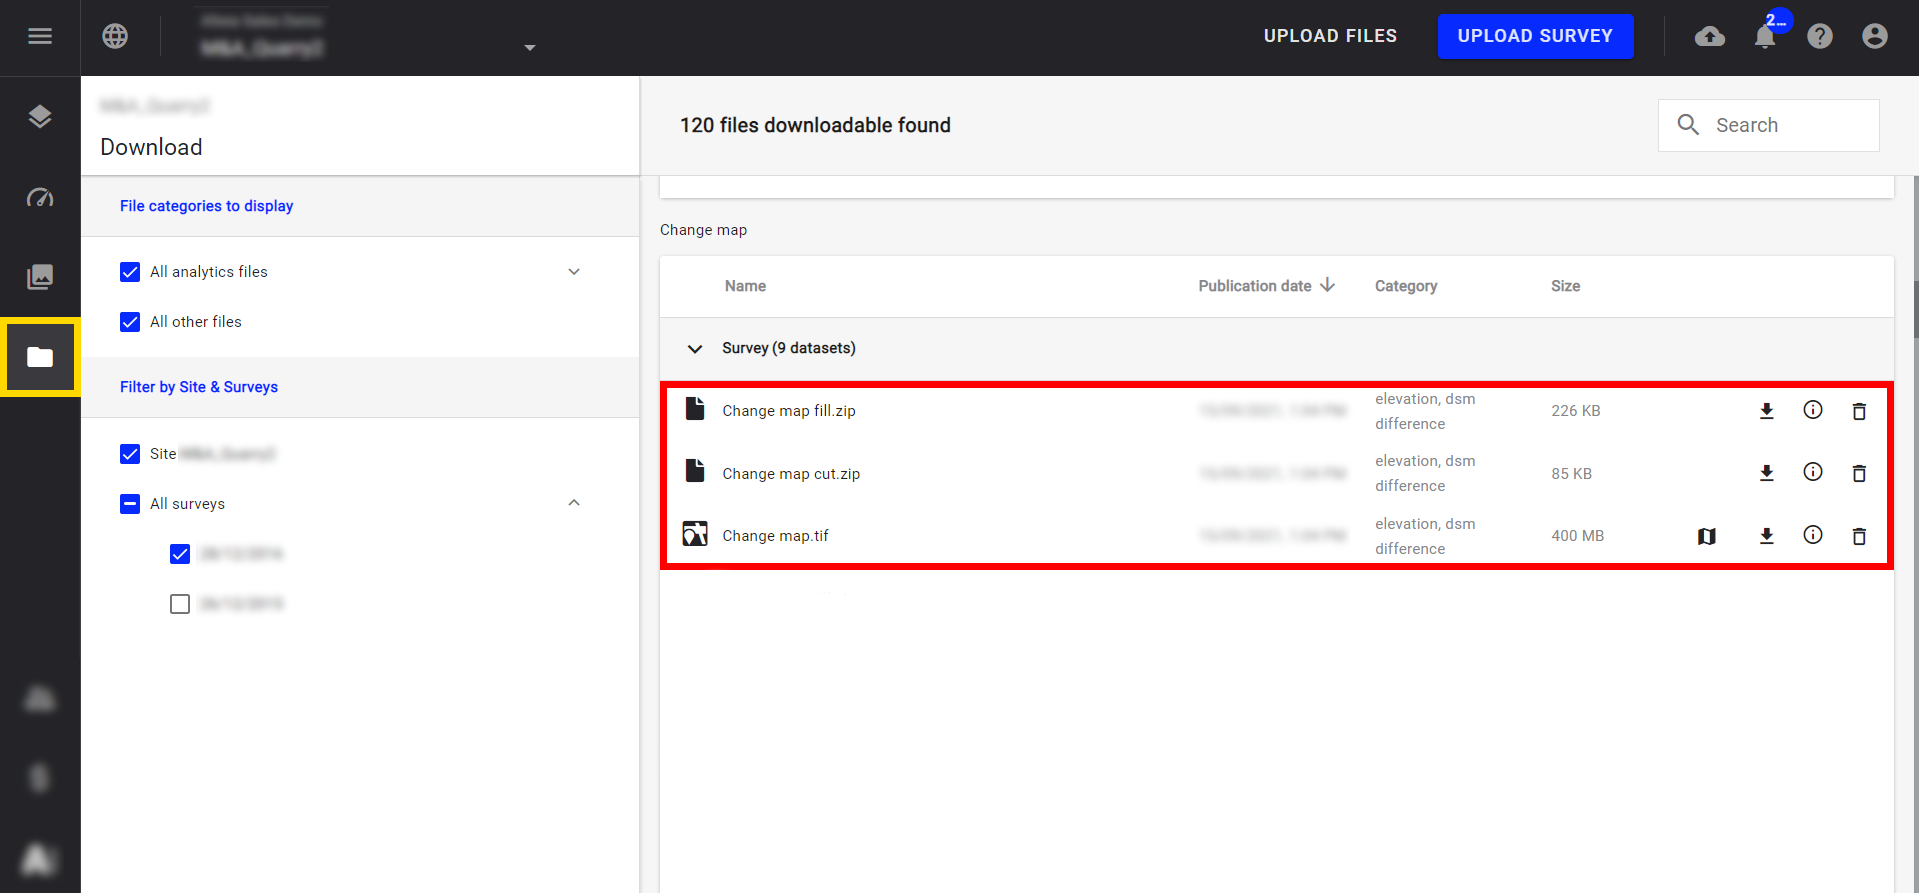
5. Deliverables
Three files are generated as deliverables and can be exported if necessary from the Downloads section:
- A vector "geoJSON" file containing the polygon vectorized from the raster result in terms of Fill (positive values)
- A vector "geoJSON" file containing the polygon vectorized from the raster result in terms of Cut (negative values)
- A raster "tif" file representing the height difference between both DSMs compared