Manual Import of Sentinel-2 Satellite Tiles
1. Description

Sentinel-2 satellites provide high-resolution multi-spectral images.
Importing satellite imagery can be an excellent alternative to flying over and acquiring data from UAVs in areas where they are not always deployable.
However, it should be noted that the resolution of these images does not equal those that can be acquired by drone.
In the case of the Sentinel-2 tiles import, the Ground Sampling Distance (GSD) is about 10 meters for 1 pixel.
Thus, some analyses, provided by the platform using images acquired by the drone cannot be performed.
Here is the procedure to follow to download Sentinel-2 satellite images via GEODES Platform and to upload them in Aether. (GEODES is a platform developed by the French National Center for Space Studies (CNES)).
2. Acquiring satellite resources (on GEODES)

2.1 Login or register to GEODES
Step 1 - Access GEODES portal.
Step 2 - Log in to the service or register (if first-time visitor)
2.2 Explore the tiles
Step 1 - Apply the filters of your choice (from "filters" tab).


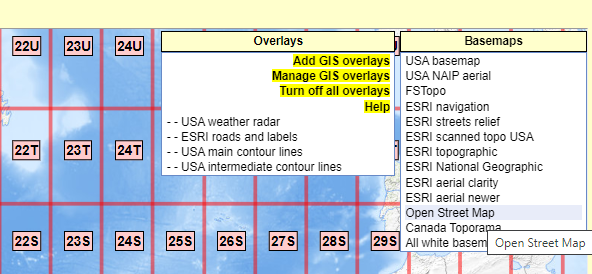
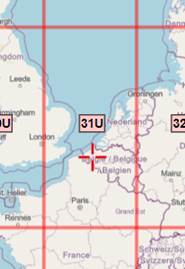
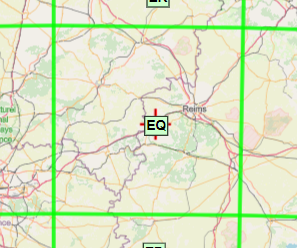
Step 2 - Search for the tile corresponding to your criteria (from "results" tab).

2.3 Download satellite tile
Step 1 - Once the desired tile is selected, click on “Download” under the tile image that opens on the right of the screen.


Step 2 - Once the download is complete, extract the compressed file to a well-identified file that will be used later.
3. Create a reflectance map (from QGIS software)
Use QGIS software to create a reflectance map.

3.1 Merge satellite spectral bands
Step 1 - Open QGIS software.
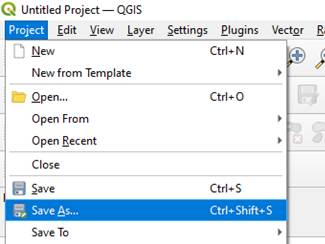
Step 2 - Create and save a new project.
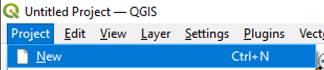
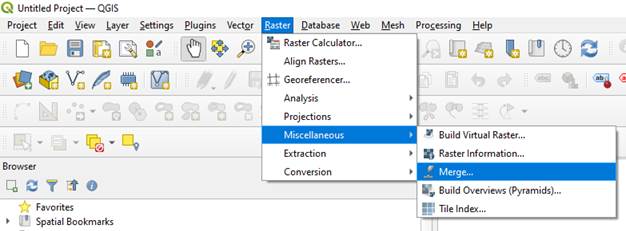
Step 3 - Click on “Raster” > “Miscellaneous” > “Merge…”
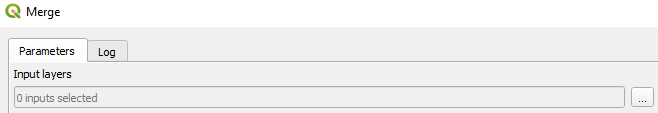
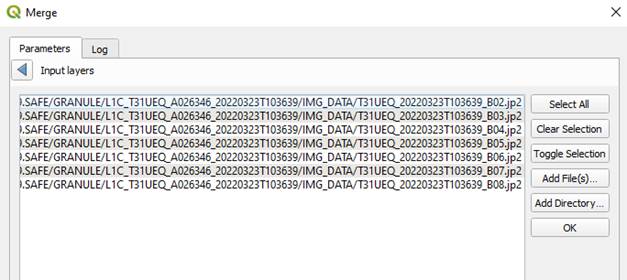
Step 4 - In the tab “Parameters”:
- In “Input layers” click on “…” then “Add File(s)…”.
![]()
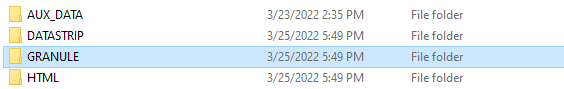
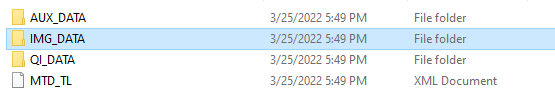
- Select the previously downloaded (and unzipped) file by double-clicking on it and then opening “GRANULE” and “IMG_DATA”.
![]()
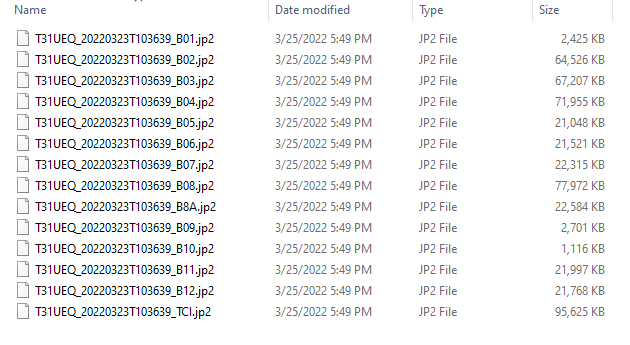
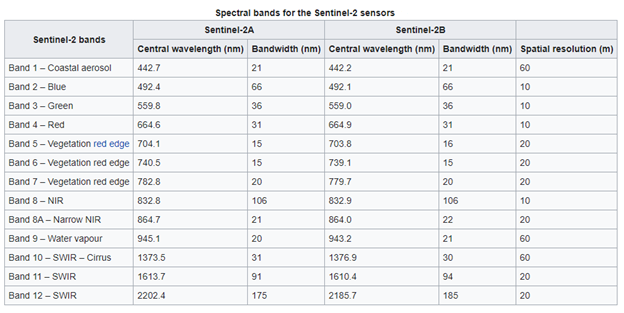
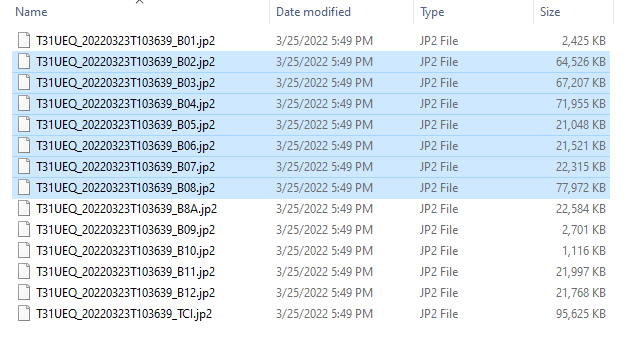
- 12 different spectral bands are acquired by the satellite. The latter are numbered from 1 to 12. (More information HERE).
- Select only bands from 2 to 8.
- They are respectively named "B02", "B03", "B04", "B05", "B06", "B07", "B08" and are in JP2 format.
- Once bands are selected, click on “OPEN” then “OK”.
- Tick “Place each input file into a separate band”.
![]()
-
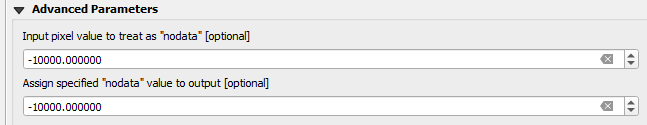
In the advanced settings:
- Set the number -10000 to “Input pixel value to treat as “no data” [optional]”.
- Set -10000 to “Assign specified “no data” value to output [optional]”.
- Select “No Compression” in the “Profile” line.

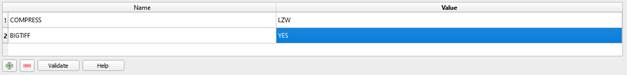
- Instead of “NONE” in the “COMPRESS” line, enter the value “LZW”.
- Instead of “IF_NEEDED” in the “BIGTIFF” line, enter the value “YES”.
- On the “Merged” line choose to save or not the reflectance map that will be created when the bands are merged. By default, a temporary file is created.
- Click on "Run".
![]()
![]()
3.2 Crop satellite raster output
Once the reflectance map is displayed, and ready to be cropped to remove non-desired parts of the map.
Step 1 - Drag and drop a vector file representing the contours of the plot/field you wish to observe (GeoJSON or Shapefile).
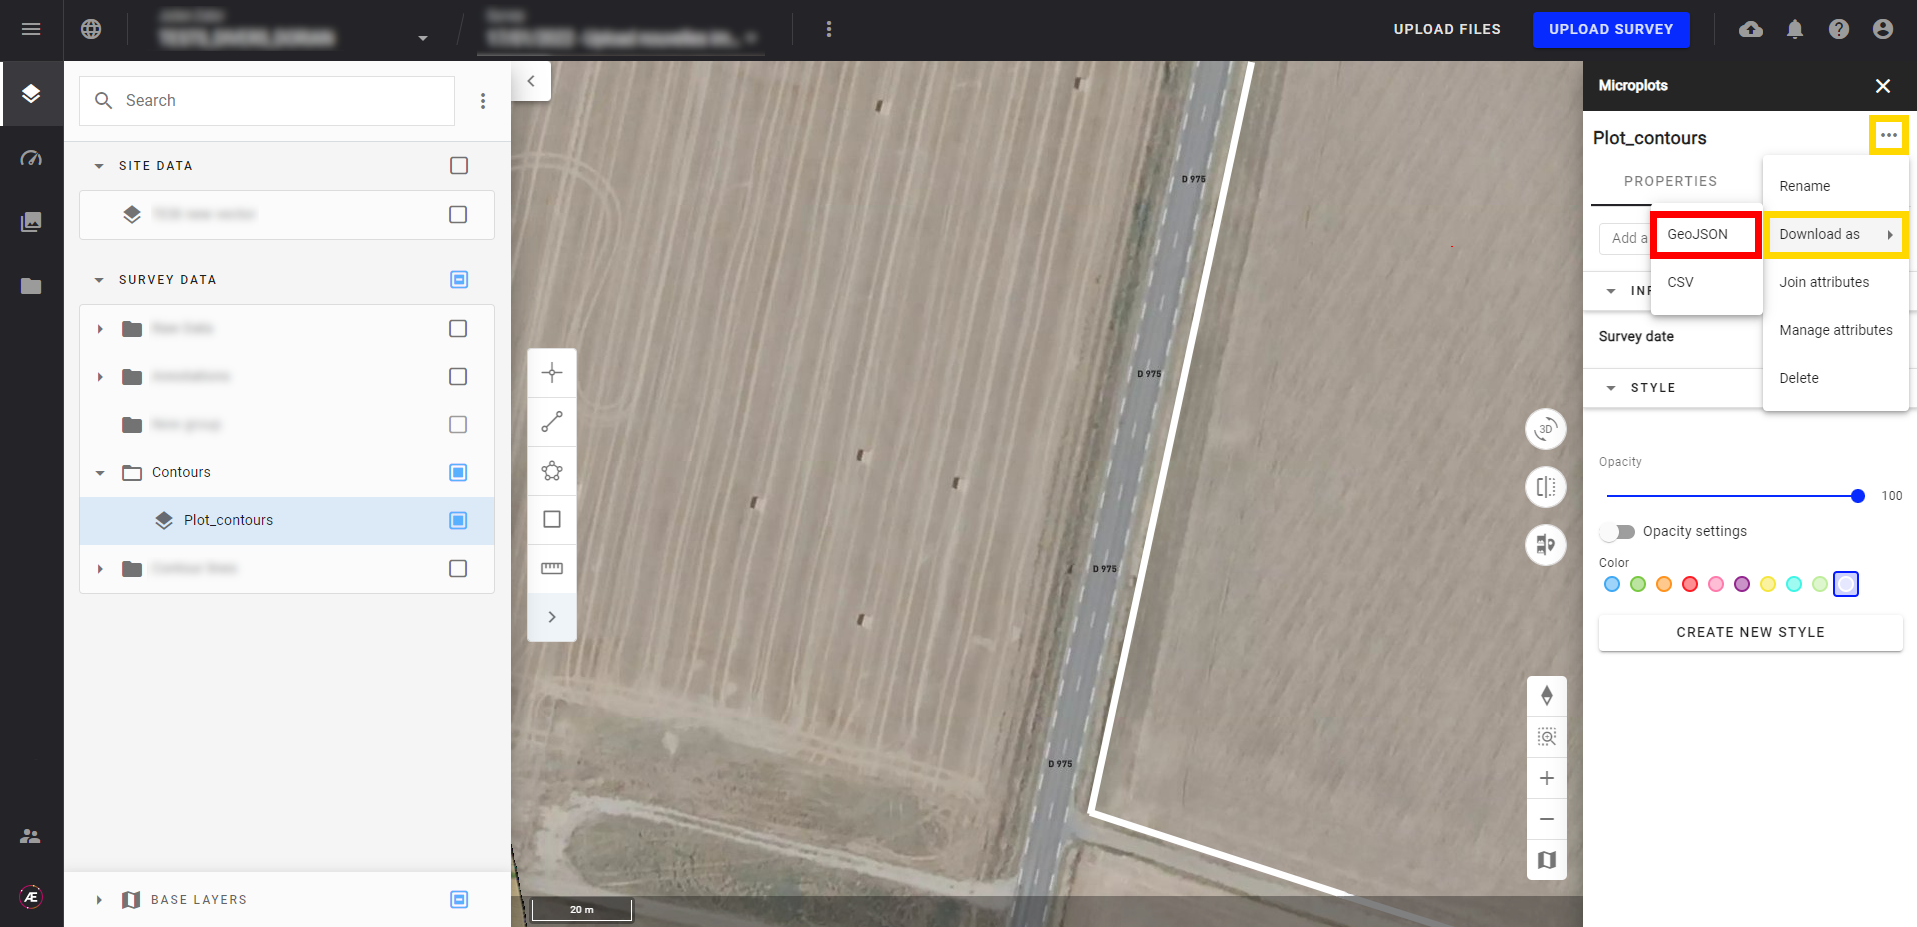
Once the folder is imported into QGIS, it will be added to the layers.
Step 2 - Right-click on the layer and click on “Zoom to layer”.
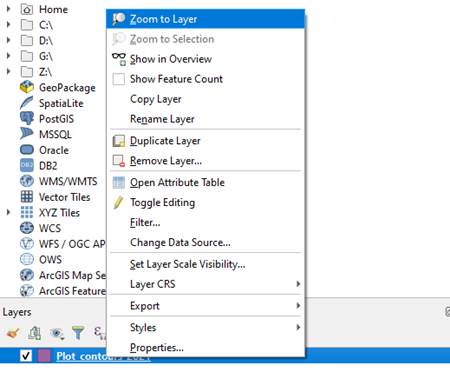
Step 3 - Click on “Raster” > “Extraction” > “Clip Raster by Extent…”
Step 4 - In the “Input layer”, select the newly created Reflectance Map.
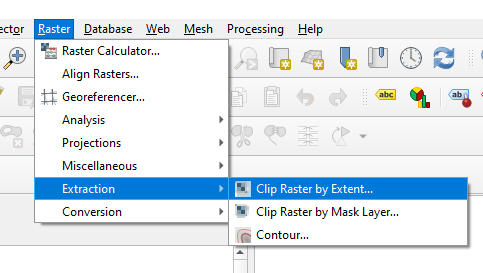
Step 5 - In "Clipping extent” section, select: “[…]” and select one of the 3 options available.
- You can then draw the area of interest directly, or use the download contours vector to delimit the same area.

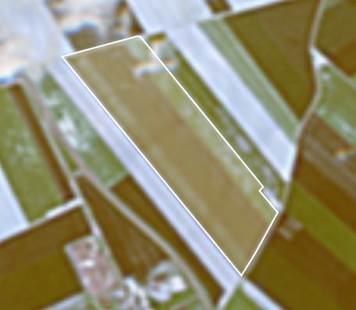
Step 6 - Define the area of interest you want to import to the platform.
Step 7 - Enter the value “-10000” in "Assign a specified no data value to output bands[optional]”.
![]()
Step 8 - In “Advanced Parameters”, and in “Profile”, select “No Compression”.
Step 9 - Instead of “NONE” in the “COMPRESS” line, enter the value “LZW”.
Step 10 - Instead of “IF_NEEDED” in the “BIGTIFF” line, enter the value “YES”. 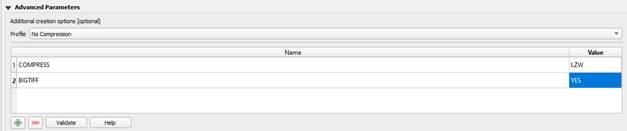
Step 11 - Choose the location where the newly clipped reflectance map will be saved. By default, a temporary file is created (download this file anyway to implement it on the Aether platform).
![]()
Step 12 - Click on “Run”.
![]()
At the end of this step, you get a raster file corresponding to the cropped reflectance map.
Next step: Integration of the raster on Aether.
4. Upload cropped raster in Aether
Step 1 - To upload a tile in Aether see Manual File Upload and choose to upload this file as a "new survey".
Step 2 - Make sure that the file is in the “Raster” type and in “Category”, select “Reflectances”.
Step 3 - Fill in the names of the corresponding bands.
Step 4 - If the bands have been correctly selected on QGIS, here is how to fill them on Aether:
- Band Name 1: Blue (B)
- Band Name 2: Green (G)
- Band Name 3: Red (R)
- Band Name 4: Red edge (705 nm)
- Band Name 5: Red edge (740 nm)
- Band Name 6: Red edge (RE)
- Band Name 7: Near IR (NIR)
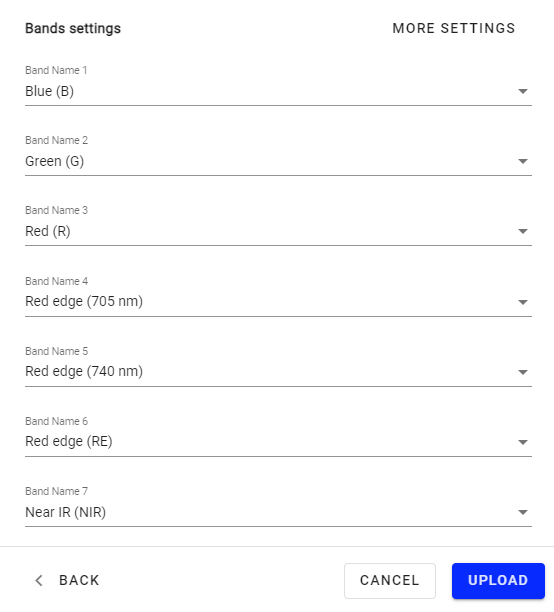
Step 5 - Click on “UPLOAD”.
Step 6 - Once the file is uploaded, different analytics could be launched with Aether as in the examples below.
- Example of launching a Fraction of Vegetation Cover (FCover) analysis on a Sentinel-2 cropped raster tile.
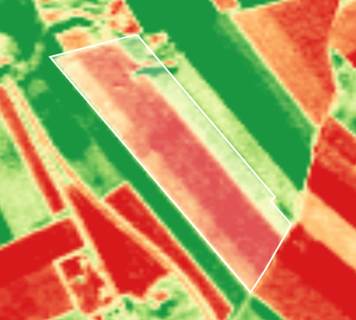
- RGB colors on the Sentinel-2 cropped raster tile.