Microplot Digitization
1. Description
This tool digitizes microplot boundaries. It allows for planning, measuring, benchmarking, and monitoring traits, as well as evaluating trial responses at the microplot level. Your own microplot ID is linked to each microplot for seamless data analysis.
2. Inputs
| Required | Description |
| Plot map file | A CSV file containing microplot IDs and representing the microplot map. |
| Optional | Description |
| Pattern file | A CSV file that allows the user to manage heterogeneous plots and alley dimensions within the same field. |
| Field Position | A vector file that defines the location where the microplots will be positioned. |
2.1 Plot map file
The Plot map is a CSV file that contains the microplot IDs and represents the microplot map.
| <Column Id> (X) | <Column id> (X) | ... | |
| <Row Id> (Y) | <Unique Plot Id> | <Unique Plot Id> | ... |
| <Row Id> (Y) | <Unique Plot Id> | <Unique Plot Id> | ... |
| ... | ... | ... | ... |
When creating the file, there are key rules that must be followed:
- The plot id must be unique.
- If you leave a cell blank (i.e. there is no plot id indicated), no plot will be displayed at this place.
- <Column Id> (X) and <Row Id> (Y) must be an integer and must begin by 1.
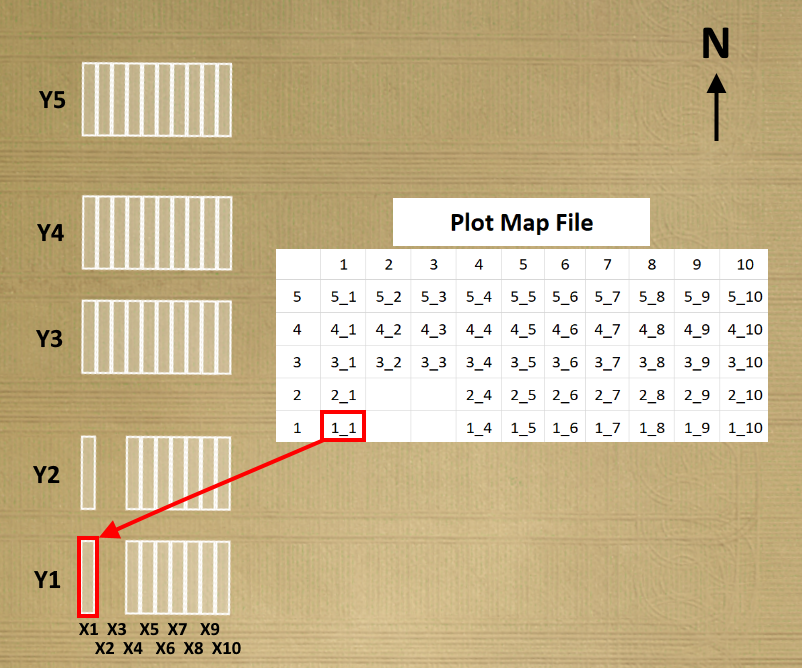
- The column and row orders in your plot map file don't matter but it is recommended to have the <Row Id> (Y) = 1 on the bottom left and the <Column Id> (X) = 1 on the top left, so the position of each plot is the same between the plot map and the output vector file that is displayed in the platform.
- So the plot with <Row Id> (Y) = 1 and <Column Id> (X) = 1 is the plot located at the bottom left corner, i.e. to the southwest of the field trial (see image below).
Below is an example of a properly formatted CSV file:
2.2 Pattern file
The Pattern file is a CSV file that allows the user to manage heterogeneous plots and alley sizes in the same field trial. The Pattern file enables the user to override the parameters defined in the Microplot digitization task for a given range of plots. It is important to note that this input is optional, especially if there is only one type of pattern in the field trial.
The Pattern file must contain four columns described in the table below:
| Type | Type of parameter (Plot size X, Plot size Y, Alley size X, Alley size Y) requiring a specific setting within the microplot vector. The column “Type” can be stacked as much as there are different patterns in the field. |
| Start ID |
Corresponds to where the setting of the parameter will start:
|
| Stop ID |
Corresponds to where the setting of the parameter will stop:
|
| Value | Distance in meters and only dots are accepted (no comma). |
| Type | Start ID | Stop ID | Value |
| [parameters] |
In addition to properly formatted headers, the parameters within the CSV file need to follow certain rules. Below is a table of the possible adjustments for different parameters:
| Plot size X | Corresponds to the dimension of the microplot on the X-axis (cf. columns in the plot map file). |
| Alley size X | Corresponds to the dimension of the alley between 2 microplots on the X-axis (cf. columns in the plot map file). The alley dimensions can be equal to 0 (meaning there is no spacing between microplots). |
| Plot size Y | Corresponds to the dimension of the microplot on the Y-axis (cf. rows in the plot map file). |
| Alley size Y | Corresponds to the dimension of the alley between 2 microplots on the Y-axis (cf. rows in the plot map file). The alley dimensions can be equal to 0 (meaning there is no spacing between microplots). |
So, a complete example of a correctly formatted CSV file is as follows:
| Type | Start ID | Stop ID | Value |
| Plot size X | 1 | 3 | 3 |
| Plot size X | 3 | 8 | 5 |
| Alley size X | 1 | 3 | 0.5 |
| Plot size Y | 3 | 5 | 8 |
| Alley size Y | 3 | 5 | 1 |
| … | … | … | ... |
In the example above, it means that:
- The microplots located between columns (X) 1 and 3 have a size of 3m.
- The microplots located between columns (X) 3 and 8 have a size of 5m.
- The distance of the alleys between columns (X) 1 and 3 is 0.5m.
- The microplots located between rows (Y) 3 and 5 have a size of 8m.
- The distance of the alleys between rows (Y) 3 and 5 is 1m.
- The other microplot and alley dimensions not defined in the Pattern File will be designed based on the parameters defined in the Microplot Digitization task.
Below is an example of correctly formatted headers in the CSV file:
2.3 Field position
The Field position input (generally the field trial boundary), allows you to roughly position the generated microplot file at the centroid of this file. It can be an imported vector file (point, polygon), or a contour created directly on the platform as an annotation and converted into a field boundary (see: Field Boundaries Creation).
This input is optional if there is already a vector or raster (for example, from the photogrammetry), associated with the survey. If there is no existing vector or raster, the field position is mandatory. If no field position is selected, the microplot file will be positioned at the centroid of the project.
3. Workflow
3.1 Upload input files
The first step is to upload the input files, formatted as described above. Only the plot map file is mandatory.
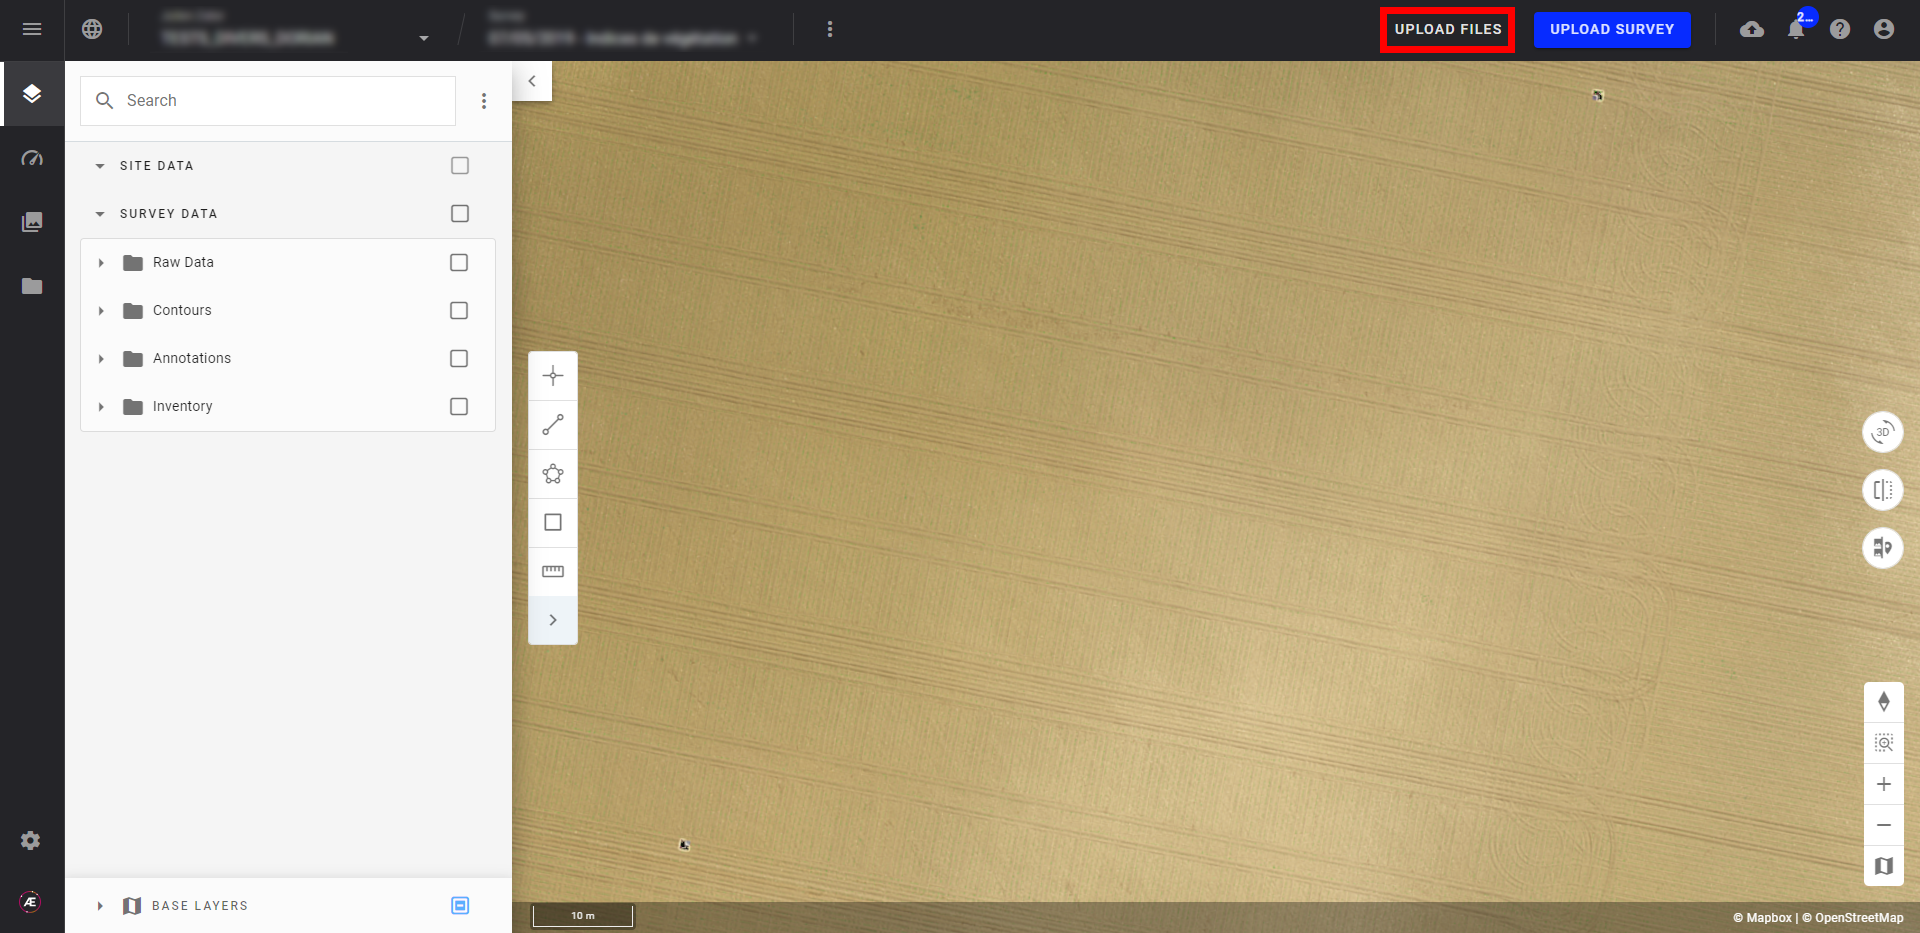
Step 1 - Select "UPLOAD FILES" from the top menu.
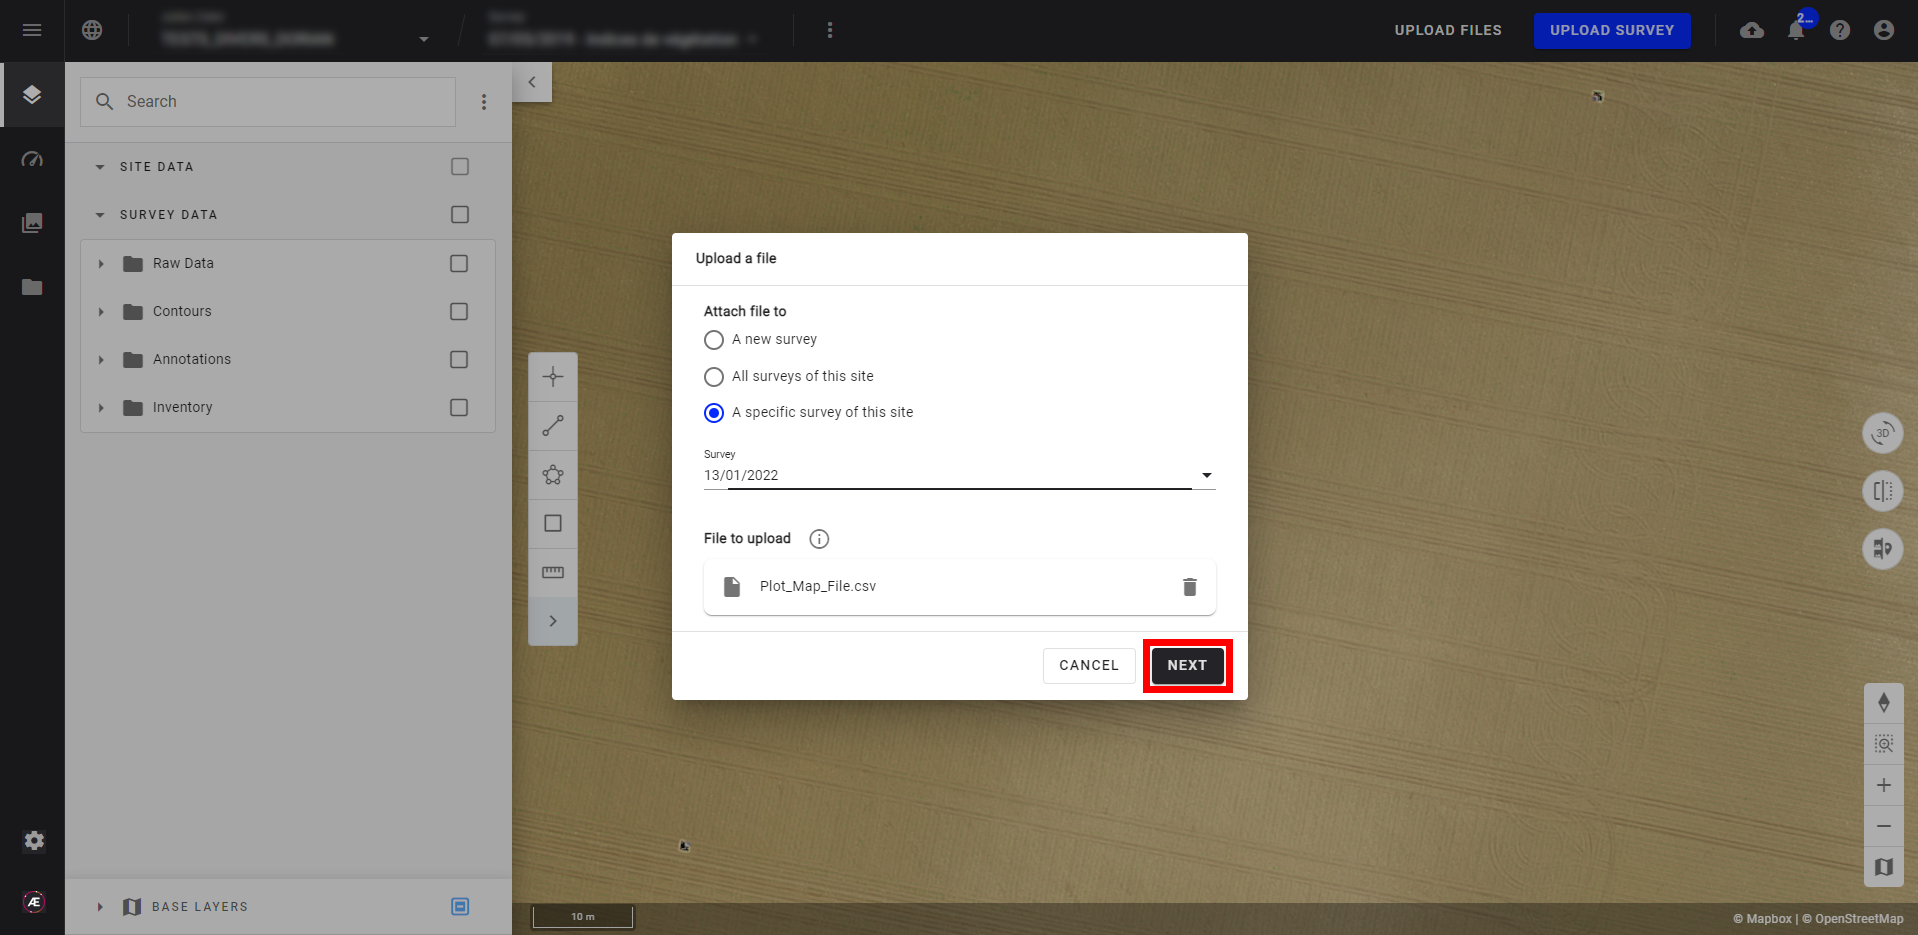
Step 2 - In the pop-up window, select the project you wish to upload the files to, and either drag-and-drop or browse for the appropriate file and select "NEXT STEP".
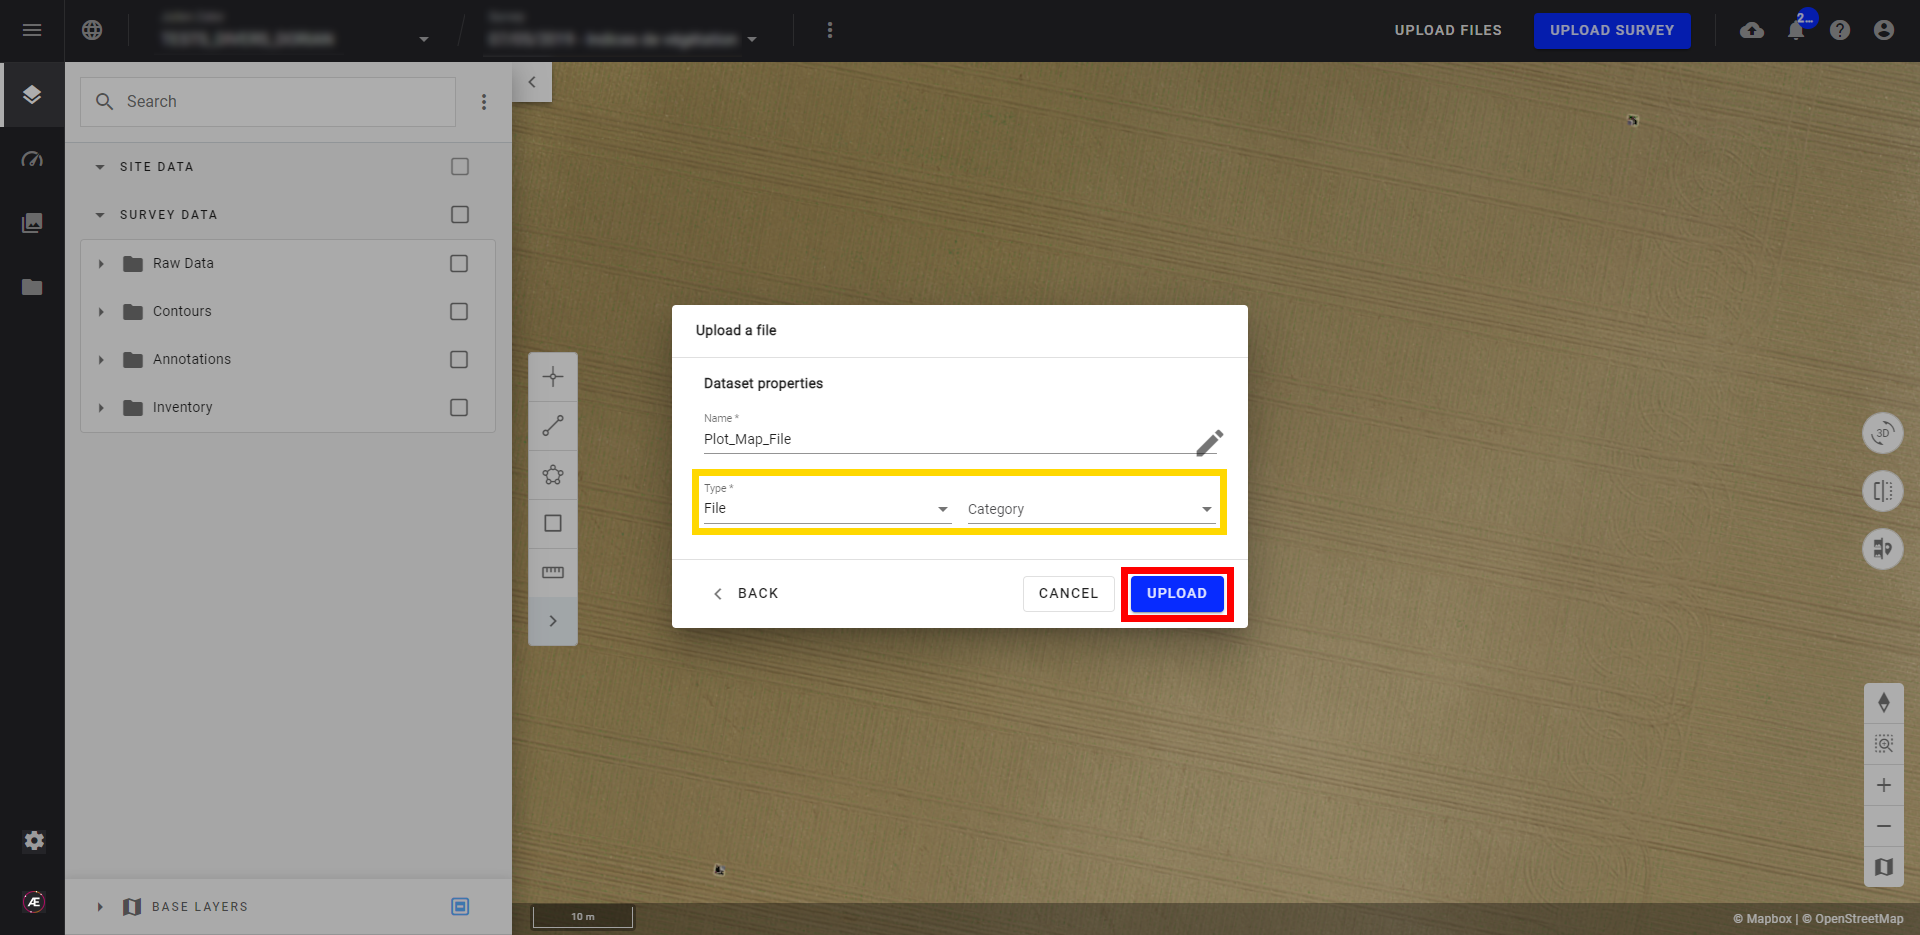
Step 3 - Edit the file name if necessary.
Step 4 - Select the Type "File" and the Category "None".
Step 5 - Select "UPLOAD".
Step 6 - Once uploaded, files are stored and available in the downloads section.
3.2 Launch "Microplot digitization"
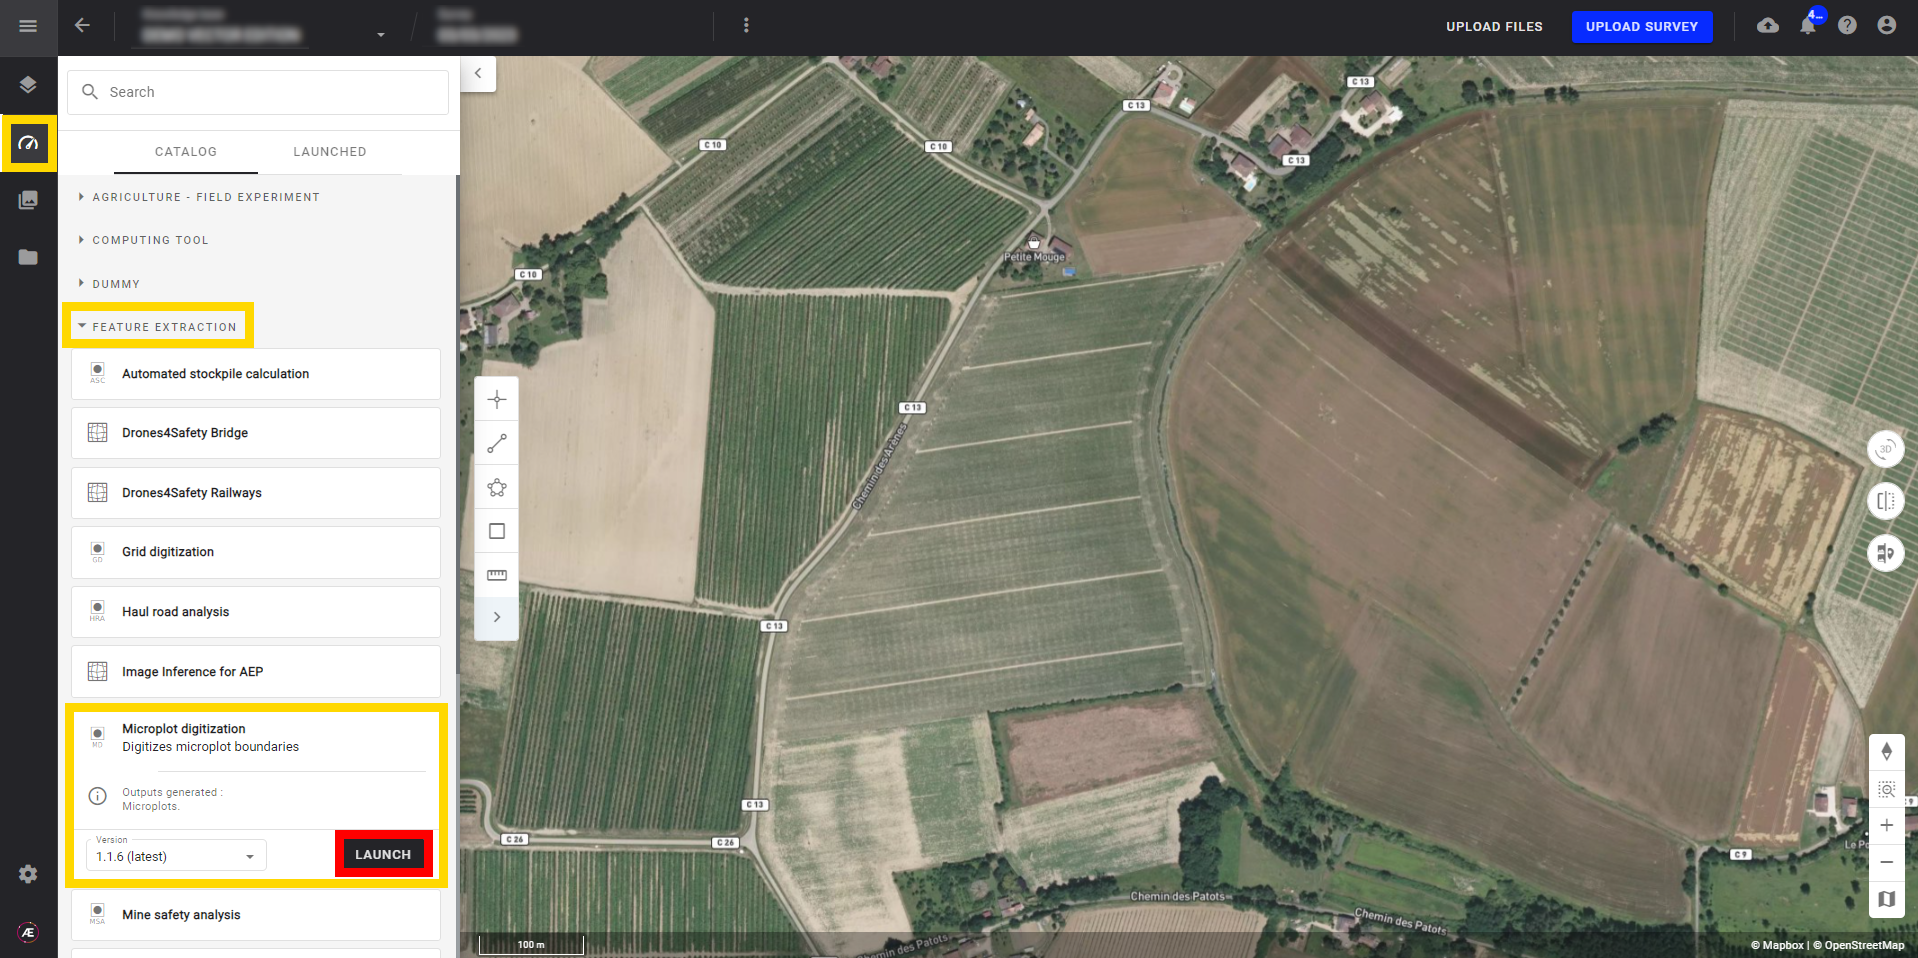
Step 1 - Once all the necessary files are uploaded to the project, search and select from the "Tools" menu "Microplot digitization". Click on "LAUNCH".
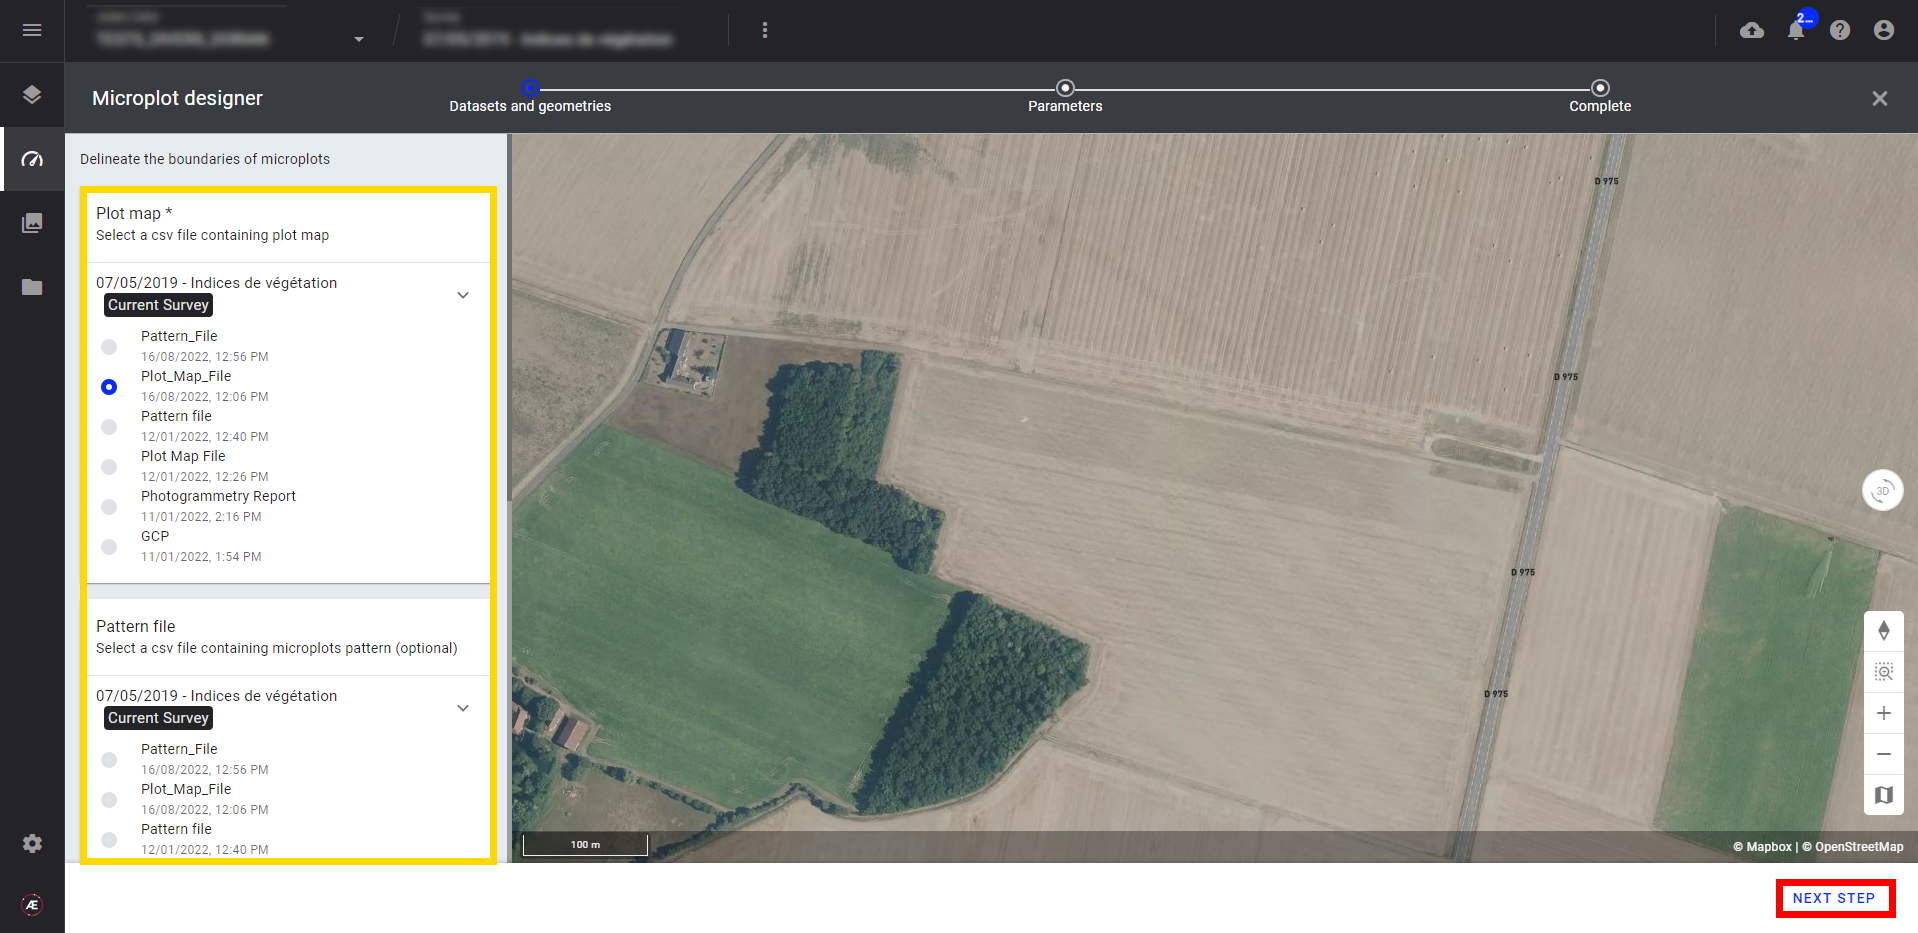
Step 2 - In the next panel, you can select the input files. Under each corresponding section, select the plot map file (required), pattern file (optional), and field position (optional) files. Then select "NEXT STEP".
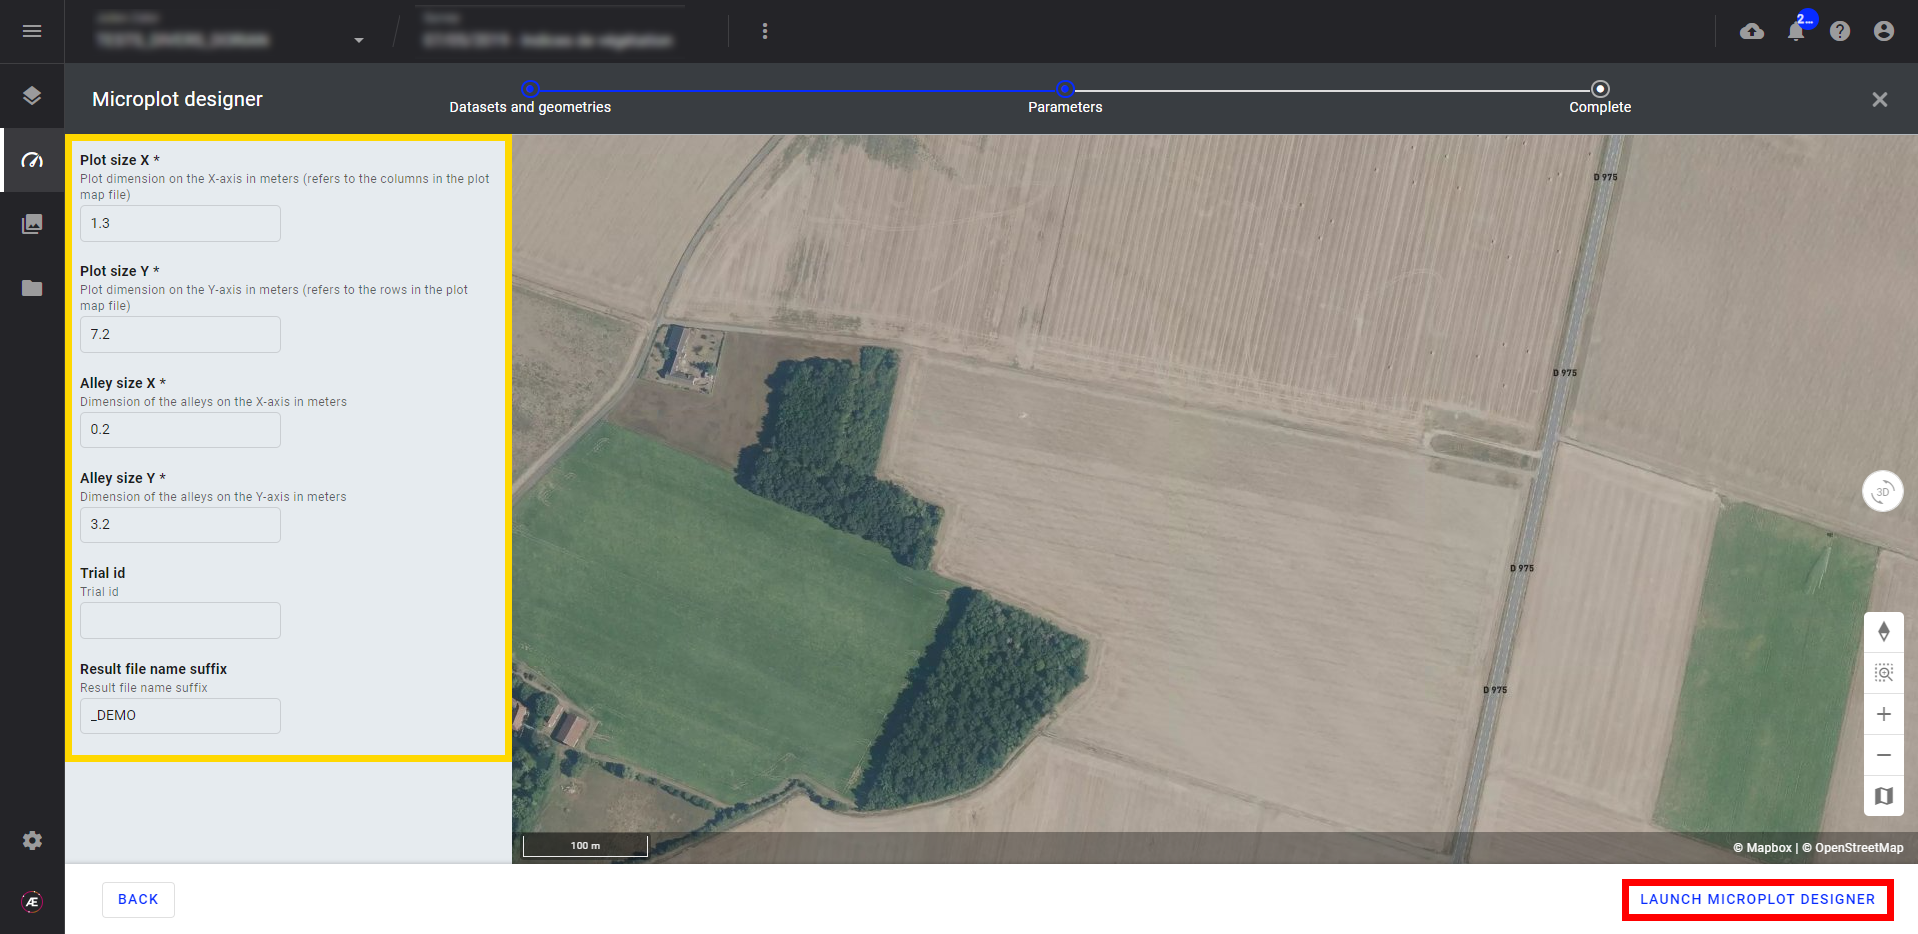
Step 3 - On the next page, enter the parameters (in meters). Then, click on "LAUNCH MICROPLOT DIGITIZATION".
| Plot Dimensions | |
|---|---|
| Plot size X | Corresponds to the dimension of the microplot on the X-axis (cf. columns in the plot map file). |
| Alley size X | Corresponds to the dimension of the alley between 2 microplots on the X-axis (cf. columns in the plot map file). The alley dimensions can be equal to 0 (meaning there is no spacing between microplots). |
| Plot size Y | Corresponds to the dimension of the microplot on the Y-axis (cf. rows in the plot map file). |
| Alley size Y | Corresponds to the dimension of the alley between 2 microplots on the Y-axis (cf. rows in the plot map file). The alley dimensions can be equal to 0 (meaning there is no spacing between microplots). |
- The "Trial id" is optional. If filled in, it will create a parent attribute ("md_trial_id") with the indicated trial id for each plot generated.
- Optionally, you can also add a "Result file name suffix" that will add a suffix to the name of the microplot file. This is useful if you have multiple versions you need to delineate between.
If a pattern file is uploaded and selected as an input, the parameters (dimensions) indicated above in the platform will only apply to plots that are not described in the pattern file. Additionally, the alley dimensions can be equal to 0, meaning there is no spacing between microplots.
Once you have input the parameters, select "LAUNCH MICROPLOT DIGITIZATION" (framed in red above).
The process of creating the microplot grid can take several minutes.
3.3 Display microplot grid
To view the newly created microplot vector.
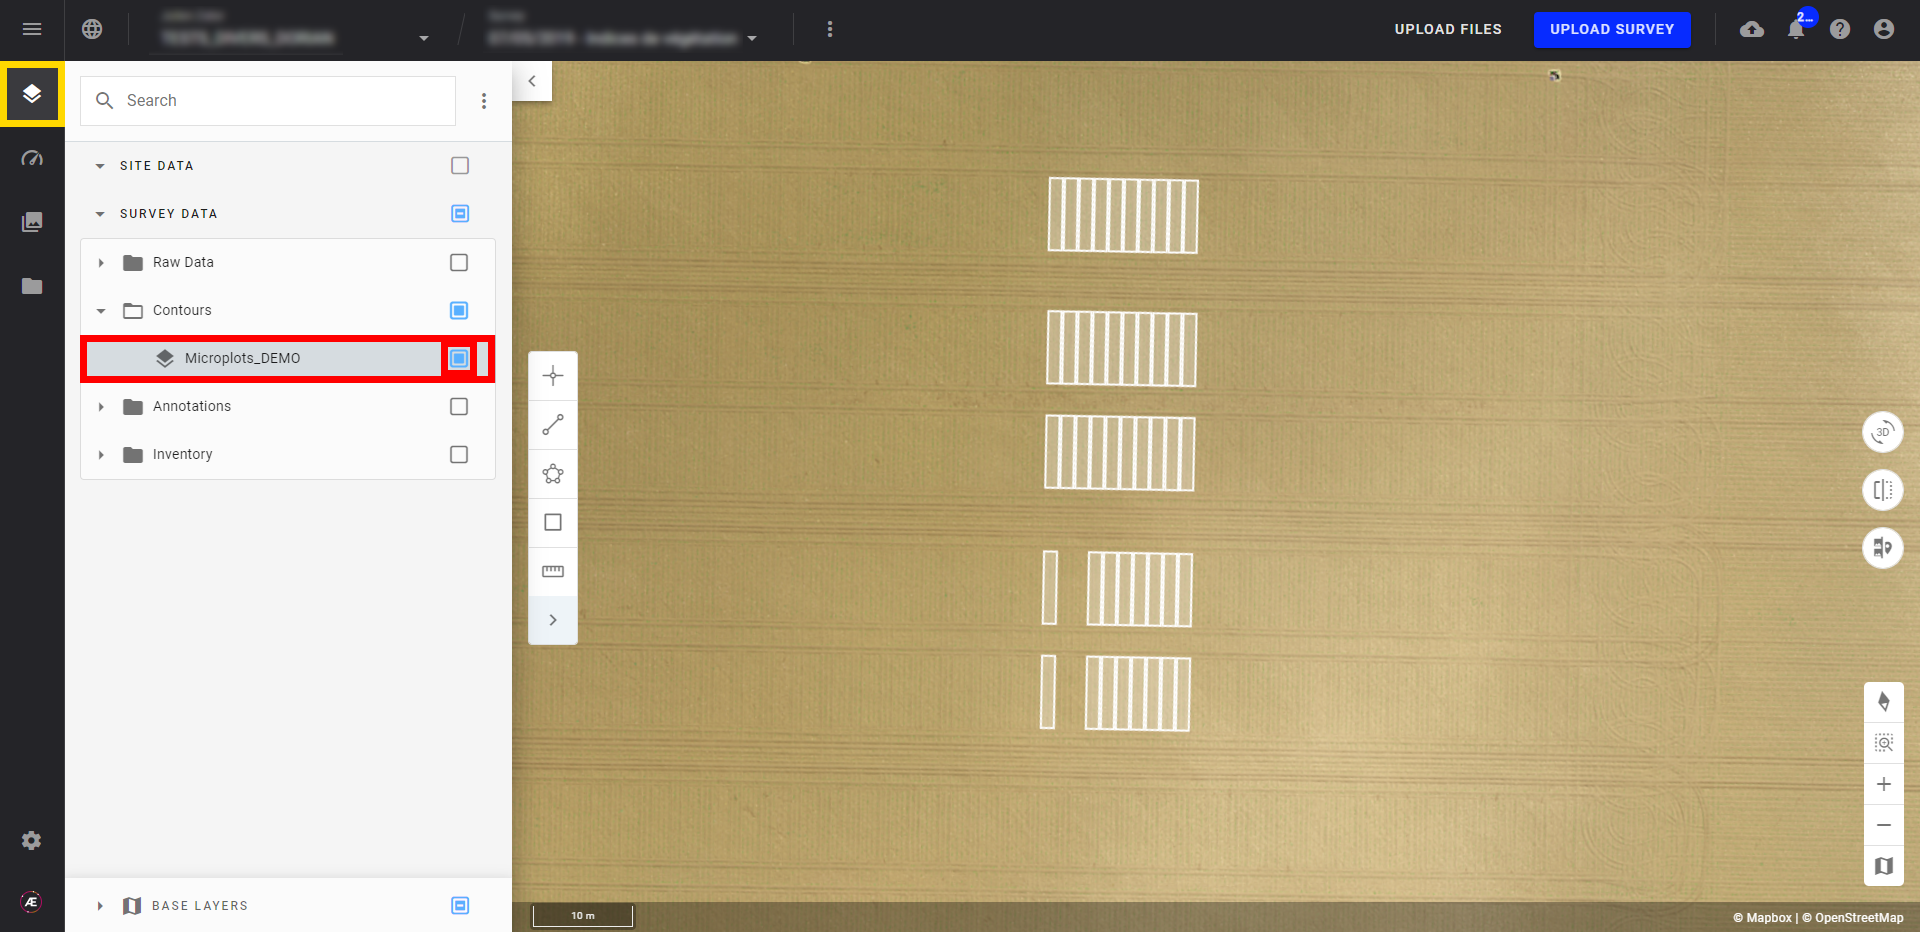
Step 1 - Select the corresponding survey and select the layers icon from the left-hand side.
Step 2 - Select the "Survey Data" folder, "Contours" folder, and "Microplot".
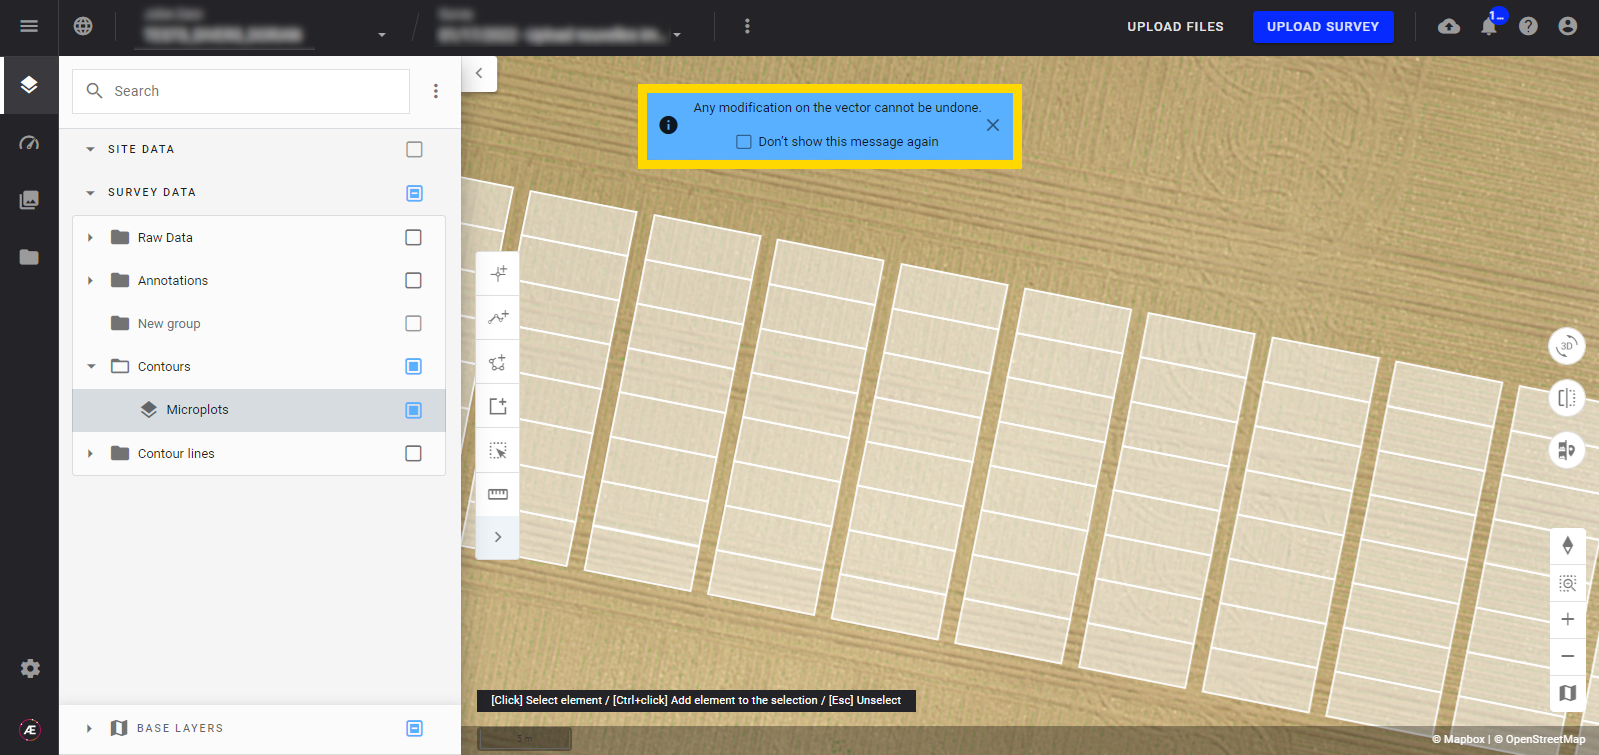
3.4 Adjust the microplot grid
Once the microplot file is generated on the platform, it's possible to adjust the geographic position of the microplots and add custom properties or attributes to them.
For more information, please read the following articles:
- Vector Geometry Edition
- Modify Attributes and Individual Values of a Vector
- Vector Attribute Addition
- Measurement Tool
4. Results
The Microplot digitization will generate a .geojson file with the expected pattern and plot IDs as attributes.
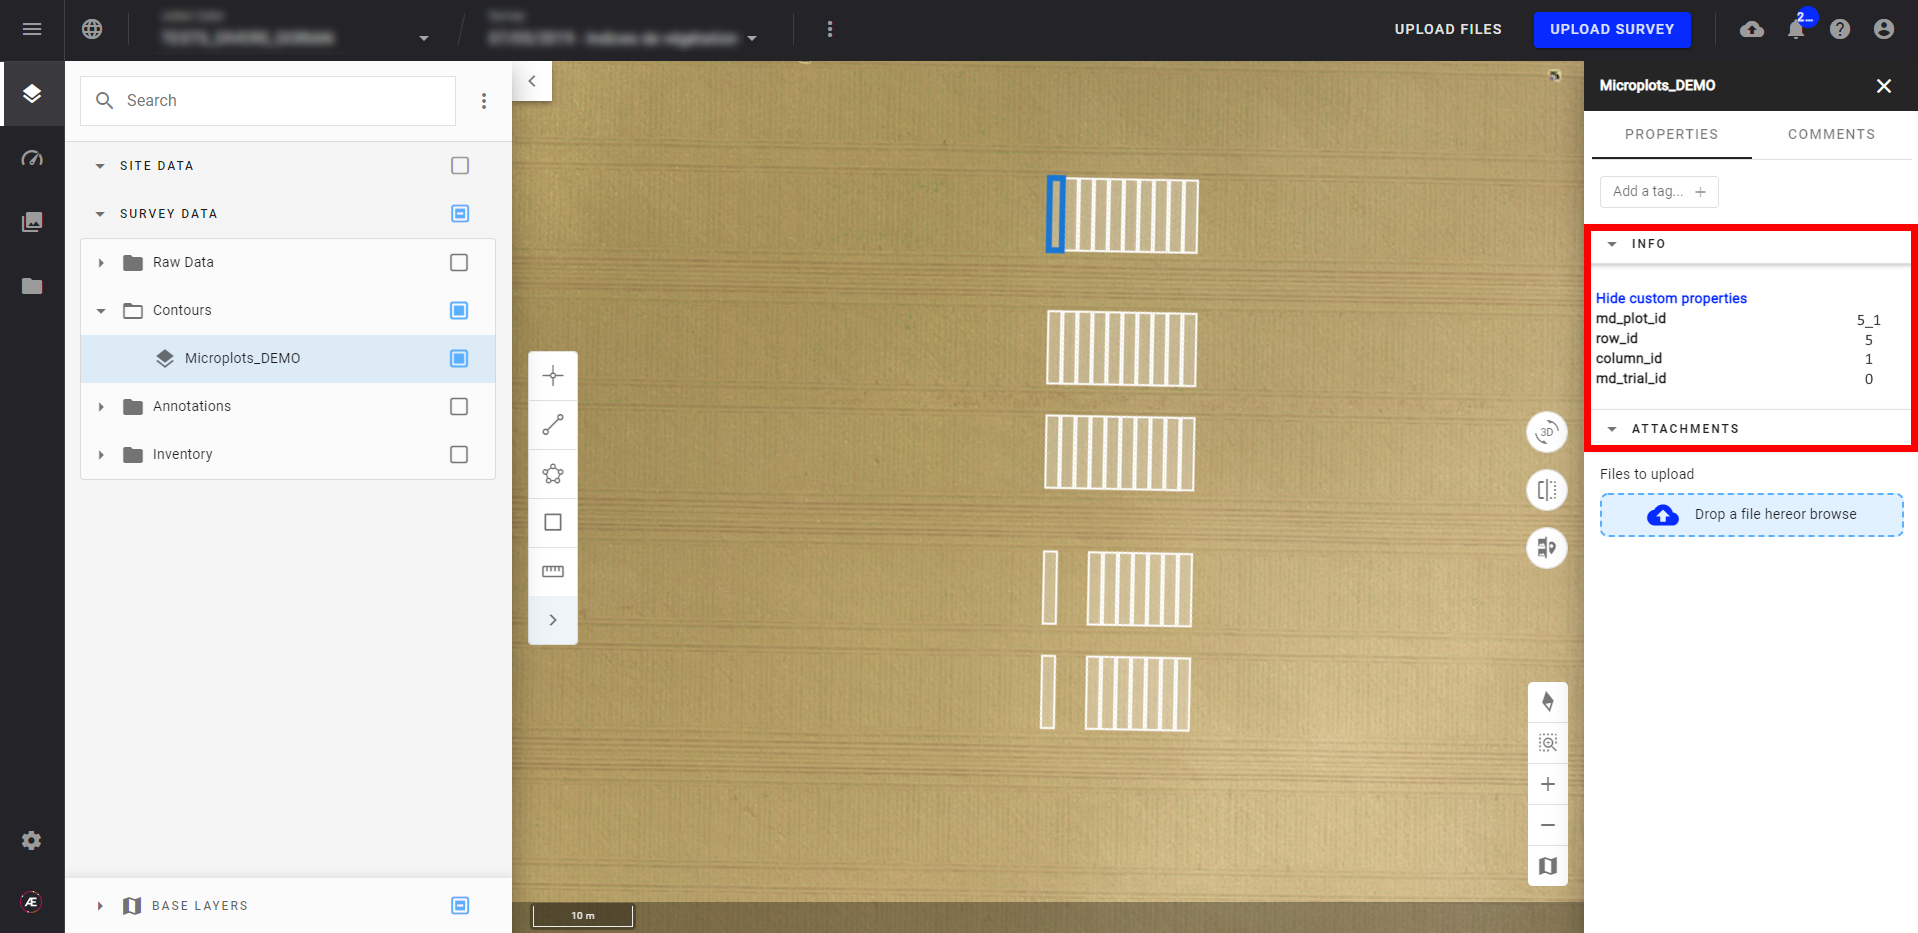
The generated vector file contains these attributes:
| Field | Description |
| md_plot_id | Plot identifier from Plot Map File input. |
| row_id | Row (Y) id from Plot Map File input. |
| column_id | Column (X) id from Plot Map File input. |
| md_trial_id | Trial identifier (optional). Is defined in the Microplot digitization analytics. |
5. Deliverables
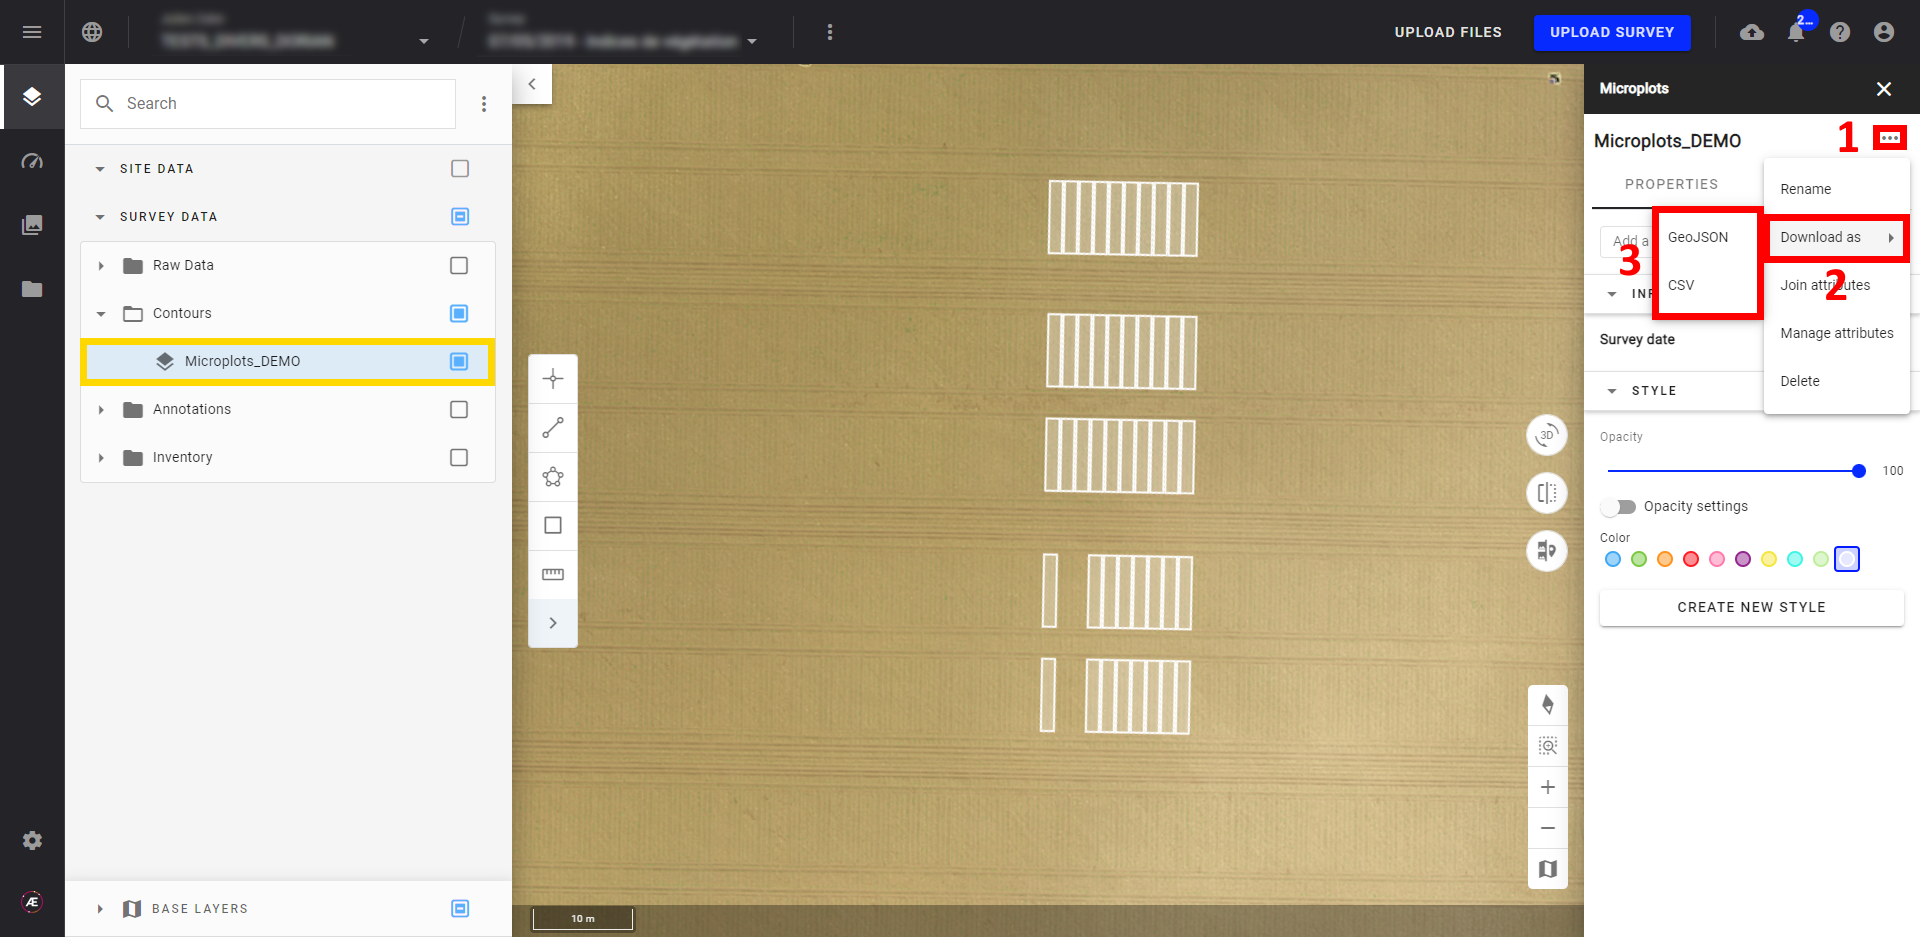
There are two options for exporting the microplot file, one for exporting the file with added adjustments and attributes and one for downloading the original microplot file.
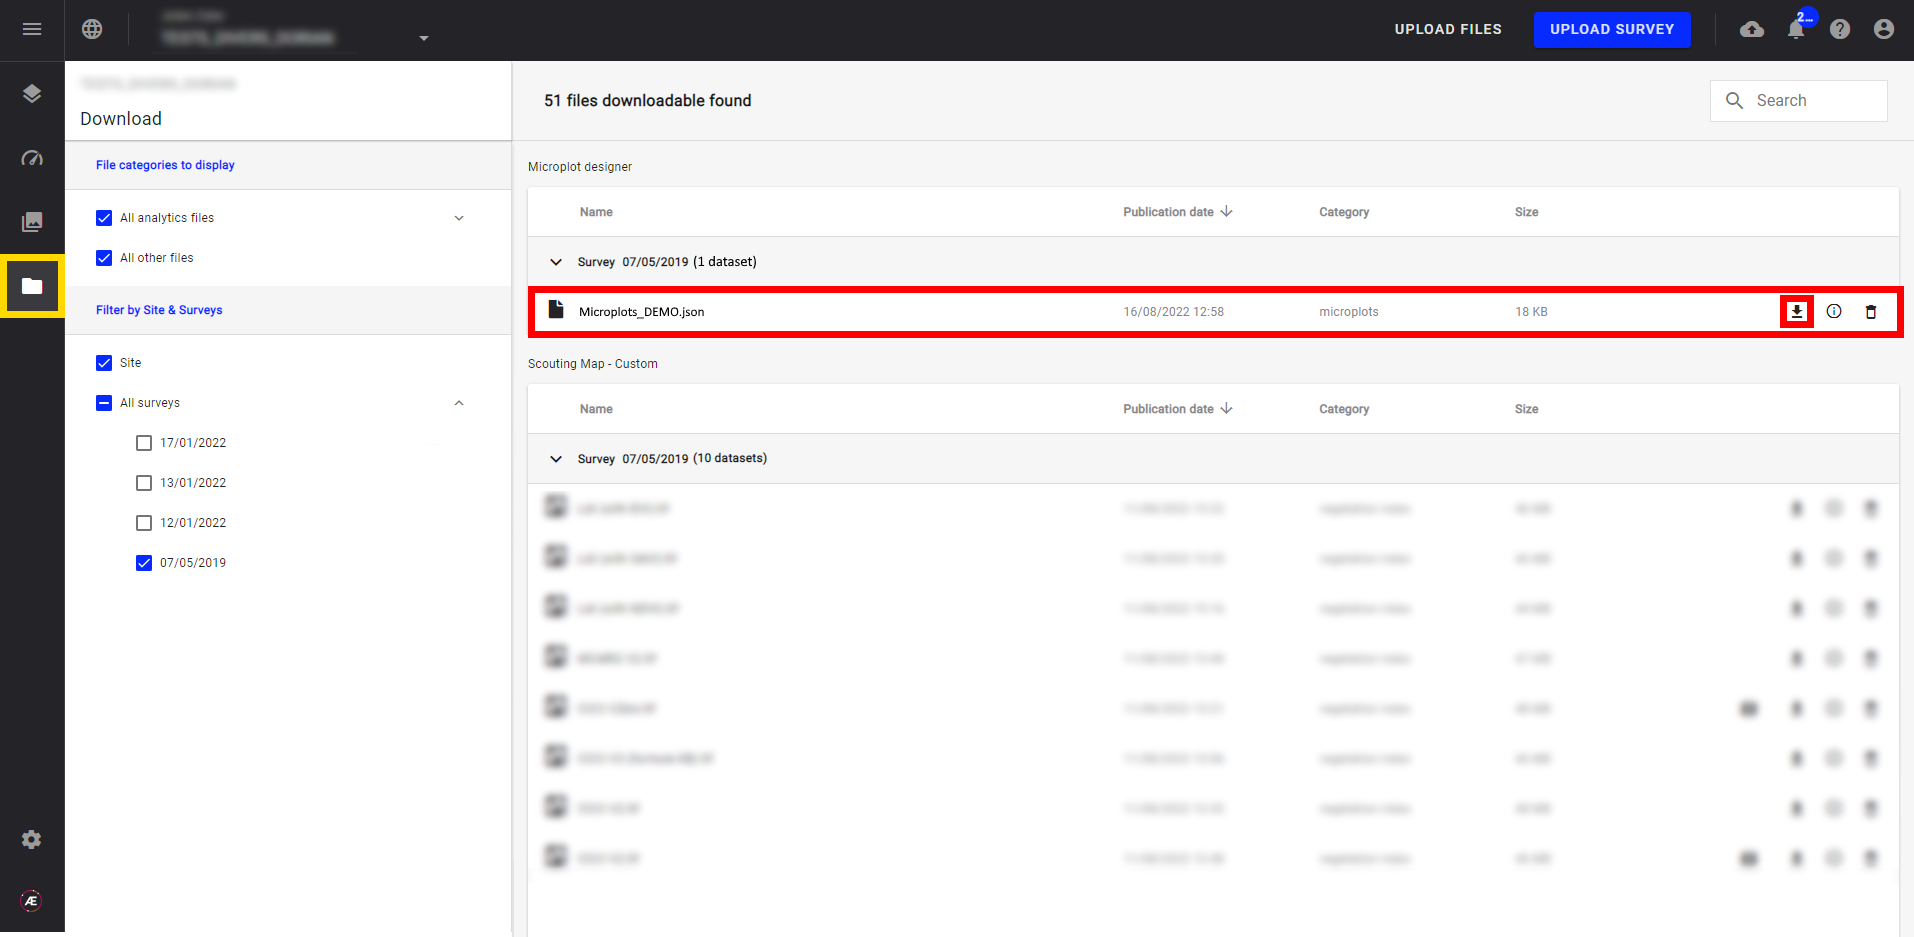
- To download the adjusted file, click on the name of the layer to open the information panel on the right-hand side. Select the three-dot menu (1) and select "Download as" (2). Then, select the "GeoJSON" format (3).
- To download the original microplot file, select the file icon from the menu on the left-hand side. Then, search for the file and select the download icon to the right of its name.