Browsing and Arranging Layers
1. Description
The layer menu within Aether enables efficient data organization for all layers linked to your project and survey. Let's look at how to get the most out of this feature.
2. Layers Menu
To display the layer menu:
Step 1 - Select the project and survey you intend to work in.
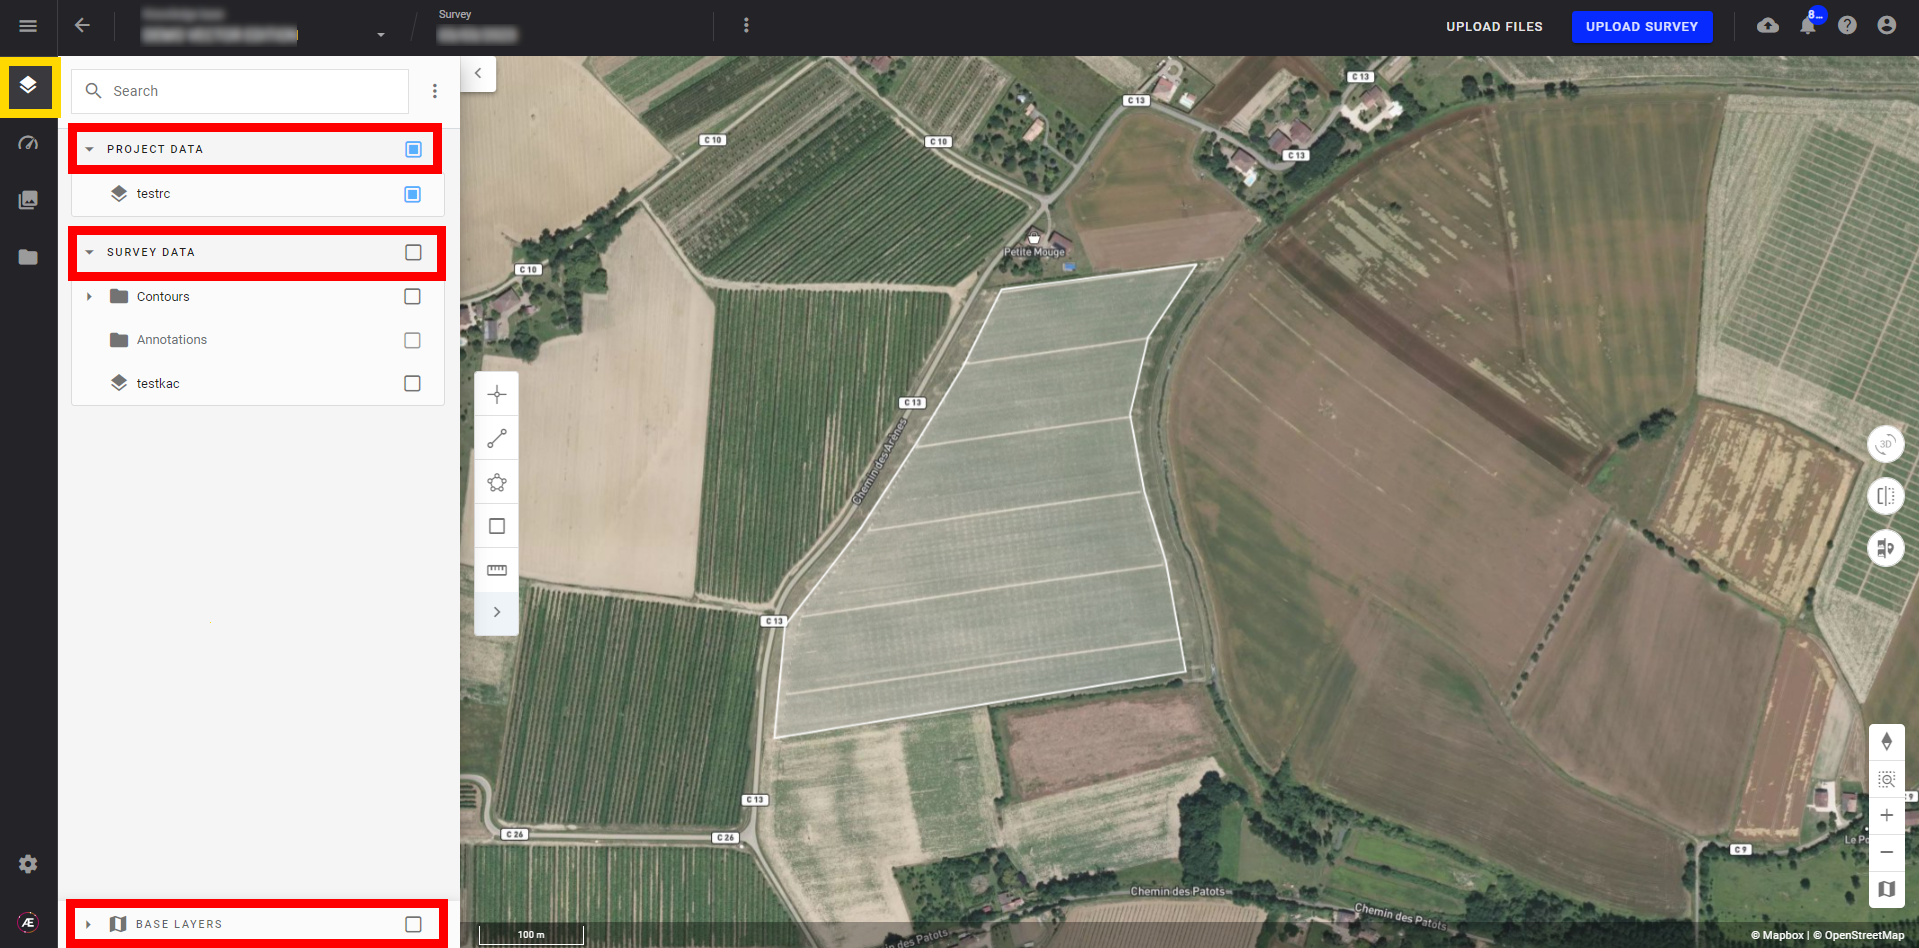
Step 2 - In the menu on the left-hand side, select the layer icon (framed in yellow).
This opens the layers panel. Within this panel, you find three main sections:
- PROJECT DATA
- SURVEY DATA
- BASE LAYERS
2.1 Project Data
Within "PROJECT DATA" you find:
- Data uploaded in the platform at the project level: Vector file, Raster file, 3D data (in 3D view), etc...
- Annotations were created at the survey level but were also linked to the project level.
- Analytic outputs generated in the platform and launched at project level: Vector file, Raster file, etc...
2.2 Survey Data
Within "SURVEY DATA" you find:
- Data is uploaded to the platform at the survey level.
- Annotations were created on a survey.
- Analytic outputs generated in the platform at the survey level: Vector file, Raster file, etc...
2.3 Base Layers
Within "BASE LAYERS" you will find:
- 2D view: this section contains raster data:
- Orthomosaic & DSM / DTM obtained from Photogrammetry processing in Alteia or uploaded in Alteia
- For Agriculture and Forestry surveys, additional layers can be stored here such as the Reflectance Map, Composition Map (RGB, Color-infrared maps), and Spectral Index maps (NDVI, NDRE, MCARI2...)
- 3D view: this section contains the Point Cloud and 3D Model
Info
The main sections are created automatically based on the content within your project. For example, if you create a project with only a KML file, then only the "PROJECT DATA" section will appear. Adding additional information will automatically create the other sections and folders.
3. Display and overlay layers
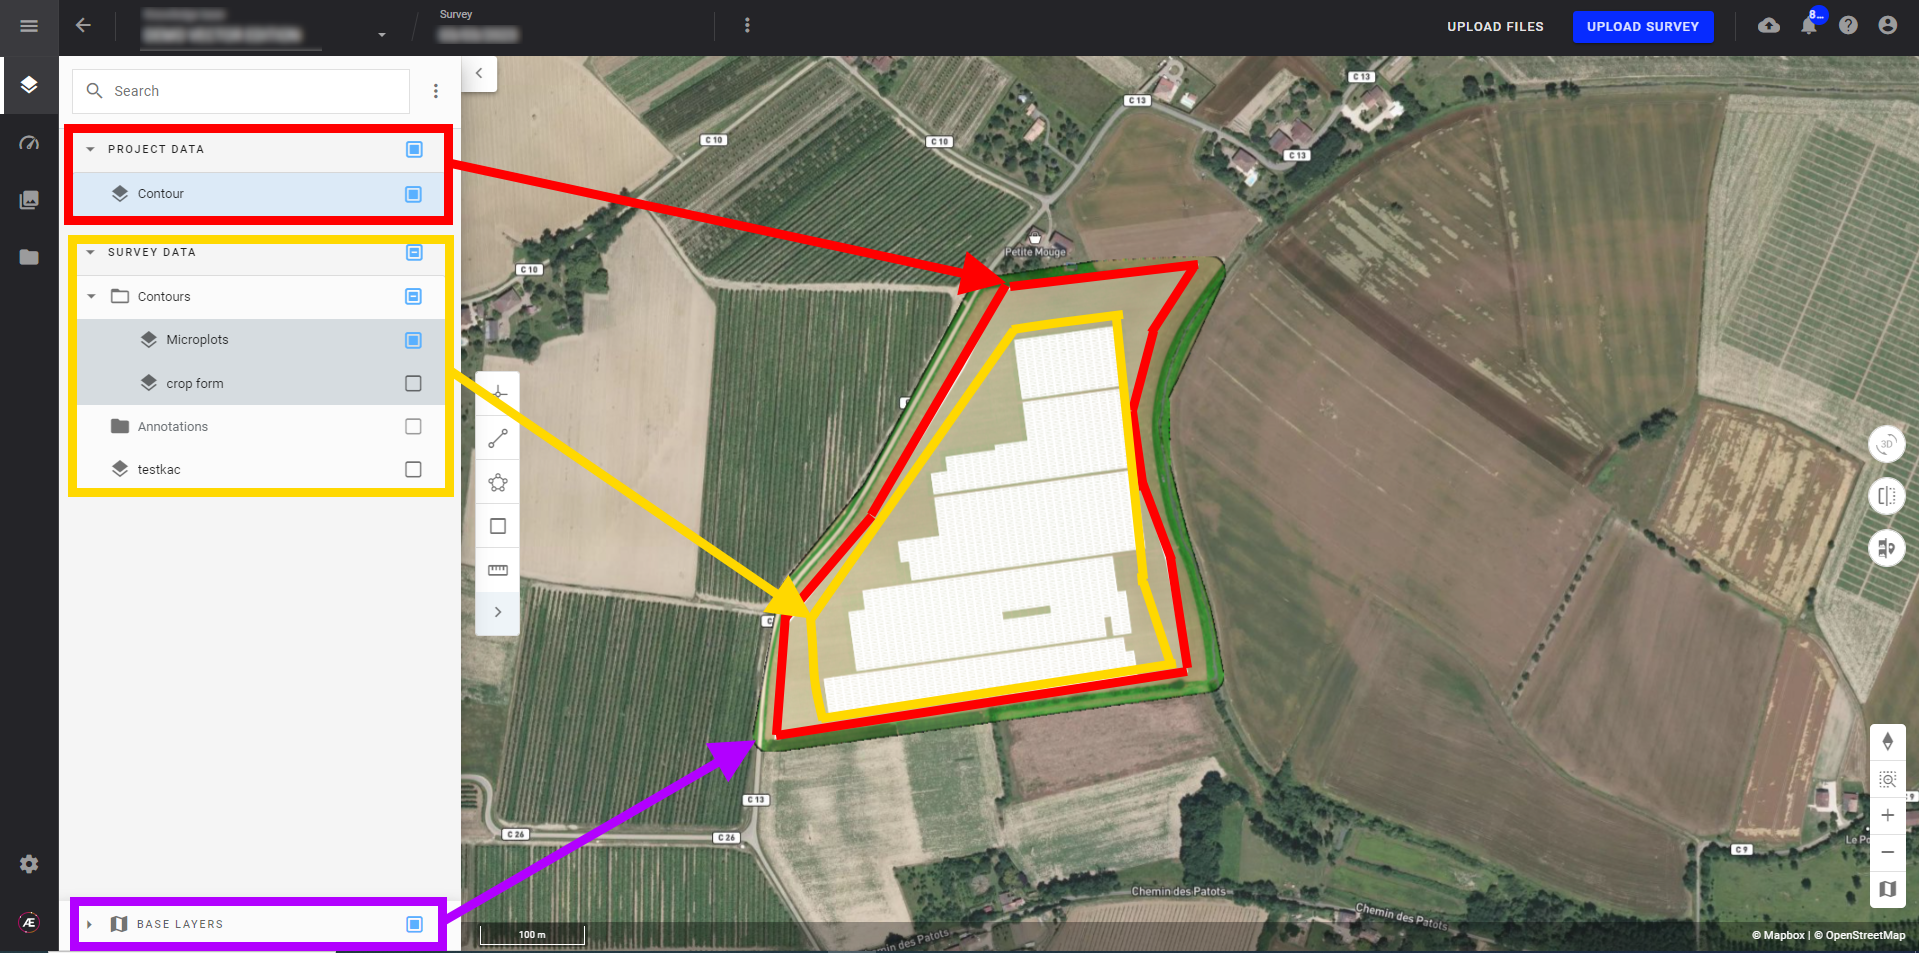
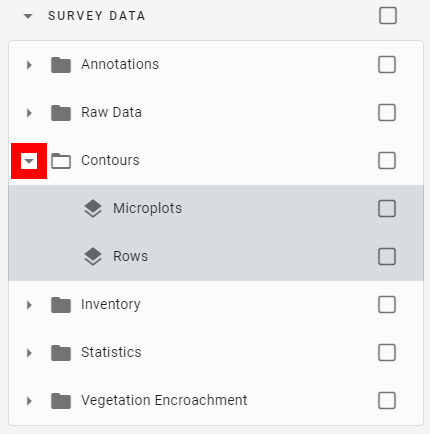
Layers are stored in folders.
- Select the drop-down arrow next to a folder to make the layers inside appear.
- To display a layer, you must check the box to the right of the layer's name. When checked, the box will turn blue.
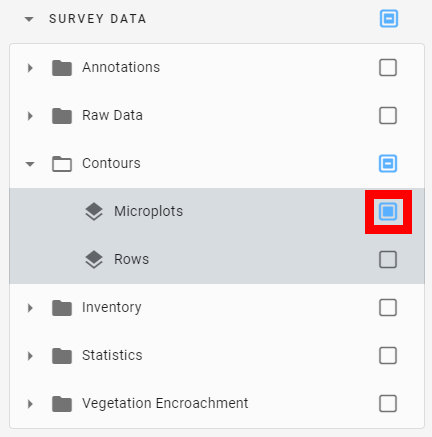
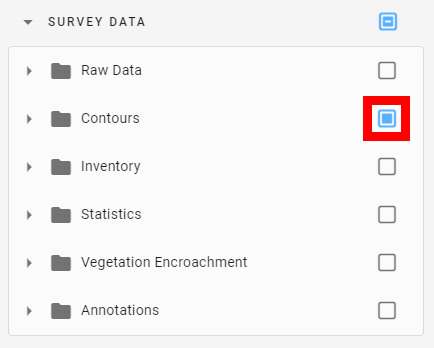
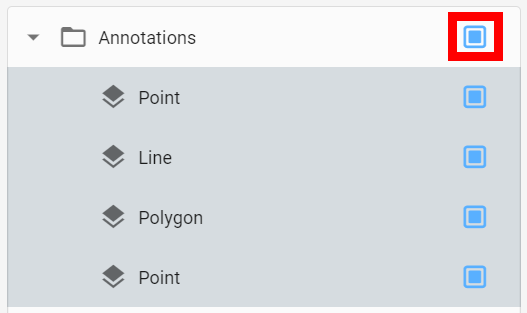
- To display all layers of a folder: Select the box to the right of the folder name.
Info
The selected box will make the corresponding layer appear on top of the other layers. So, for example, a vector layer can easily be overlaid on a raster layer.
4. Create & Edit layer groups
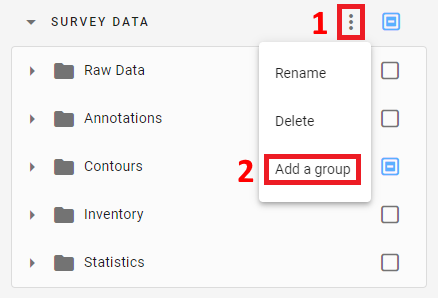
To properly organize various layers and annotations, you can add new groups and subgroups to the default sections:
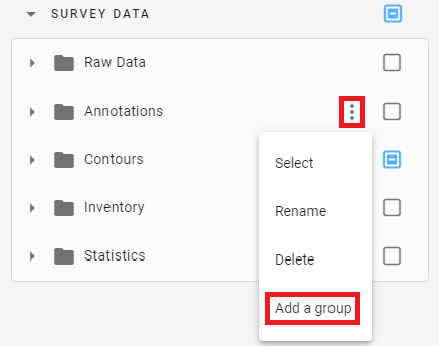
Step 1 - Select the 3 dots menu next to the section (1) or the folder (2) you want to add your group.
Step 2 - Then, select "Add a group".
4.1 At the section level
4.2 At the file level
Via this same 3 dots menu, you can also rename or delete your layers and layer groups.
Info
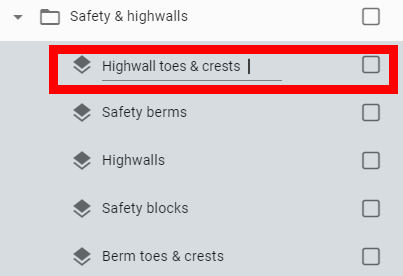
If you want to rename a layer, remember to validate the newly entered name by hitting the ENTER key on your keyboard. Then, the new title becomes underlined and the old layer name will disappear.
5. Rearrange layers
It is possible to move a layer from one group to another.
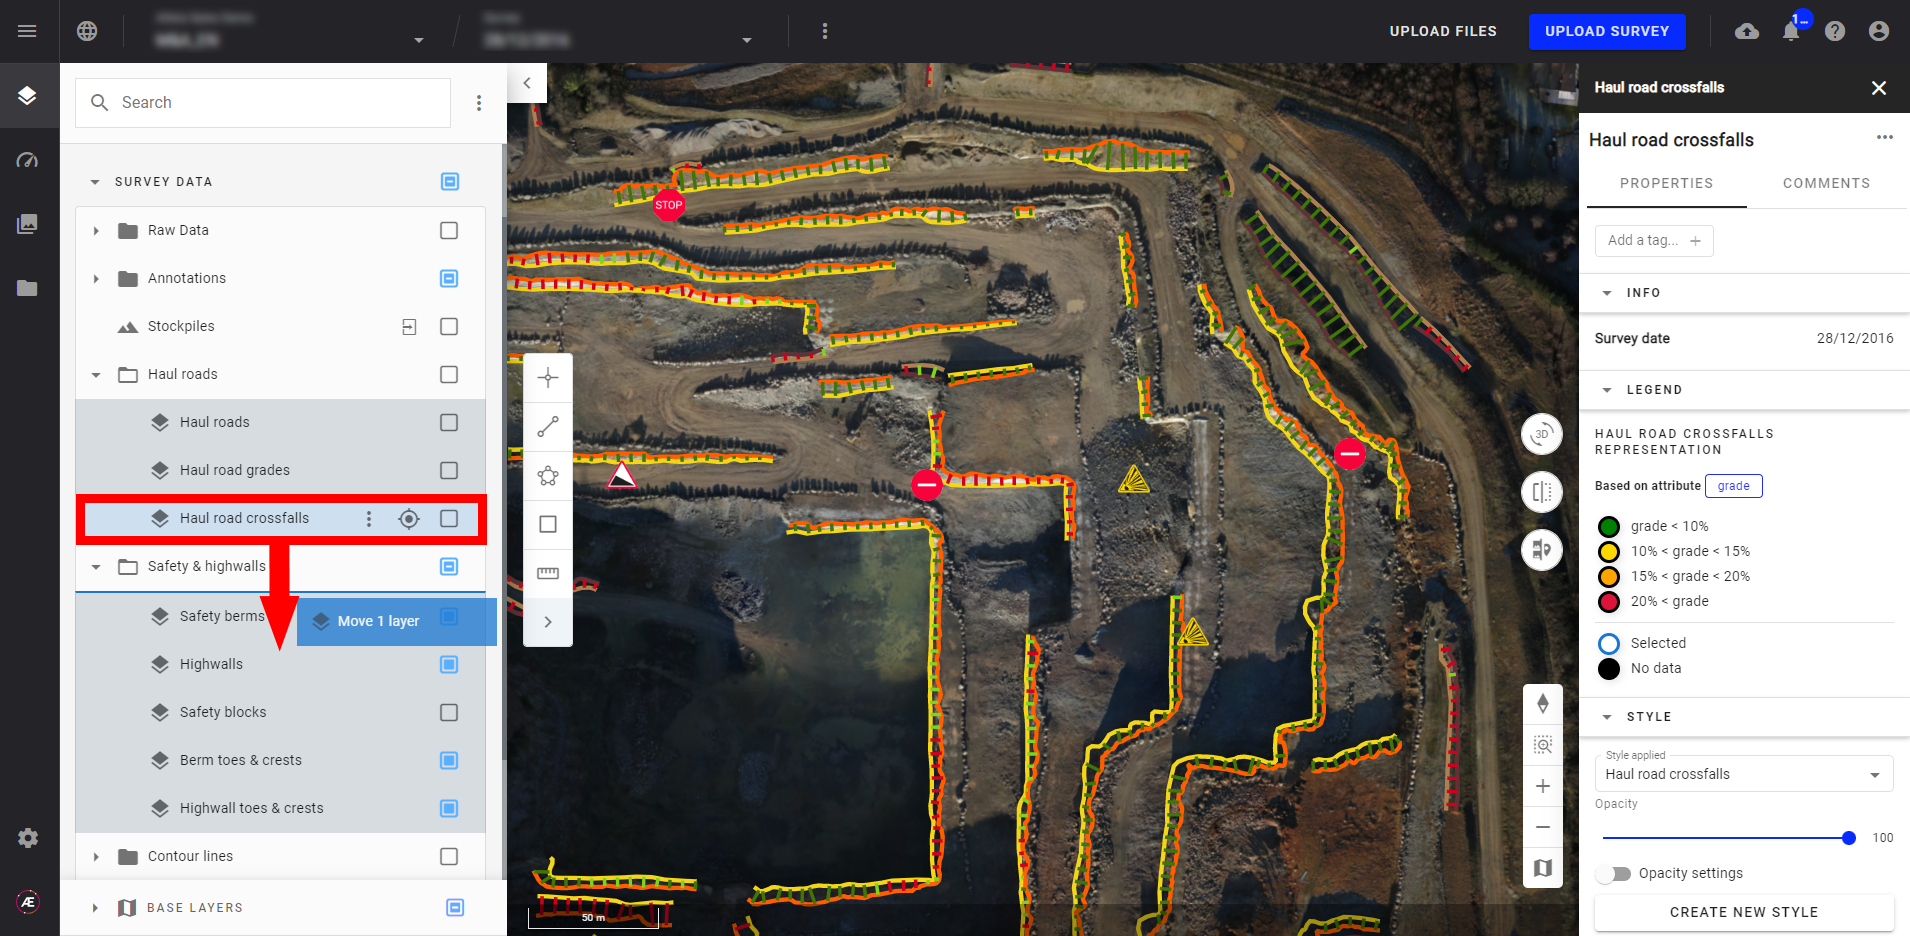
- To move a single layer: Click and drag the selected layer to the desired group and release.
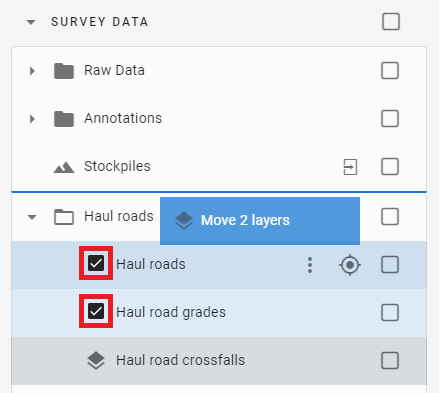
- To move multiple layers or an entire group select the layers or group by checking the check box on the left of the name. Then, click and drag the selected layer to the desired location and release.
Info
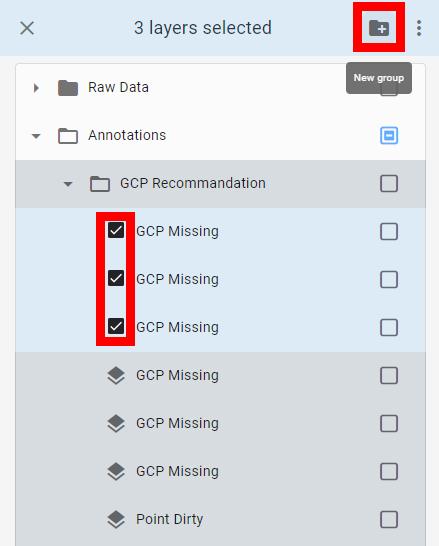
An information blue bar appears just after you check the first layer and indicates how many layers are checked.
- To create a new group from existing layers select the layers you wish to group by selecting the check box on the left of the name. Then, select the folder icon at the top of the menu.
- To attach an annotation from a particular survey to a project, click on the 3 dots menu and then on "Pin to project."
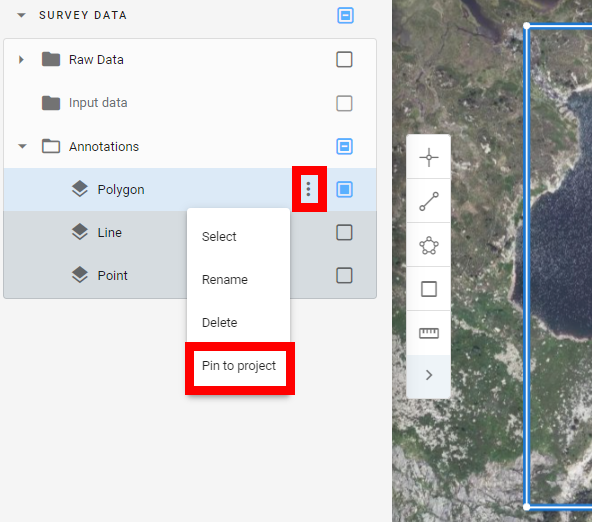
The annotation will be in the "PROJECT DATA" section and will be available on all your surveys.
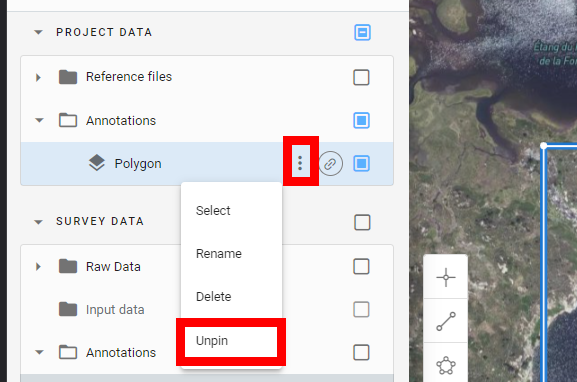
- To unpin it from the project select the 3 dots menu framed in red.
6. Layer panel reset
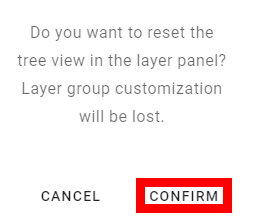
- To reset your layer panel to the original view, select the 3 dots menu from the top of the layer panel and select, "Reset the layout".
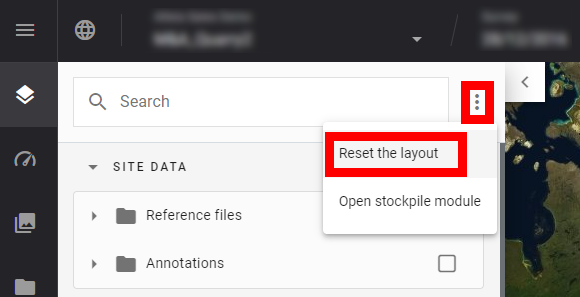
- A warning will pop-up requesting confirmation. Select "CONFIRM".
7. Display advanced layer features
- To access the advanced features of a layer select it by clicking directly on the name.
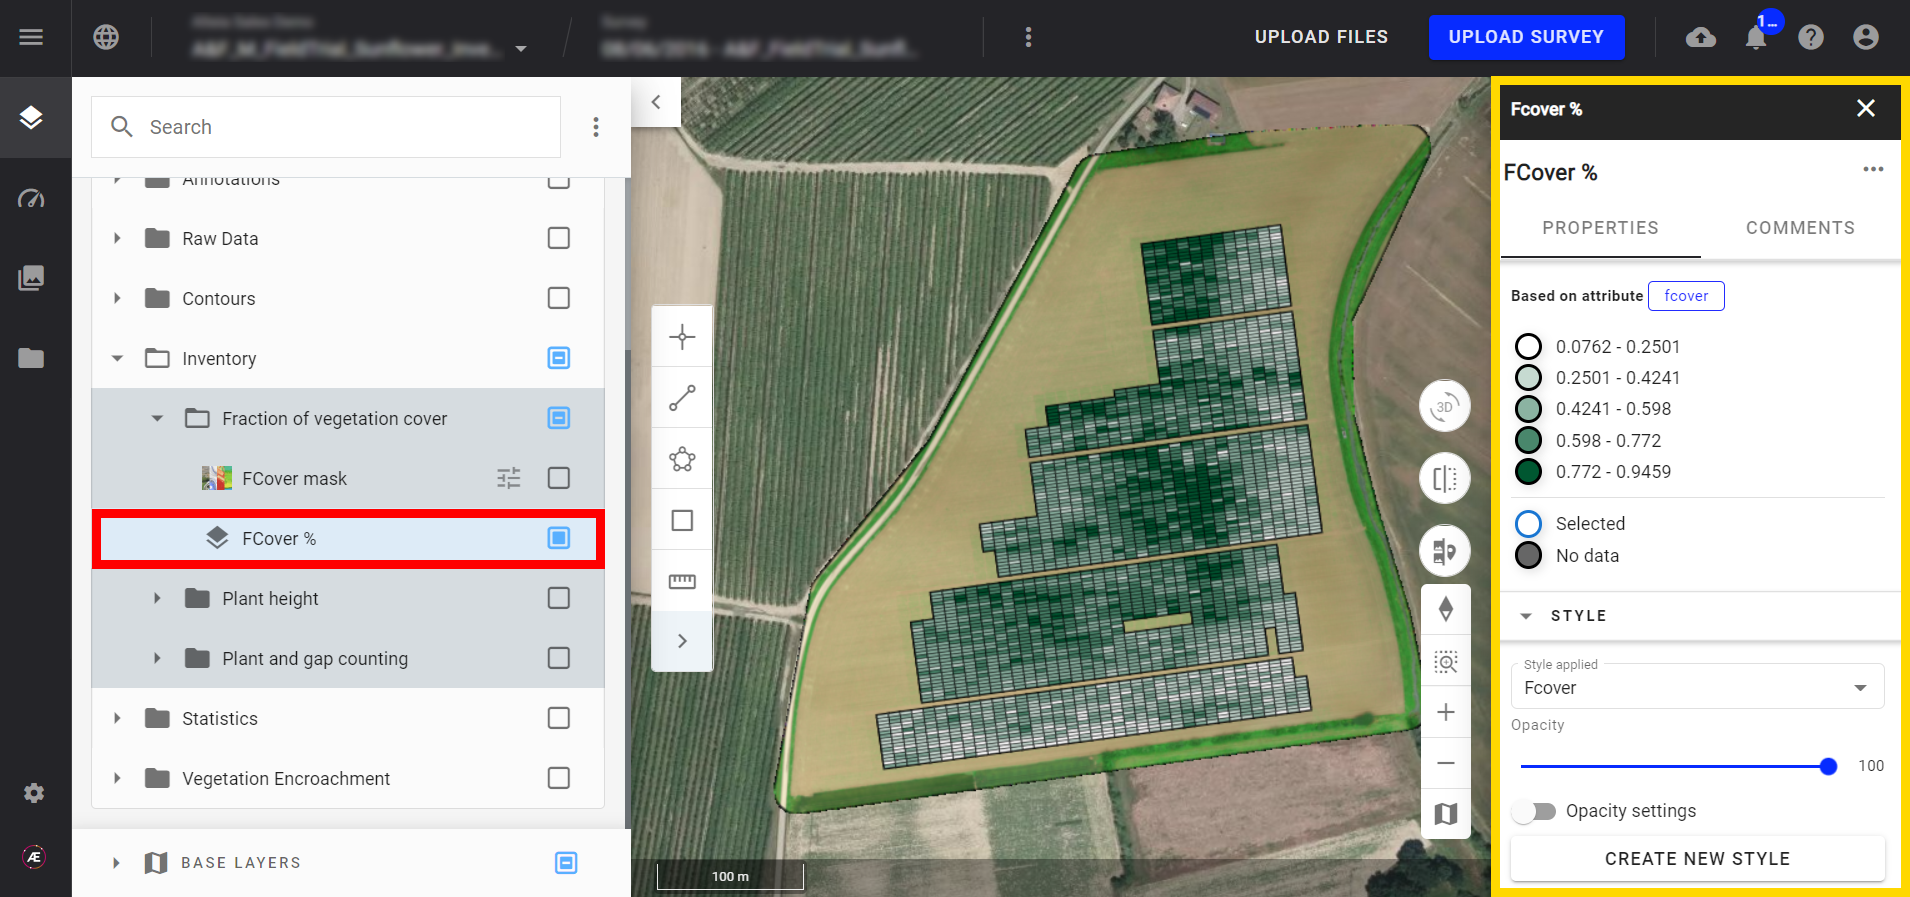
A panel opens on the right, providing access to the adjustable properties of the layer, such as opacity. For more information, see Vector Layers Styling.
The editable fields of the advanced functions of a layer will be different depending on its nature (raster or vector). For raster layers, you can also access the style edition menu via the adjustments icon located next to the layer name.

For vector layers, two other tools are available:
- The first tool (framed in red) allows you to enter the geometry edition mode. For more information see Vector Geometry Edition.
- The second tool (framed in purple) allows you to open the vector attribute edition and filtering module. For more information see Modify attributes and individual values of a vector and Filter tools for vector files

For more information on tools and vector files, see Filter Tools for Vector Files.
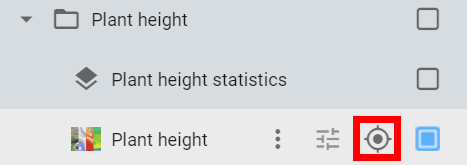
8. Focus view on a layer
To focus your view on any layer at any time, display the corresponding layer by selecting the check box to the right of the name (it will turn blue), and selecting the target icon.