Mine Safety Analysis
1. Description
Mine Safety Analysis enables you to visualize quarry or mine safety features, such as highwalls, safety blocks, and berms conditions.
This analysis identifies whether the site's characteristics comply with the safety standards of the company and the country in which it is located, so that corrective action can be taken if necessary.
2. Inputs
To launch the analytics, the survey needs to have one orthomosaic, one DSM (or DTM) and an Area Of Interest (optional) if you want to compute it on one or several part of your site.
3. Workflow
Step 1 - Go to the Analytics menu within an opened project, search for "Mine safety analysis" and click on "LAUNCH".

Step 2 - Select the inputs (area of interest, orthomosaic and elevation model).
Step 3 - Click on "NEXT".

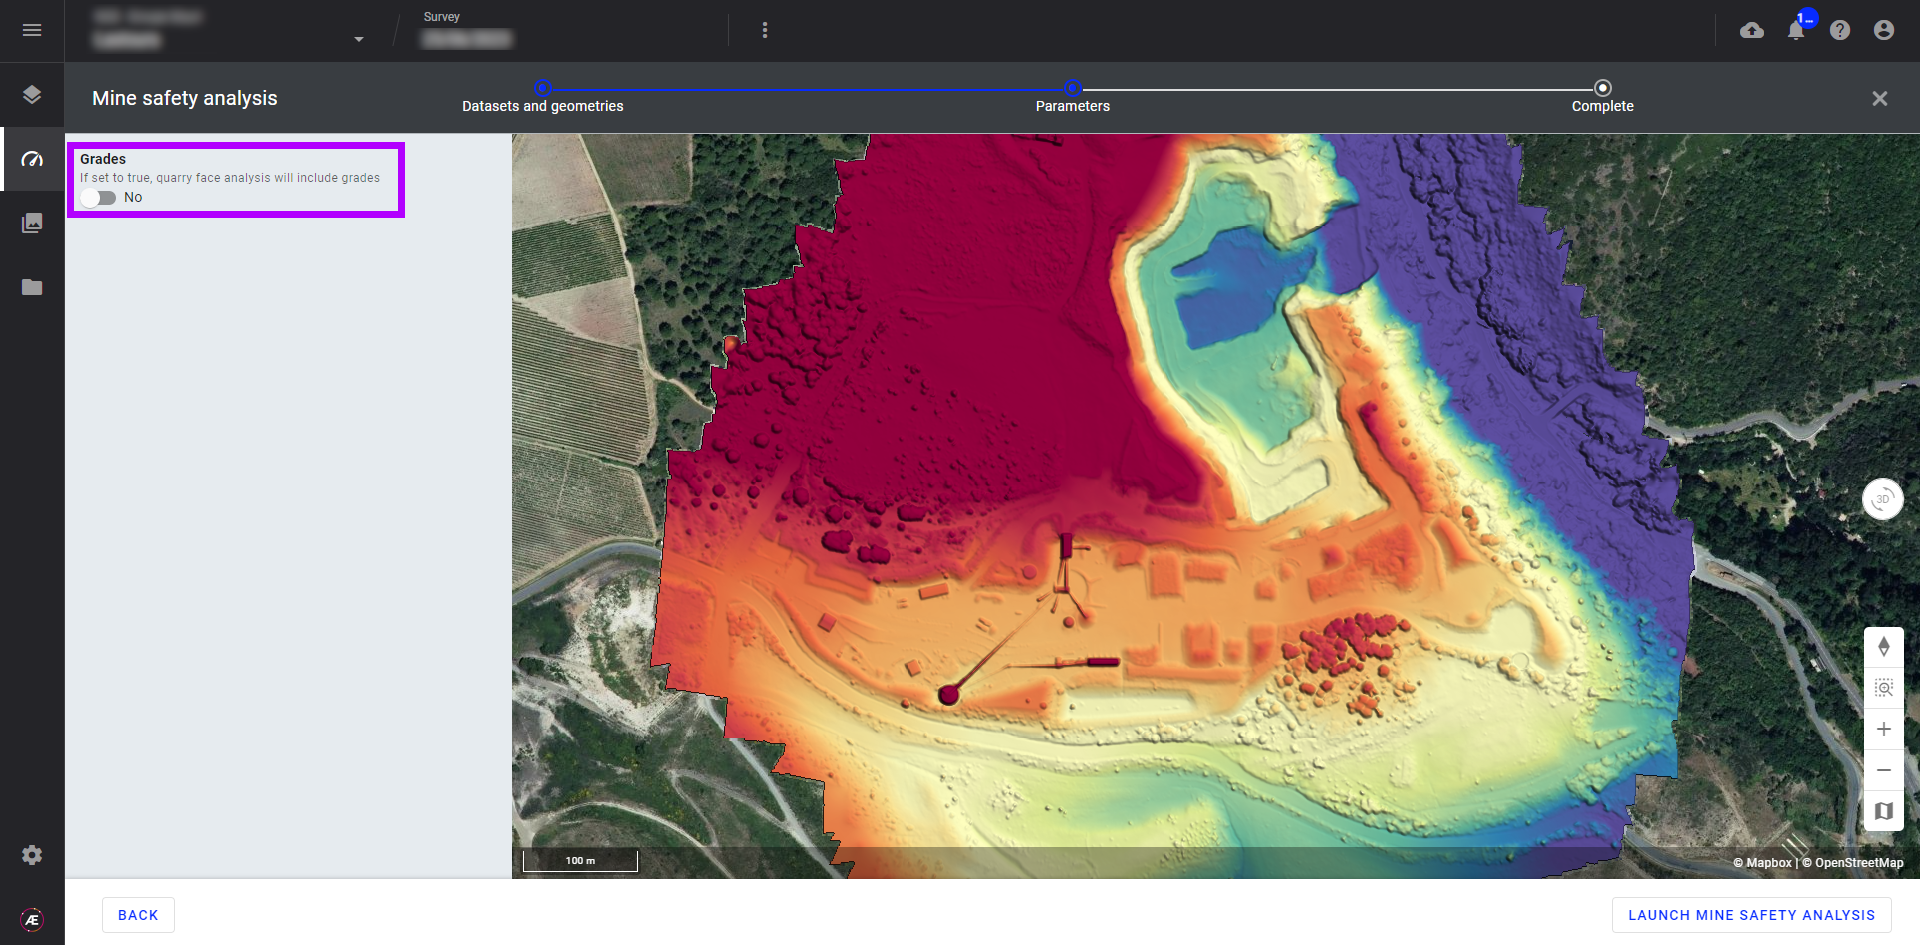
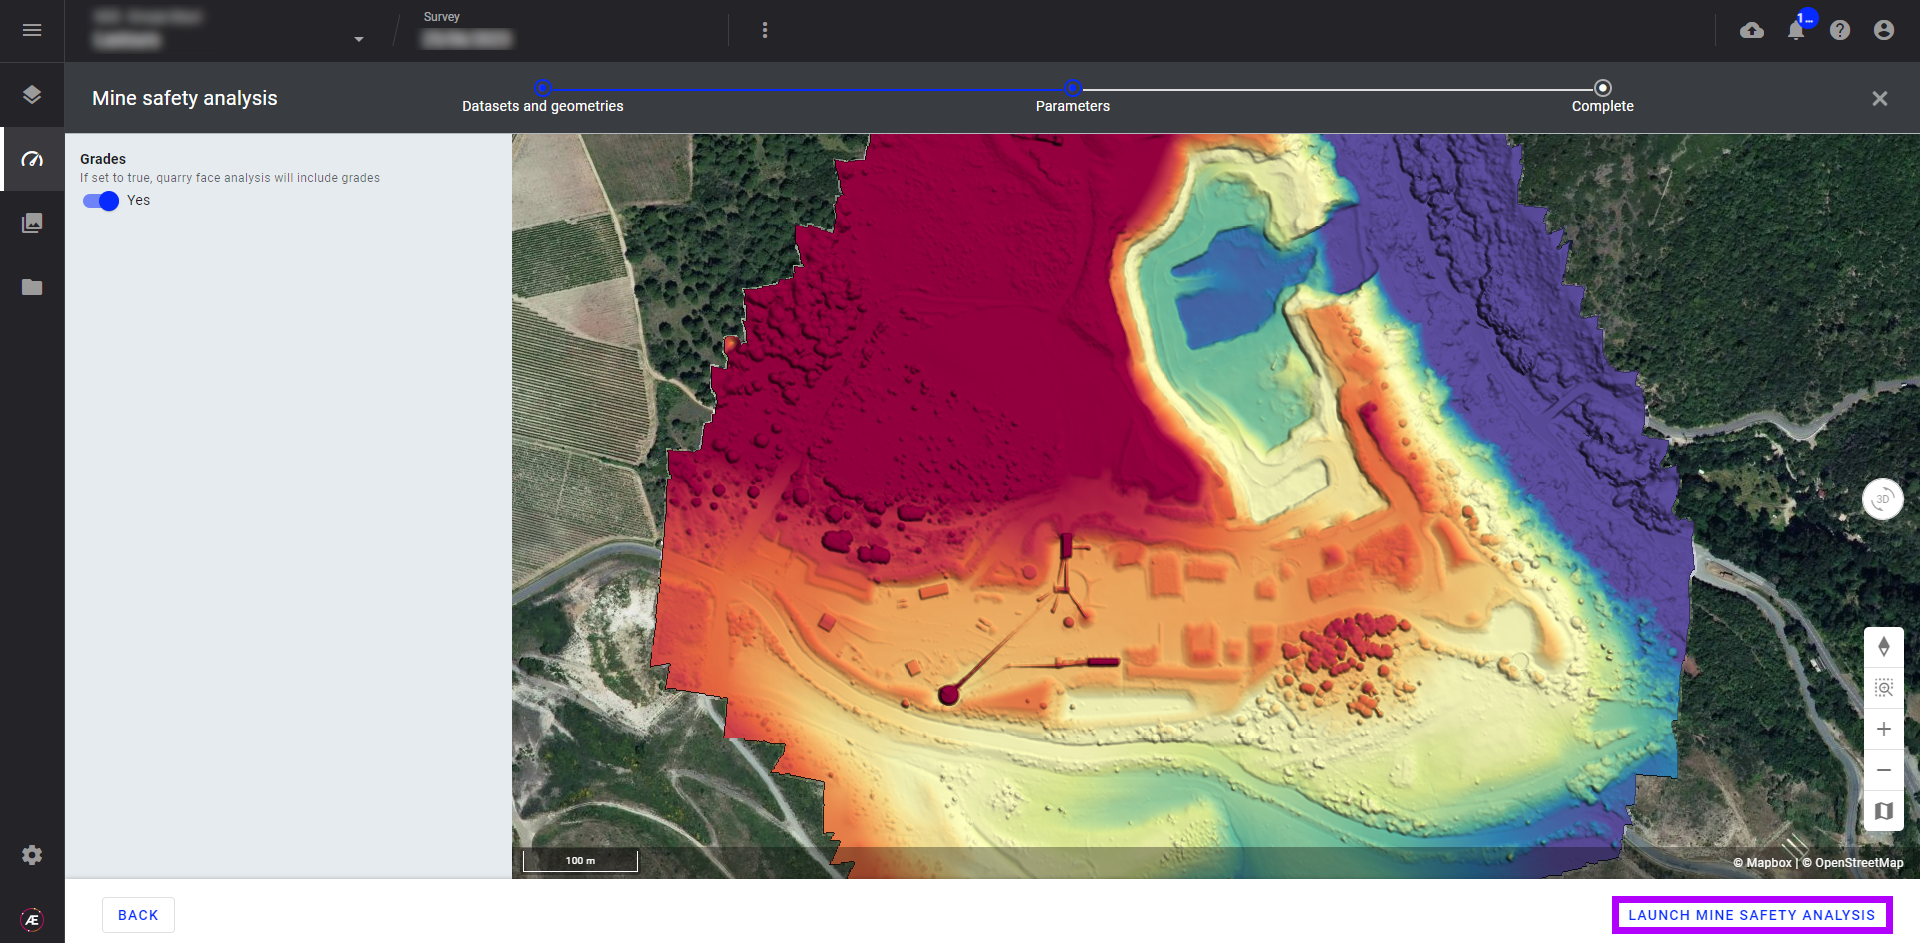
Step 4 - Choose whether or not to include grades in the analysis results.
Step 5 - Click on “LAUNCH MINE SAFETY ANALYSIS”.
4. Results
The following layers are generated from the Mine Safety Analysis:
- Highwall heights, toes, and crests
- Safety block heights
- Safety berm heights, crests, and toes
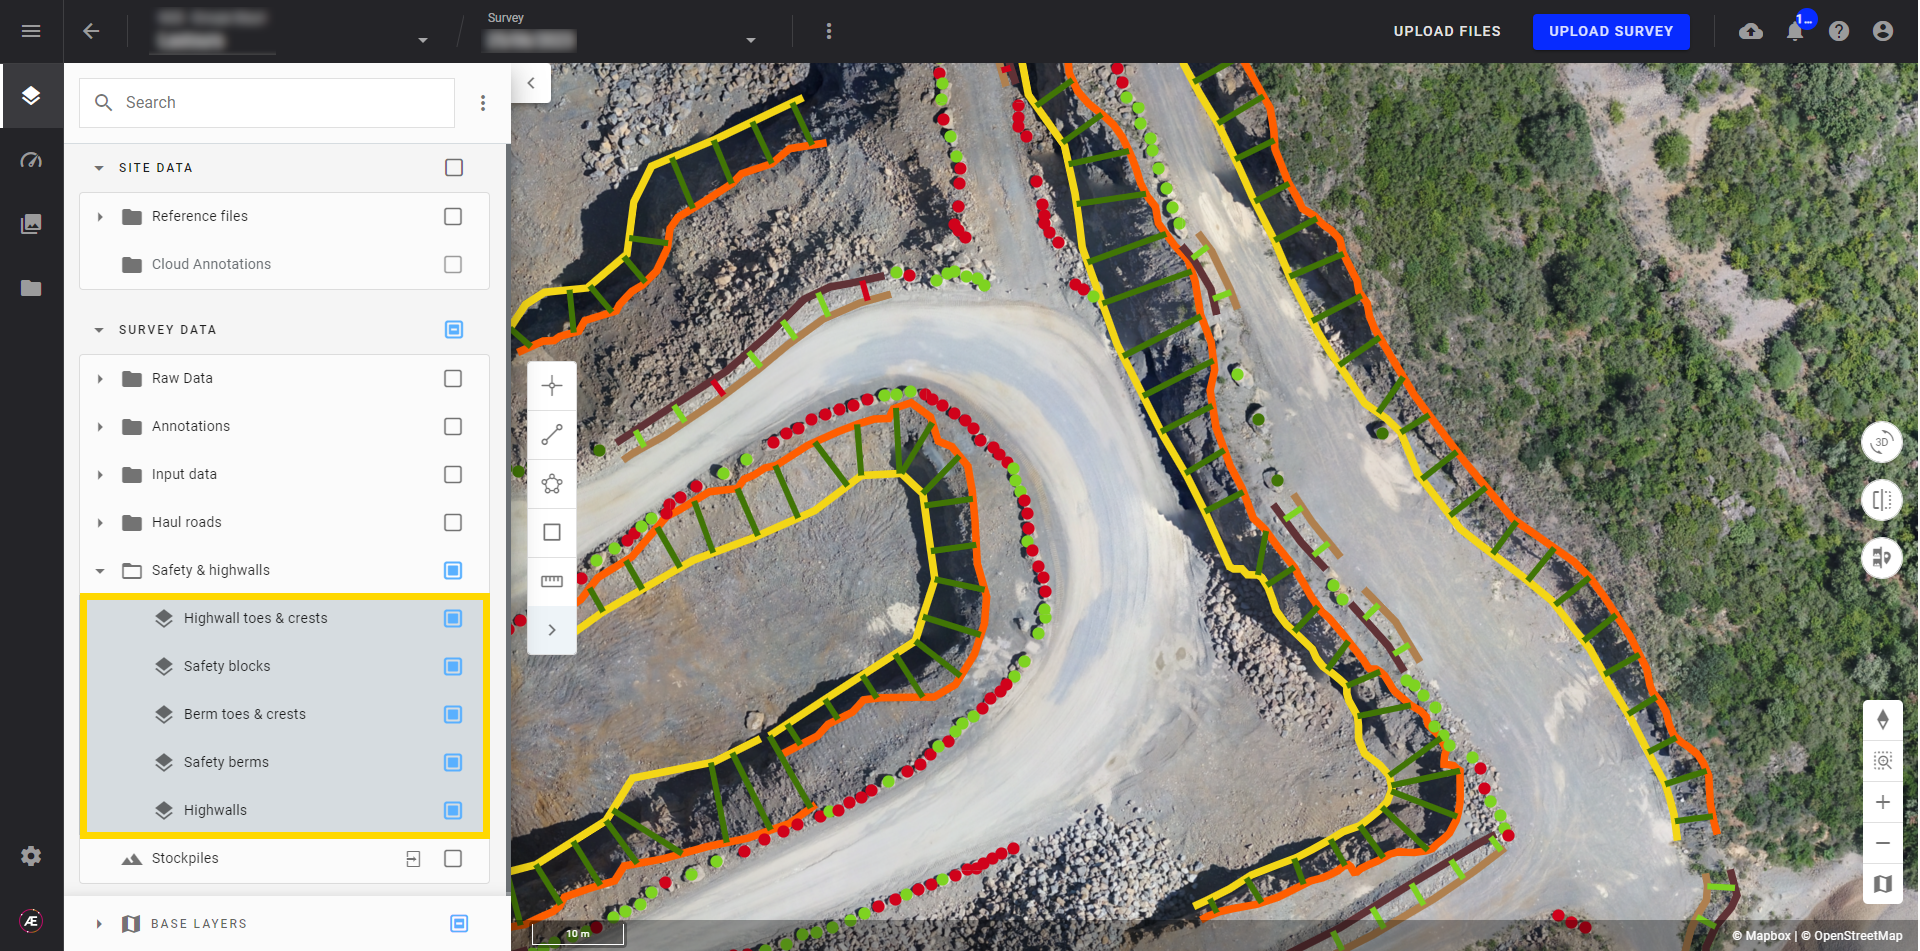
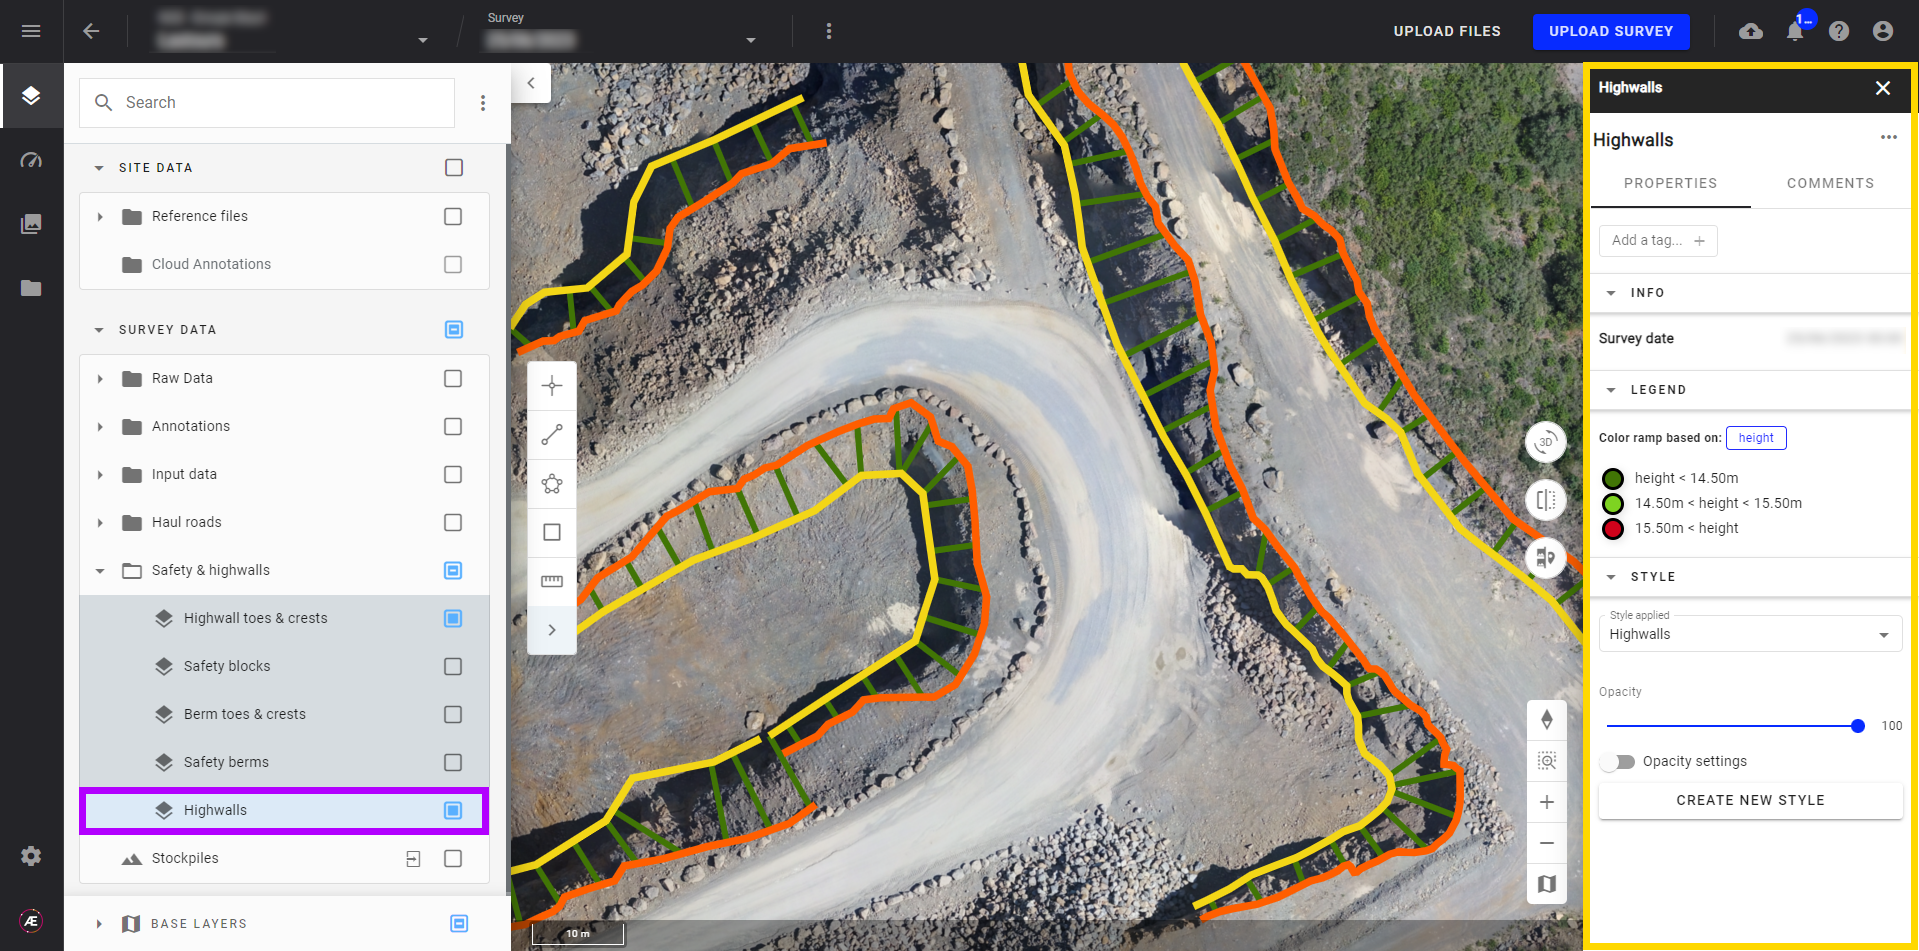
Open the Layer Panel, go to the “Safety & highwalls” folder under “SURVEY DATA”, and select the layers to display on the map.
By clicking on the desired layer, an information panel opens on the right. Properties are then displayed with relevant information about the layer.
You can then apply a different style to the generated layers. See Vector Layers Styling for more information.
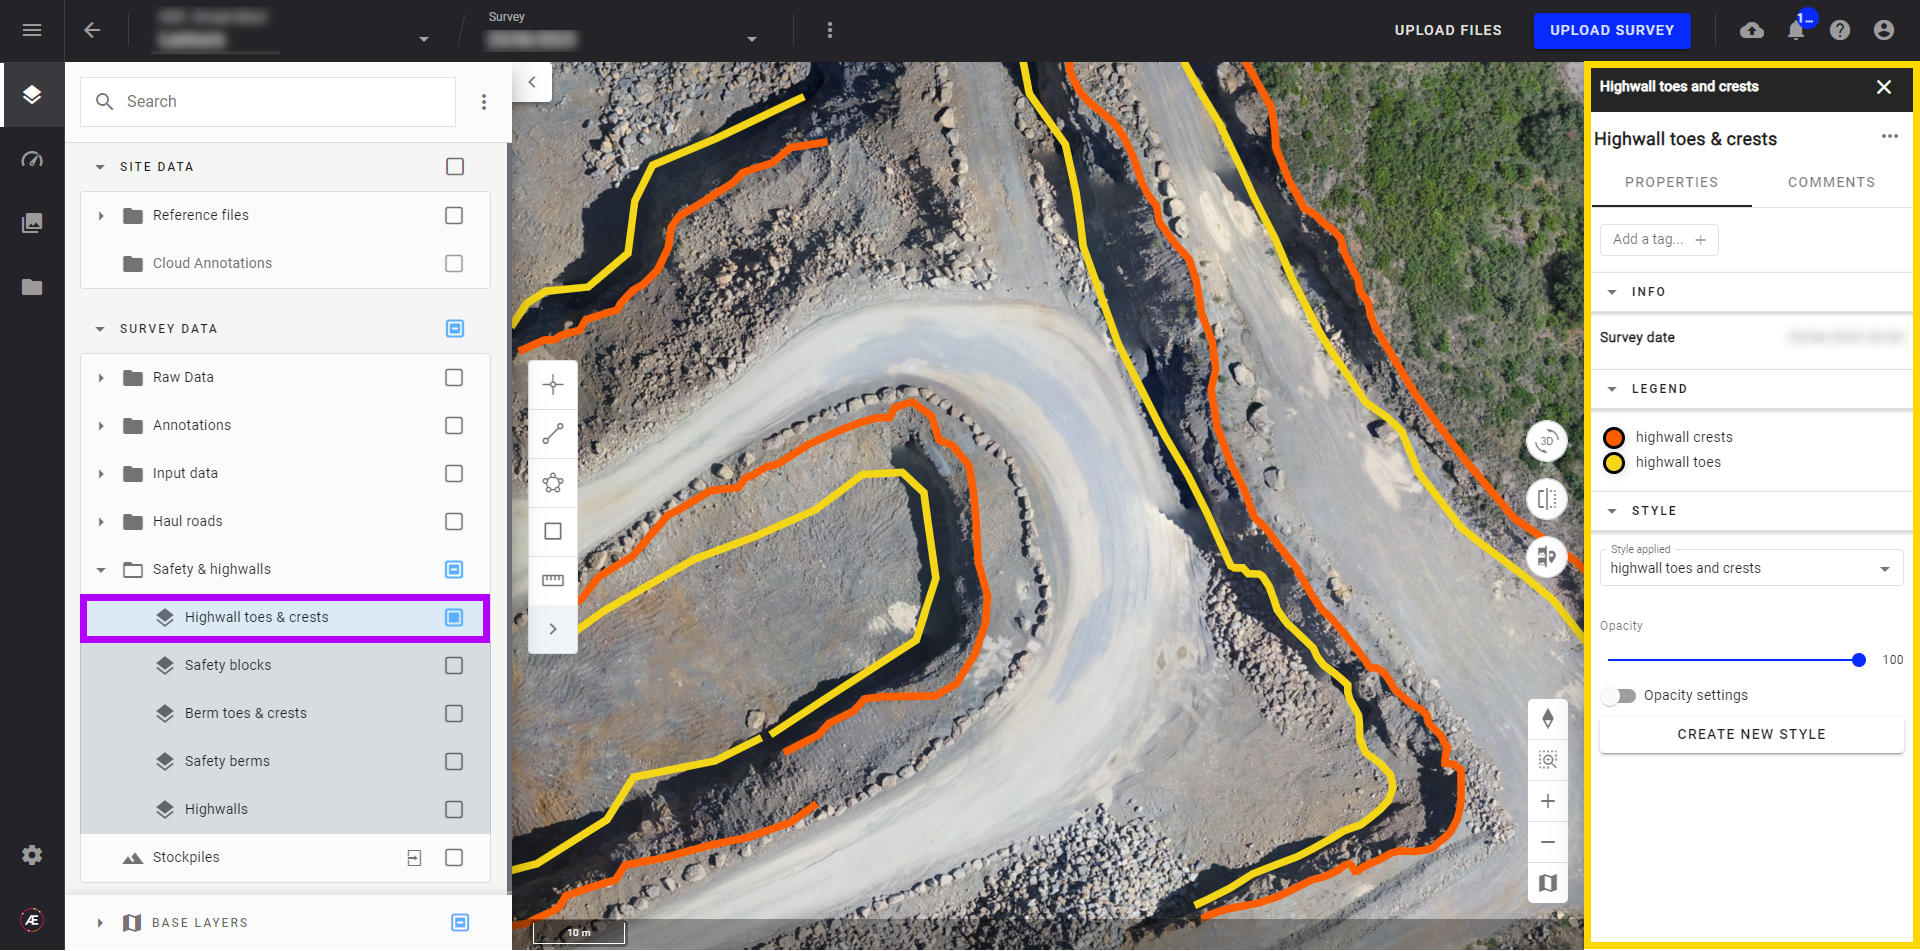
4.1 Highwall toes & crests
Delimits foot and crest of quarry faces.
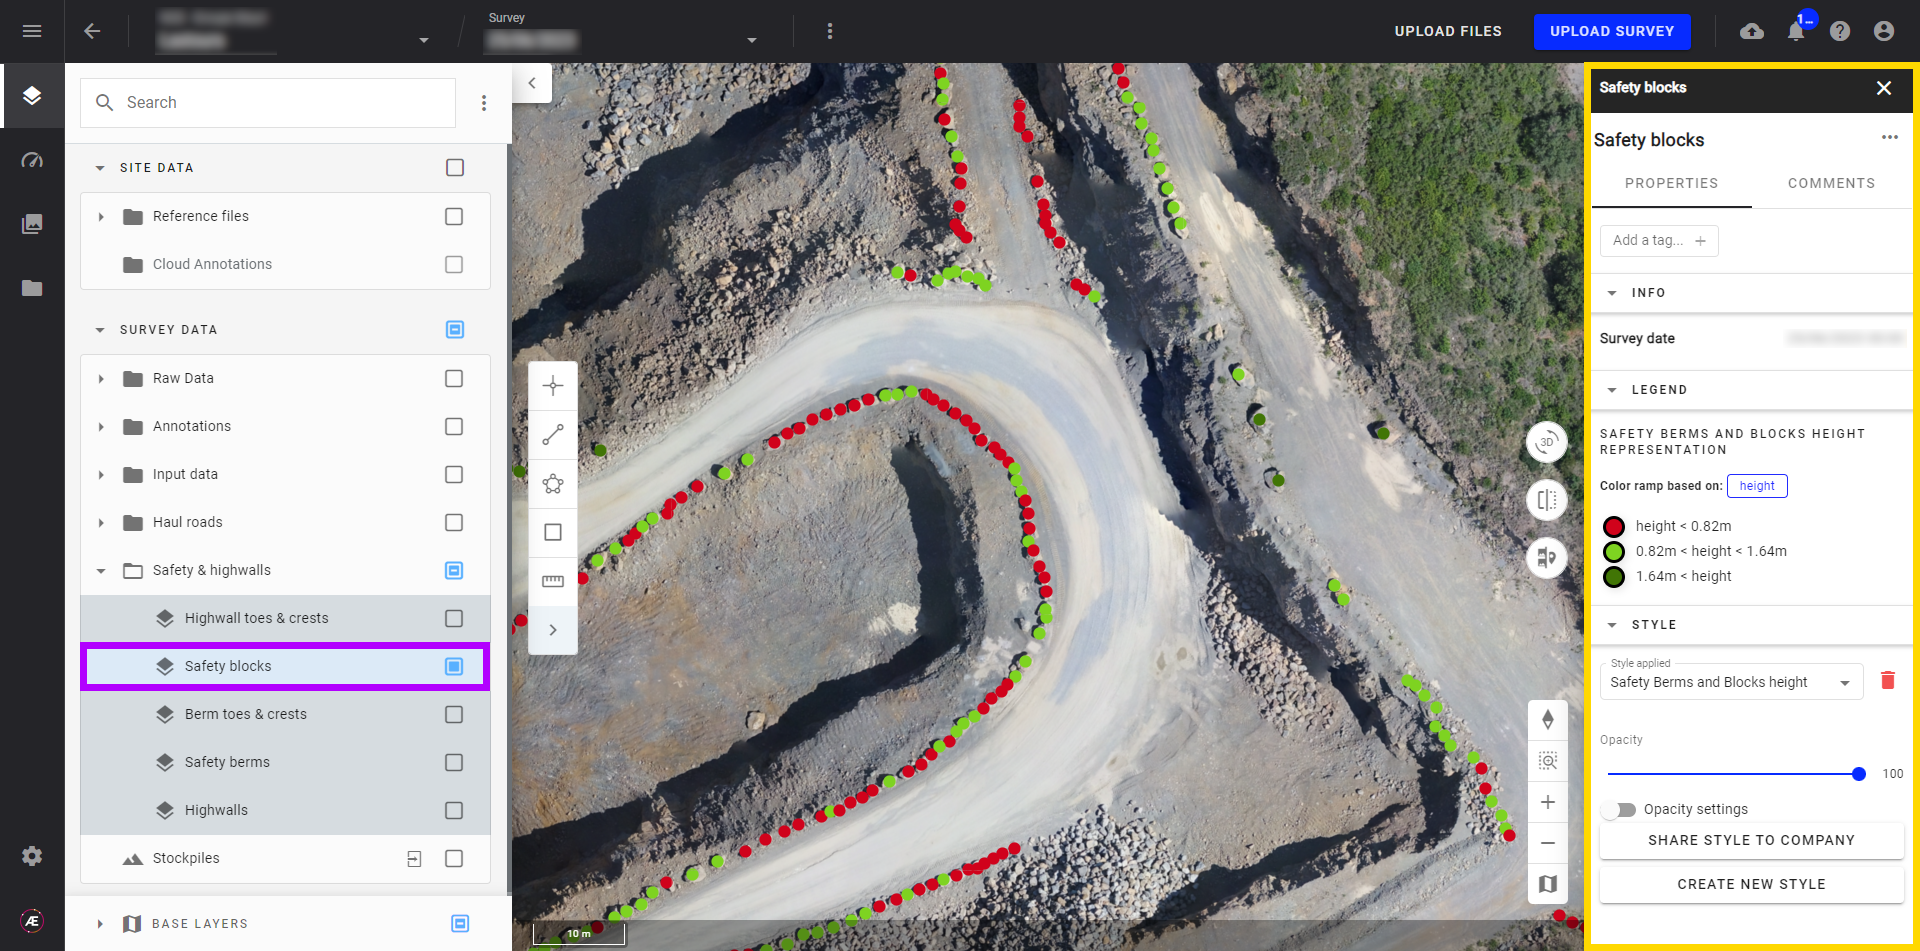
4.2 Safety blocks
Safety blocks will be displayed in different colors (red or green) based on the tire of the biggest circulating engine on site.
In the following example, red dots are safety blocks that do not respect the safety height. These parameters can be defined in Project Settings.
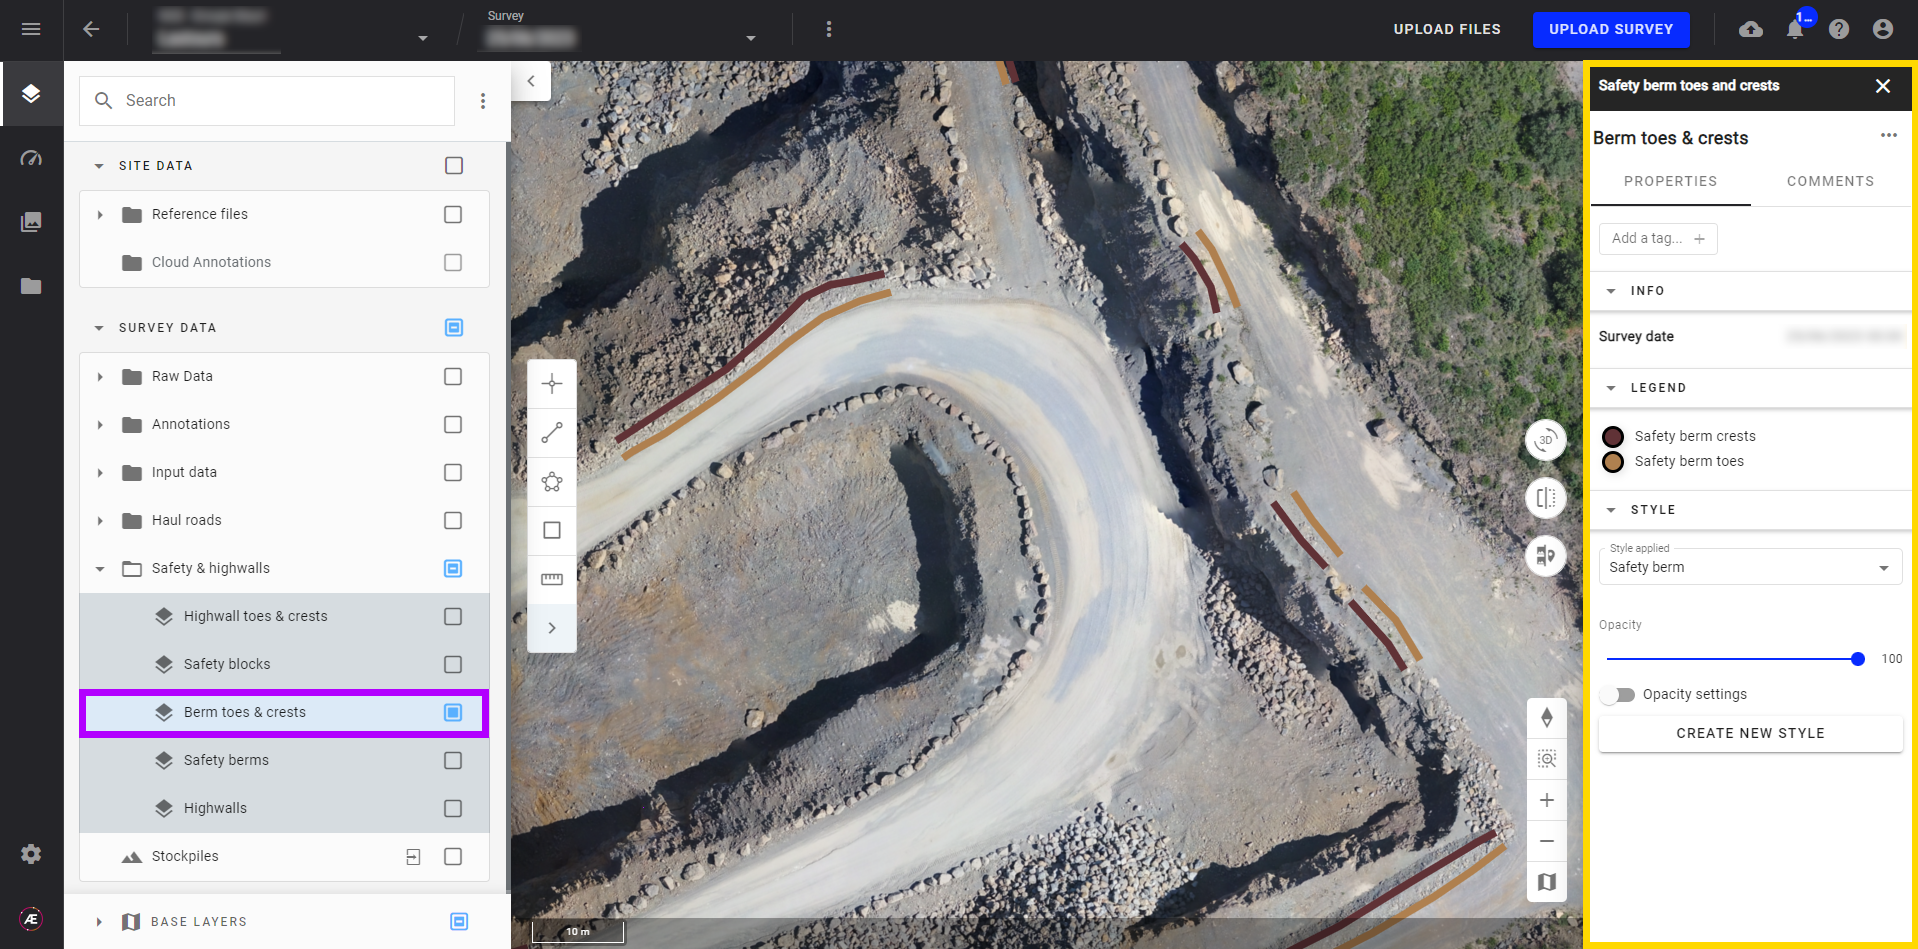
4.3 Berm toes & crests
Identifies safety berm toes and crests.
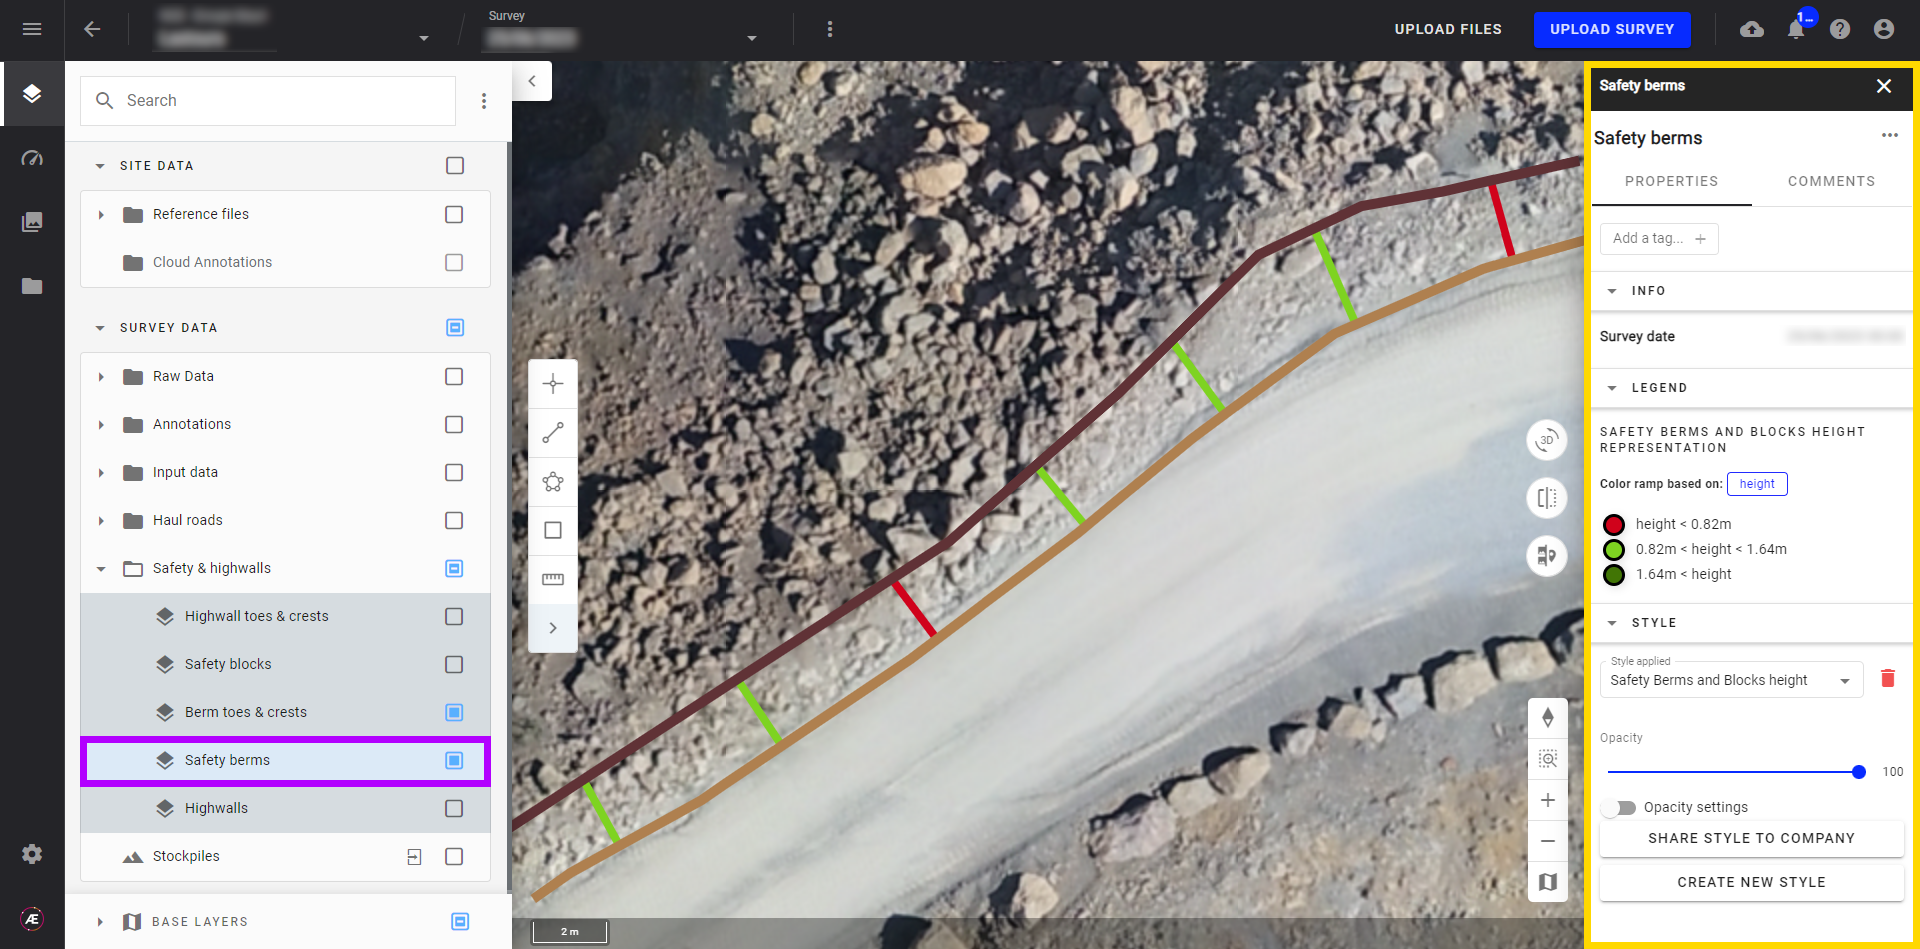
4.4 Safety berms
Represents berms height measurement by section according to defined parameters.
For best use, this layer should be combined with the "Berm toes & crests" layer.
4.5 Highwalls
Highwalls are displayed in different colors according to their predefined height. In the image below, toes and crests are also displayed to contextualize the area.
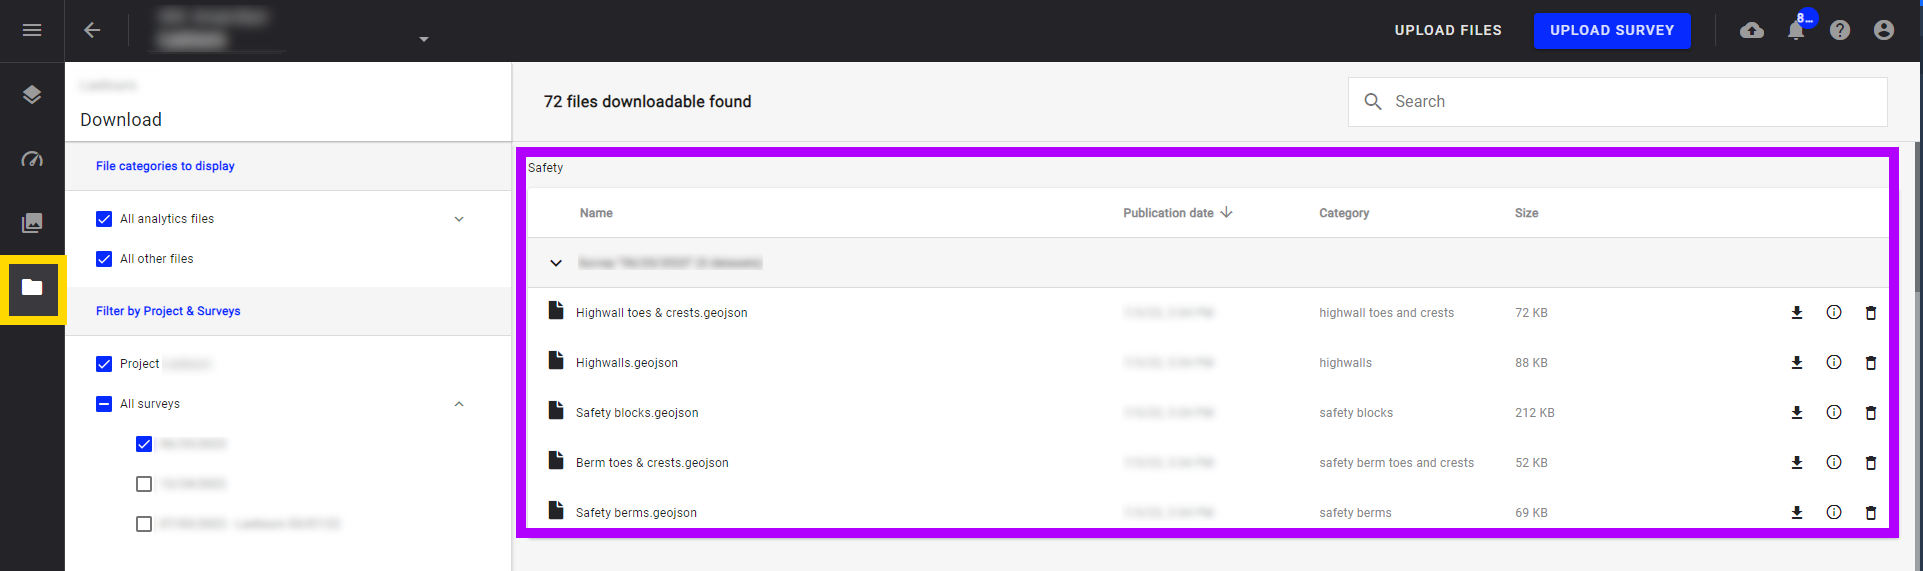
5. Deliverables
The analytics result files are located in the "Download" menu. 5 geojson files are exportable.